Analysis Summary
Notes:
- 1) No attempt has been made to eliminate the non-significant decimal places.
- 2) This batgrbproduct analysis is done using the HEASARC data.
- 3) This batgrbproduct analysis is using the flight position for the mask-weighting calculation.
======================================================================
                  BAT GRB EVENT DATA PROCESSING REPORT
    Process Script Ver: batgrbproduct v2.46
    Process Start Time: Wed Jan 22 19:56:08 EST 2014
             Host Name: batevent1
   Current Working Dir: /local/data/batevent/batevent_reproc/trigger158593
======================================================================

  Trigger: 00158593      Segment: 000

  BAT Trigger Time: 150323433.024   [s; MET]
      Trigger Stop: 150323437.12   [s; MET]
               UTC: 2005-10-06T20:30:33.255560    [includes UTCF correction]
       Where From?: TDRSS position message

  BAT
    RA: 110.830064621421   Dec: 9.53064743051798  [deg; J2000]

     Catalogged Source?: NO
     Point Source?:      YES
     GRB Indicated?:     YES    [ by BAT flight software ]
     Image S/N Ratio:    7.25
     Image Trigger?:     NO
     Rate S/N Ratio:     17.1464281994822  [ if not an image trigger ]
     Image S/N Ratio:    7.25

  Analysis Position:   [ source = BAT ]
    RA: 110.830064621421   Dec: 9.53064743051798  [deg; J2000]

  Refined Position:   [ source = BAT pre-slew burst ]
    RA: 110.806862623421   Dec: 9.50771566571519  [deg; J2000]
        { 07h 23m 13.6s , +09d 30' 27.8" }
         +/- 1.47526079326717 [arcmin] (estimated 90% radius based on SNR)
         +/- 0.600145954690198 [arcmin] (formal 1-sigma fit error)
    SNR: 17.453287236967

  Angular difference between the analysis and refined position is 1.943736 arcmin

  Partial Coding Fraction: 0.2167969    [ including projection effects ]

  Duration
     T90: 35.4079999625683 +/- 8.93460687736312
        Measured from: -11.8879999816418
                   to: 23.5199999809265     [s; relative to TRIGTIME]
     T50: 11.7919999659061 +/- 7.99679936024475
        Measured from: -1.391999989748
                   to: 10.3999999761581     [s; relative to TRIGTIME]


  Fluence
     Peak Flux  (peak 1 second)
        Measured from: 3.23600000143051
                   to: 4.23600000143051     [s; relative to TRIGTIME]
     Total Fluence
        Measured from: -14.3519999980927
                   to: 26.5920000076294     [s; relative to TRIGTIME]

             Band 1     Band 2     Band 3     Band 4
              15-25      25-50     50-100    100-350     keV
 Total     0.549486   0.855859   0.539540   0.262976
           0.066751   0.069867   0.059698   0.050292 [error]
 Peak      0.046688   0.076444   0.065008   0.014963
           0.011212   0.011810   0.010922   0.008756 [error]

     [ fluence units of on-axis counts / fully illuminated detector ]

======================================================================


====== Table of the duration information =============================

        Value   tstart    tstop
T100   40.944  -14.352   26.592
T90    35.408  -11.888   23.520
T50    11.792   -1.392   10.400
Peak    1.000    3.236    4.236


====== Spectral Analysis Summary =====================================

Model      : spectral model: simple power-law (PL) and cutoff power-law (CPL)
Ph_index   : photon index: E^{Ph_index}
Ph_90err   : 90% error of the photon index
Epeak      : Epeak in keV
Epeak_90err: 90% error of Epeak
Norm       : normalization at 50 keV in both the PL model and CPL model
Nomr_90err : 90% error of the normalization
chi2       : Chi-Squared
dof        : degree of freedo

=== Time-averaged spectral analysis ===
(Best model with acceptable fit: N/A)

Model Ph_index Ph_90err_low Ph_90err_hi  Epeak  Epeak_90err_low  Epeak_90err_hi  Norm       Nomr_90err_low    Norm_90err_hi    chi2    dof
PL      -1.508    -0.169      0.169       -           -               -         3.49e-03     -3.43e-04          3.42e-04      72.220   57
CPL     -1.429    -0.851      0.580      350.444    -350.444      -350.444      3.84e-03     -1.54e-03          3.64e-03      72.270   56


=== 1-s peak spectral analysis ===
(Best model with acceptable fit: PL)

Model Ph_index Ph_90err_low Ph_90err_hi  Epeak  Epeak_90err_low  Epeak_90err_hi  Norm       Nomr_90err_low    Norm_90err_hi    chi2    dof
PL      -1.344     -0.273     0.277       -           -               -         1.40e-02     -2.34e-03          2.33e-03      40.760   57
CPL     -0.645     -0.888     1.363       98.338     -38.481       -98.338      3.14e-02     -1.91e-02          1.16e-01      39.480   56


=== Fluence/Peak Flux Summary ===

              Model    Band1     Band2     Band3     Band4     Band5     Total
                       15-25     25-50    50-100    100-350    15-150    15-350    keV
Fluence         PL   1.84e-07  3.36e-07  4.73e-07  1.39e-06  1.35e-06  2.39e-06   erg/cm2
      90%_error_low -3.02e-08 -3.45e-08 -5.99e-08 -3.44e-07 -1.44e-07 -3.96e-07   erg/cm2
      90%_error_hi   3.14e-08  3.42e-08  5.95e-08  4.15e-07  1.45e-07  4.53e-07   erg/cm2
Peak flux       PL   4.96e-01  5.47e-01  4.31e-01  5.61e-01  1.68e+00  2.03e+00   ph/cm2/s
      90%_error_low -1.41e-01 -1.03e-01 -8.49e-02 -1.96e-01 -2.88e-01 -3.45e-01   ph/cm2/s
      90%_error_hi   1.53e-01  1.02e-01  8.39e-02  2.52e-01  2.89e-01  3.49e-01   ph/cm2/s

Fluence        CPL   1.84e-07  3.36e-07  4.73e-07  1.39e-06  1.35e-06  2.38e-06   erg/cm2
      90%_error_low -3.03e-08 -3.40e-08 -5.99e-08 -8.71e-07 -1.59e-07 -8.80e-07   erg/cm2
      90%_error_hi   2.72e-08  4.24e-08  6.31e-08  2.33e-07  1.44e-07  2.42e-07   erg/cm2
Peak flux      CPL   4.37e-01  5.86e-01  4.59e-01  2.72e-01  1.64e+00  1.75e+00   ph/cm2/s
      90%_error_low -1.63e-01 -1.20e-01 -9.66e-02 -2.72e-01 -2.95e-01 -3.61e-01   ph/cm2/s
      90%_error_hi   1.75e-01  1.27e-01  1.01e-01  3.81e-01  2.95e-01  5.07e-01   ph/cm2/s

======================================================================
Image
Pre-slew 15.0-350.0 keV image (Event data)
#   RAcent    DECcent   POSerr    Theta     Phi              Peak Cts       SNR   Name
  110.8069     9.5077   0.0111    35.8073   120.7639         2.4016122     17.453 TRIG_00158593

Foreground time interval of the image:
-14.352  26.592 (delta_t =  40.944 [sec])
Background time interval of the image:
-299.024 -14.352 (delta_t = 284.672 [sec])
Light Curves
Note: The mask-weighted lightcurves have units of either count/det or counts/sec/det, where a det is 0.4 x 0.4 = 0.16 sq cm.
Full-time range; 1 s binning
Other quick-look light curves:
- 64 ms binning (zoomed)
- 16 ms binning (zoomed)
- 8 ms binning (zoomed)
- 2 ms binning (zoomed)
- SN=5 or 10 s binning (full-time range)
- Raw light curve
Spectra
- 64 ms binning (zoomed)
- 16 ms binning (zoomed)
- 8 ms binning (zoomed)
- 2 ms binning (zoomed)
- SN=5 or 10 s binning (full-time range)
- Raw light curve
Spectra
Notes:
- 1) The fitting includes the systematic errors.
- 2) When the burst includes telescope slew time periods, the fitting uses an average response file made from multiple 5-s response files through out the slew time plus single time preiod for the non-slew times, and weighted by the total counts in the corresponding time period using addrmf. An average response file is needed becuase a spectral fit using the pre-slew DRM will introduce some errors in both a spectral shape and a normalization if the PHA file contains a lot of the slew/post-slew time interval.
- 3) For fits to more complicated models (e.g. a power-law over a cutoff power-law), the BAT team has decided to require a chi-square improvement of more than 6 for each extra dof.
Time averaged spectrum fit using the average DRM
Power-law model

Time interval is from  -14.352 sec. to   26.592 sec.

Spectral model in power-law:
------------------------------------------------------------
Parameters  : value       lower 90%   higher 90%
Photon index: -1.50825     ( -0.169434   0.169317 )
Norm@50keV  : 3.49179E-03    ( -0.000343347   0.000341874 )
------------------------------------------------------------
#Fit statistic : Chi-Squared =          72.22 using 59 PHA bins.
# Reduced chi-squared =          1.267 for     57 degrees of freedom
# Null hypothesis probability =   8.429894e-02

Photon flux (15-150 keV)    in 40.94 sec: 0.436898 ( -0.043329  0.043434 ) ph/cm2/s
Energy fluence (15-150 keV)             : 1.3545e-06 ( -1.4435e-07  1.45423e-07 ) ergs/cm2
Cutoff power-law model
Time interval is from  -14.352 sec. to   26.592 sec.
Spectral model in the cutoff power-law:
------------------------------------------------------------
Parameters  : value       lower 90%   higher 90%
Photon index: -1.50581     ( -0.844585   0.586407 )
Epeak [keV] : 9995.80      ( -9995.85 -9995.85 )
Norm@50keV  : 3.50214E-03    ( -0.00120259   0.00397722 )
------------------------------------------------------------
#Fit statistic : Chi-Squared =          72.22 using 59 PHA bins.
# Reduced chi-squared =          1.290 for     56 degrees of freedom
# Null hypothesis probability =   7.113416e-02

Photon flux (15-150 keV)    in 40.94 sec: 0.436867 ( -0.044255  0.043246 ) ph/cm2/s
Energy fluence (15-150 keV)             : 1.35428e-06 ( -1.59389e-07  1.44397e-07 ) ergs/cm2
1-s peak spectrum fit
Power-law model
Time interval is from    3.236 sec. to    4.236 sec.

Spectral model in power-law:
------------------------------------------------------------
Parameters  : value       lower 90%   higher 90%
Photon index: -1.34381     ( -0.273102   0.277147 )
Norm@50keV  : 1.39827E-02    ( -0.00233849   0.00233307 )
------------------------------------------------------------
#Fit statistic : Chi-Squared =          40.76 using 59 PHA bins.
# Reduced chi-squared =         0.7151 for     57 degrees of freedom
# Null hypothesis probability =   9.486049e-01

Photon flux (15-150 keV)    in 1 sec: 1.68240 ( -0.28833  0.28928 ) ph/cm2/s
Energy fluence (15-150 keV)             : 1.36773e-07 ( -2.47725e-08  2.50276e-08 ) ergs/cm2
Cutoff power-law model
Time interval is from    3.236 sec. to    4.236 sec.
Spectral model in the cutoff power-law:
------------------------------------------------------------
Parameters  : value       lower 90%   higher 90%
Photon index: -0.644698     ( -0.88771   1.36312 )
Epeak [keV] : 98.3377      ( -38.4824 -98.3393 )
Norm@50keV  : 3.14040E-02    ( -0.0190567   0.116158 )
------------------------------------------------------------
#Fit statistic : Chi-Squared =          39.48 using 59 PHA bins.
# Reduced chi-squared =         0.7051 for     56 degrees of freedom
# Null hypothesis probability =   9.537959e-01

Photon flux (15-150 keV)    in 1 sec: 1.64386 ( -0.29476  0.29527 ) ph/cm2/s
Energy fluence (15-150 keV)             : 1.30551e-07 ( -2.71654e-08  2.69524e-08 ) ergs/cm2
Time-resolved spectra
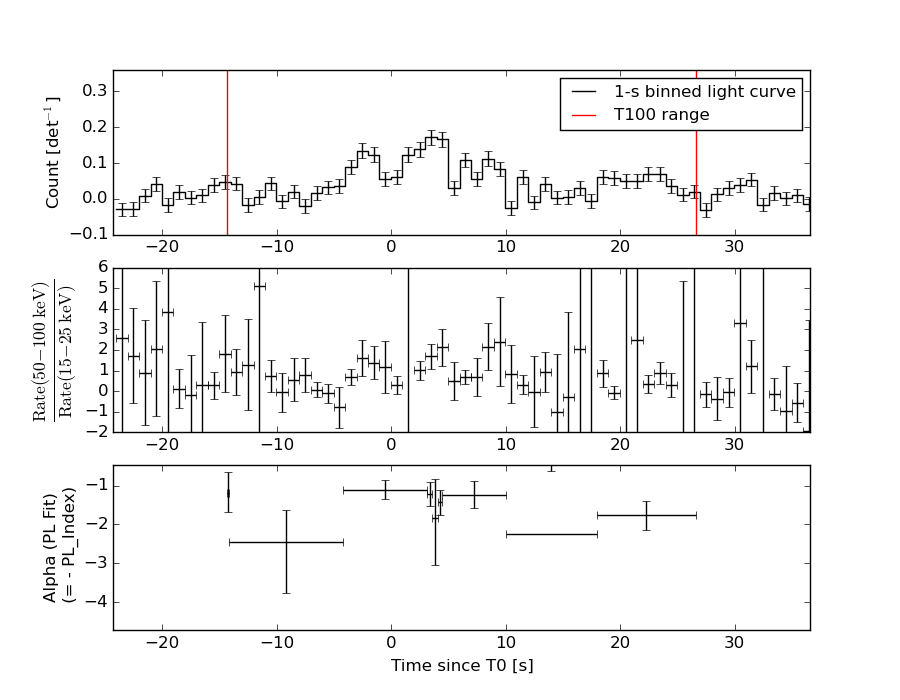
Distribution
T90 vs. Hardness ratio plot
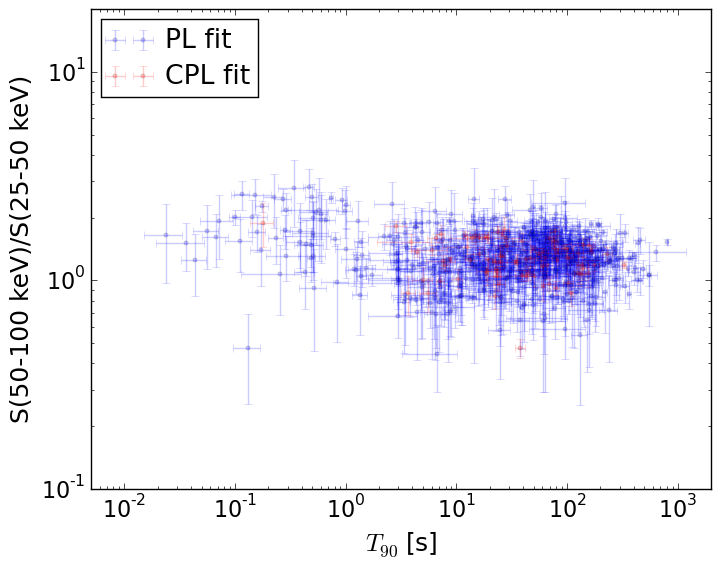
T90                                   = N/A sec.
Hardness ratio (energy fluence ratio) = N/A
S(15-50 keV) vs. S(50-150 keV) plot
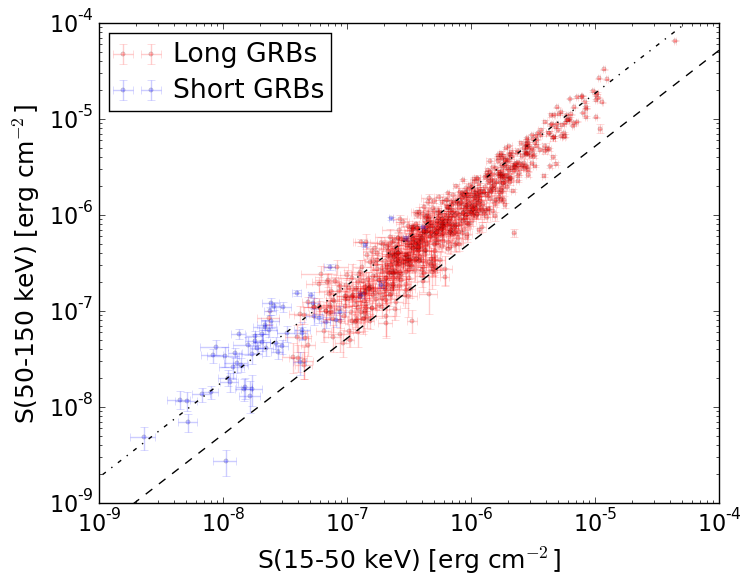
S(15-50 keV)  = N/A
S(50-150 keV) = N/A
The dash-dotted line and the dashed line traces the fluences calculated from the Band function with Epeak = 15 and 150 keV, respectively. Both lines assume a canonical values of alpha = -1 and beta = -2.5.
Mask shadow pattern
IMX = -3.690049738593683E-01, IMY = -6.199002061498001E-01
Spacecraft aspect plot
Bright source in the pre-burst/pre-slew/post-slew images
Pre-burst image of 15-350 keV band
Time interval of the image:
-299.024000 -14.352000

# RAcent  DECcent POSerr Theta    Phi  PeakCts   SNR AngSep     Name
#  [deg]    [deg]    ['] [deg]  [deg]                   [']
135.5067 -40.5532    0.6  28.7    1.3   3.7503  18.6    1.0	Vela X-1
170.1383 -60.6775    4.8  53.5  -23.2   1.2309   2.4    6.2	Cen X-3
114.5591 -41.3917    2.7  36.5   27.0   1.0795   4.4 ------	UNKNOWN
138.7870 -48.4440    2.7  36.3   -4.3   0.9812   4.3 ------	UNKNOWN
Pre-slew background subtracted image of 15-350 keV band
Time interval of the image:
-14.352000 26.592000

# RAcent  DECcent POSerr Theta    Phi  PeakCts   SNR AngSep     Name
#  [deg]    [deg]    ['] [deg]  [deg]                   [']
135.6917 -40.5130   89.5  28.6    1.0   0.0087   0.1    7.8	Vela X-1
170.0997 -60.5146    0.0  53.4  -23.3  -0.3618  -1.9    9.1	Cen X-3
110.8069   9.5077    0.7  35.8  120.8   2.4010  17.5 ------	UNKNOWN
109.6407 -49.0158    2.0  44.4   22.7   0.7700   5.7 ------	UNKNOWN
Post-slew image of 15-350 keV band
Time interval of the image:
92.276590 303.044100

# RAcent  DECcent POSerr Theta    Phi  PeakCts   SNR AngSep     Name
#  [deg]    [deg]    ['] [deg]  [deg]                   [']
 83.6322  22.0131    0.3  28.9  112.1   9.0988  38.2    0.1	Crab
135.7248 -40.3974   10.7  54.9  -29.7   0.7952   1.1   13.0	Vela X-1
102.2057  29.1215    2.7  21.2  152.0   0.6769   4.3 ------	UNKNOWN
114.6522  51.4724    2.5  42.1  176.8   1.0316   4.6 ------	UNKNOWN
126.4047 -45.5589    2.8  56.8  -19.7   2.7483   4.1 ------	UNKNOWN