Analysis Summary
Notes:
- 1) No attempt has been made to eliminate the non-significant decimal places.
- 2) This batgrbproduct analysis is done using the HEASARC data.
- 3) This batgrbproduct analysis is using the flight position for the mask-weighting calculation.
======================================================================
                  BAT GRB EVENT DATA PROCESSING REPORT
    Process Script Ver: batgrbproduct v2.46
    Process Start Time: Wed Jan 22 19:52:22 EST 2014
             Host Name: batevent1
   Current Working Dir: /local/data/batevent/batevent_reproc/trigger159913
======================================================================

  Trigger: 00159913      Segment: 000

  BAT Trigger Time: 151133011.136   [s; MET]
      Trigger Stop: 151133015.232   [s; MET]
               UTC: 2005-10-16T05:23:31.350440    [includes UTCF correction]
       Where From?: TDRSS position message

  BAT
    RA: 122.811371428469   Dec: -18.311210933463  [deg; J2000]

     Catalogged Source?: NO
     Point Source?:      YES
     GRB Indicated?:     YES    [ by BAT flight software ]
     Image S/N Ratio:    9.72
     Image Trigger?:     NO
     Rate S/N Ratio:     12.4498995979887  [ if not an image trigger ]
     Image S/N Ratio:    9.72

  Analysis Position:   [ source = BAT ]
    RA: 122.811371428469   Dec: -18.311210933463  [deg; J2000]

  Refined Position:   [ source = BAT pre-slew burst ]
    RA: 122.810984377459   Dec: -18.3000451512477  [deg; J2000]
        { 08h 11m 14.6s , -18d 18' 00.2" }
         +/- 1.93701677274414 [arcmin] (estimated 90% radius based on SNR)
         +/- 0.849059302469891 [arcmin] (formal 1-sigma fit error)
    SNR: 11.8284499138523

  Angular difference between the analysis and refined position is 0.670310 arcmin

  Partial Coding Fraction: 0.1777344    [ including projection effects ]

  Duration
     T90: 21 +/- 6.08276253029822
        Measured from: -0.136000007390976
                   to: 20.863999992609     [s; relative to TRIGTIME]
     T50: 7 +/- 5.09901951359278
        Measured from: 1.86399999260902
                   to: 8.86399999260902     [s; relative to TRIGTIME]


  Fluence
     Peak Flux  (peak 1 second)
        Measured from: 4.86399999260902
                   to: 5.86399999260902     [s; relative to TRIGTIME]
     Total Fluence
        Measured from: -0.136000007390976
                   to: 22.863999992609     [s; relative to TRIGTIME]

             Band 1     Band 2     Band 3     Band 4
              15-25      25-50     50-100    100-350     keV
 Total     0.356641   0.492525   0.347141   0.085864
           0.061624   0.065061   0.056287   0.047652 [error]
 Peak      0.039038   0.055653   0.038189   0.017926
           0.013206   0.013476   0.012262   0.010575 [error]

     [ fluence units of on-axis counts / fully illuminated detector ]

======================================================================


====== Table of the duration information =============================

        Value   tstart    tstop
T100   23.000   -0.136   22.864
T90    21.000   -0.136   20.864
T50     7.000    1.864    8.864
Peak    1.000    4.864    5.864


====== Spectral Analysis Summary =====================================

Model      : spectral model: simple power-law (PL) and cutoff power-law (CPL)
Ph_index   : photon index: E^{Ph_index}
Ph_90err   : 90% error of the photon index
Epeak      : Epeak in keV
Epeak_90err: 90% error of Epeak
Norm       : normalization at 50 keV in both the PL model and CPL model
Nomr_90err : 90% error of the normalization
chi2       : Chi-Squared
dof        : degree of freedo

=== Time-averaged spectral analysis ===
(Best model with acceptable fit: PL)

Model Ph_index Ph_90err_low Ph_90err_hi  Epeak  Epeak_90err_low  Epeak_90err_hi  Norm       Nomr_90err_low    Norm_90err_hi    chi2    dof
PL      -1.741    -0.253      0.244       -           -               -         3.96e-03     -6.01e-04          5.92e-04      61.250   57
CPL     -1.471    -0.700      1.156       95.564     -95.521       -95.564      5.48e-03     -5.48e-03          1.58e-02      61.030   56


=== 1-s peak spectral analysis ===
(Best model with acceptable fit: PL)

Model Ph_index Ph_90err_low Ph_90err_hi  Epeak  Epeak_90err_low  Epeak_90err_hi  Norm       Nomr_90err_low    Norm_90err_hi    chi2    dof
PL      -1.537     -0.510     0.516       -           -               -         1.03e-02     -2.82e-03          2.78e-03      53.740   57
CPL     -1.551     -0.501     0.535     9999.360    -9999.360      -9999.360      1.04e-02     -2.76e-03          2.97e-02      53.740   56


=== Fluence/Peak Flux Summary ===

              Model    Band1     Band2     Band3     Band4     Band5     Total
                       15-25     25-50    50-100    100-350    15-150    15-350    keV
Fluence         PL   1.46e-07  2.31e-07  2.77e-07  6.45e-07  8.41e-07  1.30e-06   erg/cm2
      90%_error_low -3.26e-08 -3.37e-08 -5.51e-08 -2.32e-07 -1.31e-07 -2.89e-07   erg/cm2
      90%_error_hi   3.44e-08  3.35e-08  5.45e-08  3.00e-07  1.32e-07  3.39e-07   erg/cm2
Peak flux       PL   4.41e-01  4.34e-01  2.99e-01  3.25e-01  1.30e+00  1.50e+00   ph/cm2/s
      90%_error_low -2.06e-01 -1.35e-01 -1.02e-01 -1.83e-01 -3.69e-01 -4.00e-01   ph/cm2/s
      90%_error_hi   2.35e-01  1.28e-01  9.81e-02  2.91e-01  3.71e-01  4.01e-01   ph/cm2/s

Fluence        CPL   1.40e-07  2.39e-07  2.82e-07  4.29e-07  8.27e-07  1.09e-06   erg/cm2
      90%_error_low -3.88e-08 -3.97e-08 -5.79e-08    N/A    -1.41e-07 -3.54e-07   erg/cm2
      90%_error_hi   3.72e-08  4.42e-08  6.04e-08    N/A     1.39e-07  3.25e-07   erg/cm2
Peak flux      CPL   4.55e-01  4.34e-01  2.96e-01  3.24e-01  1.31e+00  1.50e+00   ph/cm2/s
      90%_error_low -2.22e-01 -1.35e-01 -9.98e-02     N/A   -3.46e-01 -3.99e-01   ph/cm2/s
      90%_error_hi   2.28e-01  1.31e-01  1.03e-01     N/A    3.69e-01  4.00e-01   ph/cm2/s

======================================================================
Image
Pre-slew 15.0-350.0 keV image (Event data)
#   RAcent    DECcent   POSerr    Theta     Phi              Peak Cts       SNR   Name
  122.8110   -18.3000   0.0163    49.2965     9.1424         1.3786934     11.828 TRIG_00159913

Foreground time interval of the image:
 -0.136  22.864 (delta_t =  23.000 [sec])
Background time interval of the image:
-299.136  -0.136 (delta_t = 299.000 [sec])
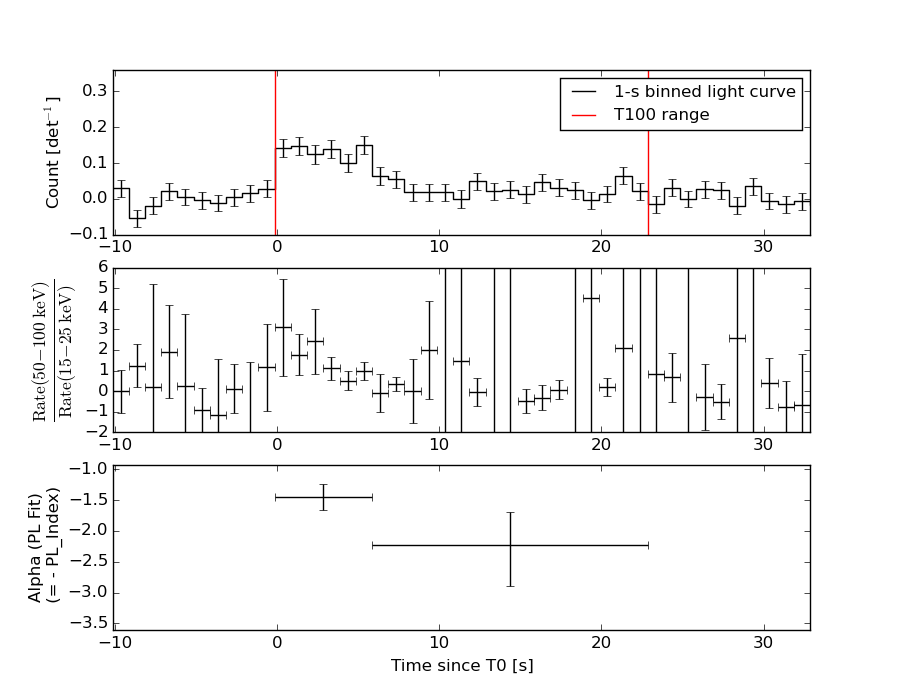
Light Curves
Note: The mask-weighted lightcurves have units of either count/det or counts/sec/det, where a det is 0.4 x 0.4 = 0.16 sq cm.
Full-time range; 1 s binning
Other quick-look light curves:
- 64 ms binning (zoomed)
- 16 ms binning (zoomed)
- 8 ms binning (zoomed)
- 2 ms binning (zoomed)
- SN=5 or 10 s binning (full-time range)
- Raw light curve
Spectra
- 64 ms binning (zoomed)
- 16 ms binning (zoomed)
- 8 ms binning (zoomed)
- 2 ms binning (zoomed)
- SN=5 or 10 s binning (full-time range)
- Raw light curve
Spectra
Notes:
- 1) The fitting includes the systematic errors.
- 2) When the burst includes telescope slew time periods, the fitting uses an average response file made from multiple 5-s response files through out the slew time plus single time preiod for the non-slew times, and weighted by the total counts in the corresponding time period using addrmf. An average response file is needed becuase a spectral fit using the pre-slew DRM will introduce some errors in both a spectral shape and a normalization if the PHA file contains a lot of the slew/post-slew time interval.
- 3) For fits to more complicated models (e.g. a power-law over a cutoff power-law), the BAT team has decided to require a chi-square improvement of more than 6 for each extra dof.
Time averaged spectrum fit using the average DRM
Power-law model
Time interval is from   -0.136 sec. to   22.864 sec.

Spectral model in power-law:
------------------------------------------------------------
Parameters  : value       lower 90%   higher 90%
Photon index: -1.74139     ( -0.253292   0.244267 )
Norm@50keV  : 3.95786E-03    ( -0.000601214   0.000592003 )
------------------------------------------------------------
#Fit statistic : Chi-Squared =          61.25 using 59 PHA bins.
# Reduced chi-squared =          1.075 for     57 degrees of freedom
# Null hypothesis probability =   3.259861e-01

Photon flux (15-150 keV)    in 23 sec: 0.533504 ( -0.0783  0.078517 ) ph/cm2/s
Energy fluence (15-150 keV)             : 8.40519e-07 ( -1.30618e-07  1.31731e-07 ) ergs/cm2
Cutoff power-law model
Time interval is from   -0.136 sec. to   22.864 sec.
Spectral model in the cutoff power-law:
------------------------------------------------------------
Parameters  : value       lower 90%   higher 90%
Photon index: -1.47051     ( -0.699753   1.156 )
Epeak [keV] : 95.5638      ( -95.5268 -95.5691 )
Norm@50keV  : 5.47584E-03    ( -0.00547564   0.0158481 )
------------------------------------------------------------
#Fit statistic : Chi-Squared =          61.03 using 59 PHA bins.
# Reduced chi-squared =          1.090 for     56 degrees of freedom
# Null hypothesis probability =   2.998826e-01

Photon flux (15-150 keV)    in 23 sec: 0.528176 ( -0.080966  0.080748 ) ph/cm2/s
Energy fluence (15-150 keV)             : 8.26813e-07 ( -1.41423e-07  1.39344e-07 ) ergs/cm2
1-s peak spectrum fit
Power-law model
Time interval is from    4.864 sec. to    5.864 sec.

Spectral model in power-law:
------------------------------------------------------------
Parameters  : value       lower 90%   higher 90%
Photon index: -1.53702     ( -0.509492   0.515542 )
Norm@50keV  : 1.03460E-02    ( -0.00281931   0.00278498 )
------------------------------------------------------------
#Fit statistic : Chi-Squared =          53.74 using 59 PHA bins.
# Reduced chi-squared =         0.9427 for     57 degrees of freedom
# Null hypothesis probability =   5.983070e-01

Photon flux (15-150 keV)    in 1 sec: 1.30491 ( -0.368876  0.37079 ) ph/cm2/s
Energy fluence (15-150 keV)             : 9.75955e-08 ( -2.81379e-08  2.84537e-08 ) ergs/cm2
Cutoff power-law model
Time interval is from    4.864 sec. to    5.864 sec.
Spectral model in the cutoff power-law:
------------------------------------------------------------
Parameters  : value       lower 90%   higher 90%
Photon index: -1.55094     ( -0.502404   0.53368 )
Epeak [keV] : 9999.36      ( -9999.36 -9999.36 )
Norm@50keV  : 1.03548E-02    ( -0.00276552   0.0297437 )
------------------------------------------------------------
#Fit statistic : Chi-Squared =          53.74 using 59 PHA bins.
# Reduced chi-squared =         0.9597 for     56 degrees of freedom
# Null hypothesis probability =   5.607907e-01

Photon flux (15-150 keV)    in 1 sec: 1.31008 ( -0.346469  0.36877 ) ph/cm2/s
Energy fluence (15-150 keV)             : 9.81771e-08 ( -3.40473e-08  1.77967e-08 ) ergs/cm2
Time-resolved spectra
Distribution
T90 vs. Hardness ratio plot
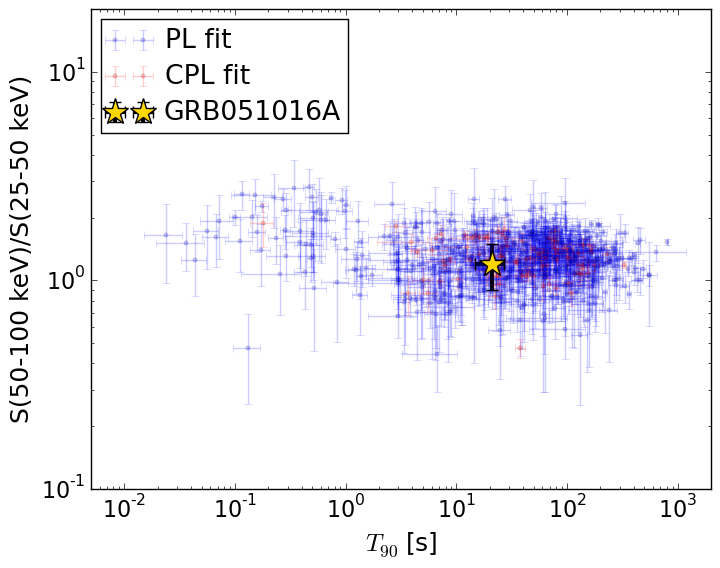
T90                                   = 21.0 sec.
Hardness ratio (energy fluence ratio) = 1.19638207269
S(15-50 keV) vs. S(50-150 keV) plot
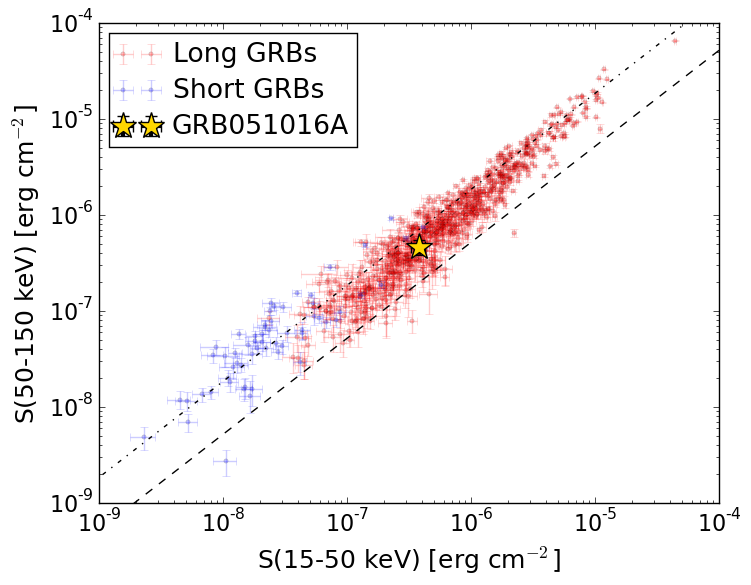
S(15-50 keV)  = 3.772383e-07
S(50-150 keV) = 4.63294e-07
The dash-dotted line and the dashed line traces the fluences calculated from the Band function with Epeak = 15 and 150 keV, respectively. Both lines assume a canonical values of alpha = -1 and beta = -2.5.
Mask shadow pattern
IMX = 1.147696424446239E+00, IMY = -1.847015406516966E-01
Spacecraft aspect plot
Bright source in the pre-burst/pre-slew/post-slew images
Pre-burst image of 15-350 keV band
Time interval of the image:
-299.136000 -0.136000

# RAcent  DECcent POSerr Theta    Phi  PeakCts   SNR AngSep     Name
#  [deg]    [deg]    ['] [deg]  [deg]                   [']
102.0885  23.9264    2.4  34.6   79.1   1.8934   4.8 ------	UNKNOWN
203.4970  73.7761    3.2  55.8 -175.6   2.6041   3.7 ------	UNKNOWN
213.4538  72.3449    2.6  58.3 -173.2   4.8480   4.3 ------	UNKNOWN
Pre-slew background subtracted image of 15-350 keV band
Time interval of the image:
-0.136000 22.864000

# RAcent  DECcent POSerr Theta    Phi  PeakCts   SNR AngSep     Name
#  [deg]    [deg]    ['] [deg]  [deg]                   [']
122.8110 -18.3000    1.0  49.3    9.1   1.3787  11.8 ------	UNKNOWN
Post-slew image of 15-350 keV band
Time interval of the image:
101.364620 302.882300

# RAcent  DECcent POSerr Theta    Phi  PeakCts   SNR AngSep     Name
#  [deg]    [deg]    ['] [deg]  [deg]                   [']
135.5612 -40.5966    1.6  24.8  -28.6   1.0322   7.3    2.9	Vela X-1
170.3267 -60.5528   71.2  53.9  -31.7   0.1093   0.2    4.2	Cen X-3
 83.3213 -50.1723    2.4  44.7   30.4   1.7771   4.9 ------	UNKNOWN
129.3115  32.8308    3.0  51.5 -178.0   1.3981   3.9 ------	UNKNOWN