Analysis Summary
Notes:
- 1) No attempt has been made to eliminate the non-significant decimal places.
- 2) This batgrbproduct analysis is done using the HEASARC data.
- 3) This batgrbproduct analysis is using the flight position for the mask-weighting calculation.
======================================================================
                  BAT GRB EVENT DATA PROCESSING REPORT
    Process Script Ver: batgrbproduct v2.46
    Process Start Time: Wed Jan 22 19:50:16 EST 2014
             Host Name: batevent1
   Current Working Dir: /local/data/batevent/batevent_reproc/trigger159994
======================================================================

  Trigger: 00159994      Segment: 000

  BAT Trigger Time: 151180088.768   [s; MET]
      Trigger Stop: 151180089.28   [s; MET]
               UTC: 2005-10-16T18:28:08.981460    [includes UTCF correction]
       Where From?: TDRSS position message

  BAT
    RA: 132.066883148705   Dec: 13.6575657183825  [deg; J2000]

     Catalogged Source?: NO
     Point Source?:      YES
     GRB Indicated?:     YES    [ by BAT flight software ]
     Image S/N Ratio:    7.15
     Image Trigger?:     NO
     Rate S/N Ratio:     15.0332963783729  [ if not an image trigger ]
     Image S/N Ratio:    7.15

  Analysis Position:   [ source = BAT ]
    RA: 132.066883148705   Dec: 13.6575657183825  [deg; J2000]

  Refined Position:   [ source = BAT pre-slew burst ]
    RA: 132.115148740965   Dec: 13.6278363005739  [deg; J2000]
        { 08h 48m 27.6s , +13d 37' 40.2" }
         +/- 1.65820546981314 [arcmin] (estimated 90% radius based on SNR)
         +/- 0.711811555609928 [arcmin] (formal 1-sigma fit error)
    SNR: 14.7689397232232

  Angular difference between the analysis and refined position is 3.331921 arcmin

  Partial Coding Fraction: 0.7890625    [ including projection effects ]

  Duration
     T90: 4 +/- 0.448218708535412
        Measured from: 0.215999990701675
                   to: 4.21599999070168     [s; relative to TRIGTIME]
     T50: 2.44800001382828 +/- 0.422203731655723
        Measured from: 0.599999994039536
                   to: 3.04800000786781     [s; relative to TRIGTIME]


  Fluence
     Peak Flux  (peak 1 second)
        Measured from: 0.109999984502792
                   to: 1.10999998450279     [s; relative to TRIGTIME]
     Total Fluence
        Measured from: 0.111999988555908
                   to: 4.61599999666214     [s; relative to TRIGTIME]

             Band 1     Band 2     Band 3     Band 4
              15-25      25-50     50-100    100-350     keV
 Total     0.153575   0.125178   0.056006  -0.001184
           0.012869   0.012984   0.010797   0.009130 [error]
 Peak      0.047252   0.067110   0.033850  -0.000811
           0.006326   0.006537   0.005409   0.004472 [error]

     [ fluence units of on-axis counts / fully illuminated detector ]

======================================================================


====== Table of the duration information =============================

        Value   tstart    tstop
T100    4.504    0.112    4.616
T90     4.000    0.216    4.216
T50     2.448    0.600    3.048
Peak    1.000    0.110    1.110


====== Spectral Analysis Summary =====================================

Model      : spectral model: simple power-law (PL) and cutoff power-law (CPL)
Ph_index   : photon index: E^{Ph_index}
Ph_90err   : 90% error of the photon index
Epeak      : Epeak in keV
Epeak_90err: 90% error of Epeak
Norm       : normalization at 50 keV in both the PL model and CPL model
Nomr_90err : 90% error of the normalization
chi2       : Chi-Squared
dof        : degree of freedo

=== Time-averaged spectral analysis ===
(Best model with acceptable fit: N/A)

Model Ph_index Ph_90err_low Ph_90err_hi  Epeak  Epeak_90err_low  Epeak_90err_hi  Norm       Nomr_90err_low    Norm_90err_hi    chi2    dof
PL      -2.337    -0.230      0.213       -           -               -         3.84e-03     -6.33e-04          6.23e-04      80.660   57
CPL     -1.588    -0.621      1.112       20.424      N/A           N/A         1.12e-02        N/A               N/A         78.340   56


=== 1-s peak spectral analysis ===
(Best model with acceptable fit: PL)

Model Ph_index Ph_90err_low Ph_90err_hi  Epeak  Epeak_90err_low  Epeak_90err_hi  Norm       Nomr_90err_low    Norm_90err_hi    chi2    dof
PL      -1.909     -0.215     0.205       -           -               -         8.97e-03     -1.31e-03          1.29e-03      59.270   57
CPL     -0.789     -0.919     1.220       44.925      -5.336        25.974      4.02e-02     -4.02e-02          1.76e-01      54.730   56


=== Fluence/Peak Flux Summary ===

              Model    Band1     Band2     Band3     Band4     Band5     Total
                       15-25     25-50    50-100    100-350    15-150    15-350    keV
Fluence         PL   4.88e-08  5.41e-08  4.29e-08  5.61e-08  1.67e-07  2.02e-07   erg/cm2
      90%_error_low -6.78e-09 -6.38e-09 -9.31e-09 -2.03e-08 -2.20e-08 -3.41e-08   erg/cm2
      90%_error_hi   6.88e-09  6.30e-09  9.78e-09  2.69e-08  2.26e-08  3.88e-08   erg/cm2
Peak flux       PL   5.47e-01  4.33e-01  2.31e-01  1.79e-01  1.29e+00  1.39e+00   ph/cm2/s
      90%_error_low -9.43e-02 -5.32e-02 -4.29e-02 -5.61e-02 -1.60e-01 -1.72e-01   ph/cm2/s
      90%_error_hi   9.75e-02  5.32e-02  4.34e-02  6.96e-02  1.60e-01  1.72e-01   ph/cm2/s

Fluence        CPL    N/A      N/A      N/A      N/A      N/A      N/A      erg/cm2
      90%_error_low -6.78e-09 -6.38e-09 -9.31e-09 -2.03e-08 -2.20e-08 -3.41e-08   erg/cm2
      90%_error_hi   6.88e-09  6.30e-09  9.78e-09  2.69e-08  2.26e-08  3.88e-08   erg/cm2
Peak flux      CPL   4.96e-01  4.95e-01  2.27e-01  4.72e-02  1.26e+00  1.27e+00   ph/cm2/s
      90%_error_low -1.06e-01 -7.34e-02 -5.69e-02 -4.72e-02 -1.62e-01 -1.67e-01   ph/cm2/s
      90%_error_hi   1.07e-01  7.78e-02  5.16e-02  9.10e-02  1.62e-01  1.73e-01   ph/cm2/s

======================================================================
Image
Pre-slew 15.0-350.0 keV image (Event data)
#   RAcent    DECcent   POSerr    Theta     Phi              Peak Cts       SNR   Name
  132.1151    13.6278   0.0131    33.2723  -168.2656         0.3662880     14.769 TRIG_00159994

Foreground time interval of the image:
  0.112   4.616 (delta_t =   4.504 [sec])
Background time interval of the image:
-299.768   0.112 (delta_t = 299.880 [sec])
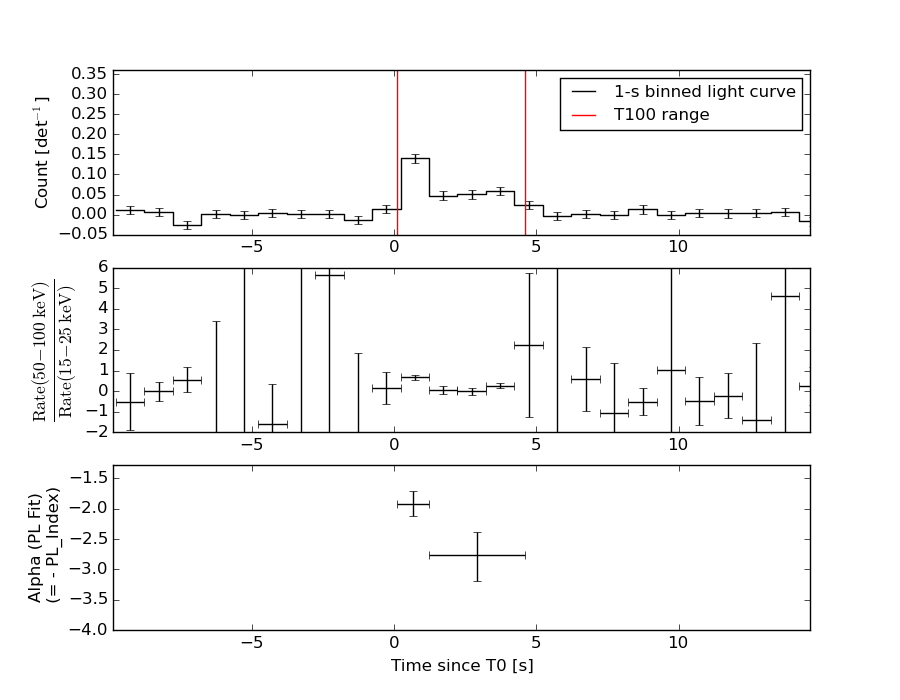
Light Curves
Note: The mask-weighted lightcurves have units of either count/det or counts/sec/det, where a det is 0.4 x 0.4 = 0.16 sq cm.
Full-time range; 1 s binning
Other quick-look light curves:
- 64 ms binning (zoomed)
- 16 ms binning (zoomed)
- 8 ms binning (zoomed)
- 2 ms binning (zoomed)
- SN=5 or 10 s binning (full-time range)
- Raw light curve
Spectra
- 64 ms binning (zoomed)
- 16 ms binning (zoomed)
- 8 ms binning (zoomed)
- 2 ms binning (zoomed)
- SN=5 or 10 s binning (full-time range)
- Raw light curve
Spectra
Notes:
- 1) The fitting includes the systematic errors.
- 2) When the burst includes telescope slew time periods, the fitting uses an average response file made from multiple 5-s response files through out the slew time plus single time preiod for the non-slew times, and weighted by the total counts in the corresponding time period using addrmf. An average response file is needed becuase a spectral fit using the pre-slew DRM will introduce some errors in both a spectral shape and a normalization if the PHA file contains a lot of the slew/post-slew time interval.
- 3) For fits to more complicated models (e.g. a power-law over a cutoff power-law), the BAT team has decided to require a chi-square improvement of more than 6 for each extra dof.
Time averaged spectrum fit using the average DRM
Power-law model
Time interval is from    0.112 sec. to    4.616 sec.

Spectral model in power-law:
------------------------------------------------------------
Parameters  : value       lower 90%   higher 90%
Photon index: -2.33658     ( -0.230079   0.212835 )
Norm@50keV  : 3.84233E-03    ( -0.000633324   0.000622819 )
------------------------------------------------------------
#Fit statistic : Chi-Squared =          80.66 using 59 PHA bins.
# Reduced chi-squared =          1.415 for     57 degrees of freedom
# Null hypothesis probability =   2.129149e-02

Photon flux (15-150 keV)    in 4.504 sec: 0.685497 ( -0.0747  0.074701 ) ph/cm2/s
Energy fluence (15-150 keV)             : 1.66578e-07 ( -2.20148e-08  2.26032e-08 ) ergs/cm2
Cutoff power-law model
Time interval is from    0.112 sec. to    4.616 sec.
Spectral model in the cutoff power-law:
------------------------------------------------------------
Parameters  : value       lower 90%   higher 90%
Photon index: -1.58815     ( -0.620638   1.11245 )
Epeak [keV] : 20.4237      (   )
Norm@50keV  : 1.12293E-02    (     )
------------------------------------------------------------
#Fit statistic : Chi-Squared =          78.34 using 59 PHA bins.
# Reduced chi-squared =          1.399 for     56 degrees of freedom
# Null hypothesis probability =   2.604261e-02

Photon flux (15-150 keV)    in 4.504 sec: 0.671824 ( -0.075772  0.075966 ) ph/cm2/s
Energy fluence (15-150 keV)             : 0 ( 0  0 ) ergs/cm2
1-s peak spectrum fit
Power-law model
Time interval is from    0.110 sec. to    1.110 sec.

Spectral model in power-law:
------------------------------------------------------------
Parameters  : value       lower 90%   higher 90%
Photon index: -1.90854     ( -0.215356   0.205122 )
Norm@50keV  : 8.96834E-03    ( -0.00131389   0.00128897 )
------------------------------------------------------------
#Fit statistic : Chi-Squared =          59.27 using 59 PHA bins.
# Reduced chi-squared =          1.040 for     57 degrees of freedom
# Null hypothesis probability =   3.928100e-01

Photon flux (15-150 keV)    in 1 sec: 1.29182 ( -0.15956  0.15962 ) ph/cm2/s
Energy fluence (15-150 keV)             : 8.24746e-08 ( -1.17338e-08  1.19358e-08 ) ergs/cm2
Cutoff power-law model
Time interval is from    0.110 sec. to    1.110 sec.
Spectral model in the cutoff power-law:
------------------------------------------------------------
Parameters  : value       lower 90%   higher 90%
Photon index: -0.788688     ( -0.918745   1.21986 )
Epeak [keV] : 44.9248      ( -5.33637 25.9735 )
Norm@50keV  : 4.01873E-02    ( -0.0401847   0.176447 )
------------------------------------------------------------
#Fit statistic : Chi-Squared =          54.73 using 59 PHA bins.
# Reduced chi-squared =         0.9773 for     56 degrees of freedom
# Null hypothesis probability =   5.231675e-01

Photon flux (15-150 keV)    in 1 sec: 1.25572 ( -0.16162  0.16196 ) ph/cm2/s
Energy fluence (15-150 keV)             : 7.49083e-08 ( -1.24256e-08  1.32006e-08 ) ergs/cm2
Time-resolved spectra
Distribution
T90 vs. Hardness ratio plot
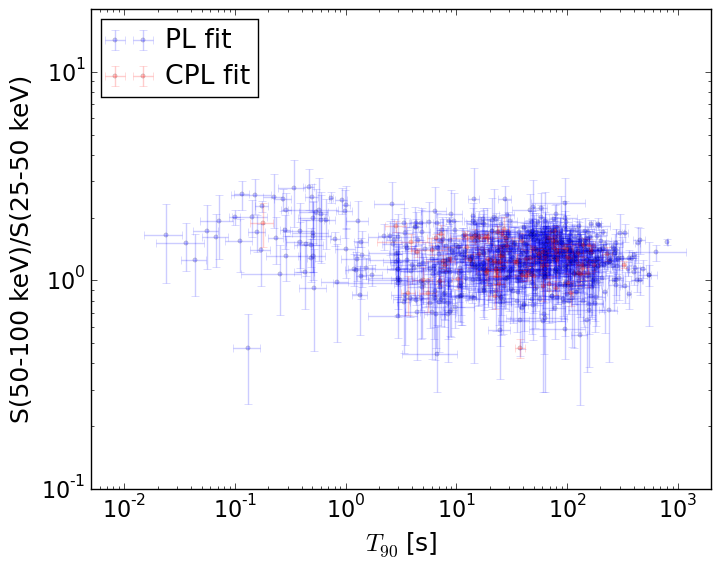
T90                                   = N/A sec.
Hardness ratio (energy fluence ratio) = N/A
S(15-50 keV) vs. S(50-150 keV) plot
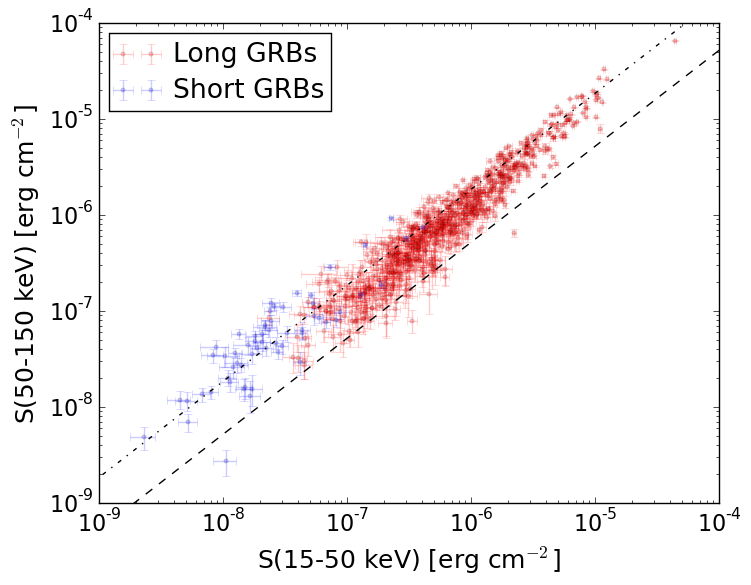
S(15-50 keV)  = N/A
S(50-150 keV) = N/A
The dash-dotted line and the dashed line traces the fluences calculated from the Band function with Epeak = 15 and 150 keV, respectively. Both lines assume a canonical values of alpha = -1 and beta = -2.5.
Mask shadow pattern
IMX = -6.424719161824306E-01, IMY = 1.334518816398269E-01
Spacecraft aspect plot
Bright source in the pre-burst/pre-slew/post-slew images
Pre-burst image of 15-350 keV band
Time interval of the image:
-299.768000 0.112000

# RAcent  DECcent POSerr Theta    Phi  PeakCts   SNR AngSep     Name
#  [deg]    [deg]    ['] [deg]  [deg]                   [']
135.5323 -40.5578    0.6  24.8  -28.5   3.8460  20.1    0.3	Vela X-1
170.4878 -60.5703    5.8  54.0  -31.6   1.8876   2.0    6.0	Cen X-3
113.8349  17.8101    2.8  37.2  160.9   1.2484   4.2 ------	UNKNOWN
Pre-slew background subtracted image of 15-350 keV band
Time interval of the image:
0.112000 4.616000

# RAcent  DECcent POSerr Theta    Phi  PeakCts   SNR AngSep     Name
#  [deg]    [deg]    ['] [deg]  [deg]                   [']
135.3426 -40.6586   23.4  24.8  -28.1   0.0100   0.5   10.5	Vela X-1
170.0950 -60.6381    7.0  53.8  -31.4   0.1357   1.7    6.6	Cen X-3
132.1152  13.6278    0.8  33.3 -168.3   0.3663  14.7 ------	UNKNOWN
Post-slew image of 15-350 keV band
Time interval of the image:
63.932590 302.292300

# RAcent  DECcent POSerr Theta    Phi  PeakCts   SNR AngSep     Name
#  [deg]    [deg]    ['] [deg]  [deg]                   [']
135.4537 -40.5634    5.4  54.3  -17.4   1.0614   2.2    3.5	Vela X-1
109.0311  18.4866    2.8  22.6   91.2   0.7959   4.1 ------	UNKNOWN
105.1642 -32.1169    3.1  52.5   14.7   2.4219   3.8 ------	UNKNOWN
133.3121   4.1023    2.6   9.6  -21.6   0.6965   4.4 ------	UNKNOWN
149.7989  26.4211    3.0  20.9 -144.5   0.5795   3.8 ------	UNKNOWN