Analysis Summary
Notes:
- 1) No attempt has been made to eliminate the non-significant decimal places.
- 2) This batgrbproduct analysis is done using the HEASARC data.
- 3) This batgrbproduct analysis is using the flight position for the mask-weighting calculation.
======================================================================
BAT GRB EVENT DATA PROCESSING REPORT
Process Script Ver: batgrbproduct v2.46
Process Start Time: Wed Jan 22 19:45:43 EST 2014
Host Name: batevent1
Current Working Dir: /local/data/batevent/batevent_reproc/trigger162580
======================================================================
Trigger: 00162580 Segment: 000
BAT Trigger Time: 152864801.36 [s; MET]
Trigger Stop: 152864801.392 [s; MET]
UTC: 2005-11-05T06:26:41.537840 [includes UTCF correction]
Where From?: (*SHORT BURST*) TDRSS scaled map message
BAT
RA: 265.289452879954 Dec: 34.9208520942204 [deg; J2000]
Catalogged Source?: NO
Point Source?: YES
GRB Indicated?: YES [ by BAT flight software ]
Image S/N Ratio: 7.09
Image Trigger?: NO
Rate S/N Ratio: 17.832554500127 [ if not an image trigger ]
Image S/N Ratio: 7.09
Analysis Position: [ source = BAT ]
RA: 265.289452879954 Dec: 34.9208520942204 [deg; J2000]
Refined Position: [ source = BAT pre-slew burst ]
RA: 265.300908276729 Dec: 34.9445907247918 [deg; J2000]
{ 17h 41m 12.2s , +34d 56' 40.5" }
+/- 2.34132672054067 [arcmin] (estimated 90% radius based on SNR)
+/- 1.02539227449372 [arcmin] (formal 1-sigma fit error)
SNR: 9.02226319428429
Angular difference between the analysis and refined position is 1.531730 arcmin
Partial Coding Fraction: 0.8046875 [ including projection effects ]
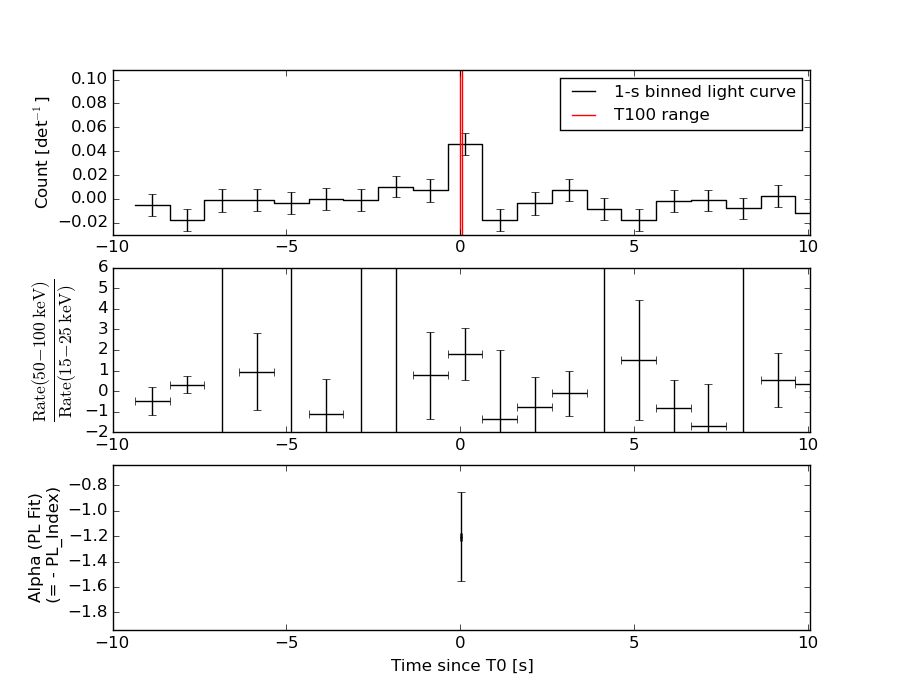
Duration
T90: 0.0559999942779541 +/- 0.0144222095322683
Measured from: 0
to: 0.0559999942779541 [s; relative to TRIGTIME]
T50: 0.0320000052452087 +/- 0.0178885400881622
Measured from: 0.00799998641014099
to: 0.0399999916553497 [s; relative to TRIGTIME]
Fluence
Peak Flux (peak 1 second)
Measured from: -0.468000024557114
to: 0.531999975442886 [s; relative to TRIGTIME]
Total Fluence
Measured from: -0.00400000810623169
to: 0.0639999806880951 [s; relative to TRIGTIME]
Band 1 Band 2 Band 3 Band 4
15-25 25-50 50-100 100-350 keV
Total 0.006474 0.010877 0.011043 0.002012
0.001771 0.001913 0.001878 0.001150 [error]
Peak 0.007470 0.012755 0.014146 0.007427
0.005060 0.005168 0.004598 0.003901 [error]
[ fluence units of on-axis counts / fully illuminated detector ]
======================================================================
====== Table of the duration information =============================
Value tstart tstop
T100 0.068 -0.004 0.064
T90 0.056 0.000 0.056
T50 0.032 0.008 0.040
Peak 1.000 -0.468 0.532
====== Spectral Analysis Summary =====================================
Model : spectral model: simple power-law (PL) and cutoff power-law (CPL)
Ph_index : photon index: E^{Ph_index}
Ph_90err : 90% error of the photon index
Epeak : Epeak in keV
Epeak_90err: 90% error of Epeak
Norm : normalization at 50 keV in both the PL model and CPL model
Nomr_90err : 90% error of the normalization
chi2 : Chi-Squared
dof : degree of freedo
=== Time-averaged spectral analysis ===
(Best model with acceptable fit: PL)
Model Ph_index Ph_90err_low Ph_90err_hi Epeak Epeak_90err_low Epeak_90err_hi Norm Nomr_90err_low Norm_90err_hi chi2 dof
PL -1.210 -0.342 0.355 - - - 2.43e-02 -5.02e-03 5.02e-03 65.190 57
CPL -0.925 N/A N/A 196.187 N/A N/A 3.37e-02 N/A N/A 65.060 56
=== 1-s peak spectral analysis ===
(Best model with acceptable fit: N/A)
Model Ph_index Ph_90err_low Ph_90err_hi Epeak Epeak_90err_low Epeak_90err_hi Norm Nomr_90err_low Norm_90err_hi chi2 dof
PL -0.928 -0.660 0.780 - - - 2.70e-03 -1.06e-03 1.00e-03 50.020 57
CPL -0.734 N/A N/A 381.751 N/A N/A 3.28e-03 N/A N/A 50.050 56
=== Fluence/Peak Flux Summary ===
Model Band1 Band2 Band3 Band4 Band5 Total
15-25 25-50 50-100 100-350 15-150 15-350 keV
Fluence PL 1.61e-09 3.53e-09 6.11e-09 2.45e-08 1.67e-08 3.57e-08 erg/cm2
90%_error_low -5.77e-10 -8.36e-10 -1.50e-09 -1.08e-08 -3.78e-09 -1.22e-08 erg/cm2
90%_error_hi 6.32e-10 8.13e-10 1.48e-09 1.56e-08 3.82e-09 1.61e-08 erg/cm2
Peak flux PL 6.44e-02 9.13e-02 9.60e-02 1.86e-01 3.10e-01 4.38e-01 ph/cm2/s
90%_error_low -4.40e-02 -9.13e-02 -3.67e-02 -1.18e-01 -1.17e-01 -1.64e-01 ph/cm2/s
90%_error_hi 6.04e-02 4.41e-02 3.57e-02 2.24e-01 1.18e-01 1.93e-01 ph/cm2/s
Fluence CPL 1.54e-09 3.66e-09 6.28e-09 1.60e-08 1.64e-08 2.74e-08 erg/cm2
90%_error_low -6.69e-10 -9.33e-10 -1.62e-09 -1.34e-08 -4.16e-09 -1.41e-08 erg/cm2
90%_error_hi 6.87e-10 1.07e-09 1.75e-09 1.18e-08 3.98e-09 1.28e-08 erg/cm2
Peak flux CPL 6.45e-02 9.13e-02 9.59e-02 1.87e-01 3.10e-01 4.39e-01 ph/cm2/s
90%_error_low -6.45e-02 -9.13e-02 -3.67e-02 -1.87e-01 -1.20e-01 -2.30e-01 ph/cm2/s
90%_error_hi 6.03e-02 4.72e-02 4.57e-02 2.20e-01 1.18e-01 1.06e-01 ph/cm2/s
======================================================================
Image
Pre-slew 15.0-350.0 keV image (Event data)
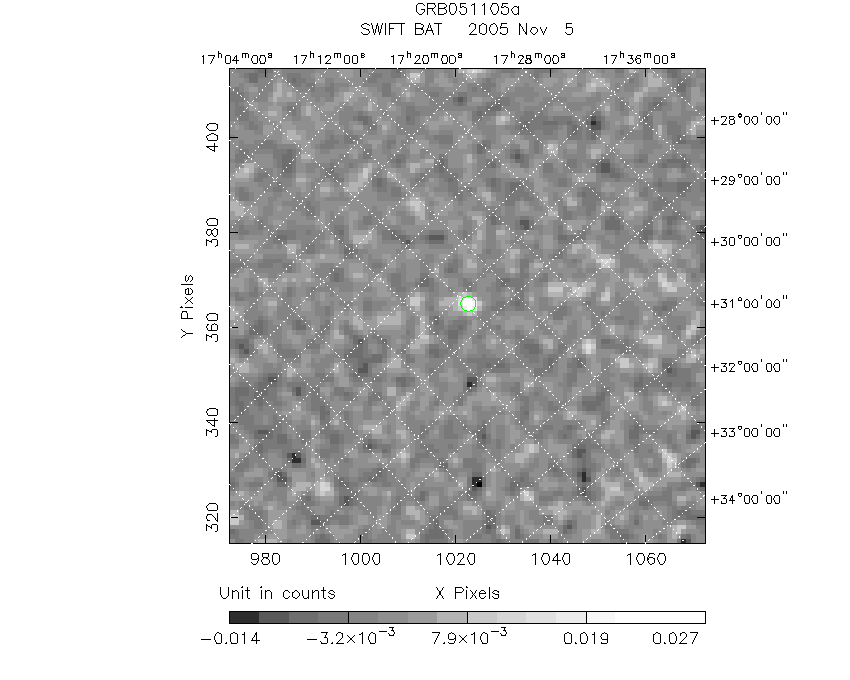
#   RAcent    DECcent   POSerr    Theta     Phi              Peak Cts       SNR   Name
  265.3009    34.9446   0.0213    20.8696   142.0257         0.0301620      9.022 TRIG_00162580

Foreground time interval of the image:
 -0.004   0.064 (delta_t =   0.068 [sec])
Background time interval of the image:
-299.360  -0.004 (delta_t = 299.356 [sec])
Light Curves
Note: The mask-weighted lightcurves have units of either count/det or counts/sec/det, where a det is 0.4 x 0.4 = 0.16 sq cm.
Full-time range; 1 s binning
Other quick-look light curves:
- 64 ms binning (zoomed)
- 16 ms binning (zoomed)
- 8 ms binning (zoomed)
- 2 ms binning (zoomed)
- SN=5 or 10 s binning (full-time range)
- Raw light curve
Spectra
- 64 ms binning (zoomed)
- 16 ms binning (zoomed)
- 8 ms binning (zoomed)
- 2 ms binning (zoomed)
- SN=5 or 10 s binning (full-time range)
- Raw light curve
Spectra
Notes:
- 1) The fitting includes the systematic errors.
- 2) When the burst includes telescope slew time periods, the fitting uses an average response file made from multiple 5-s response files through out the slew time plus single time preiod for the non-slew times, and weighted by the total counts in the corresponding time period using addrmf. An average response file is needed becuase a spectral fit using the pre-slew DRM will introduce some errors in both a spectral shape and a normalization if the PHA file contains a lot of the slew/post-slew time interval.
- 3) For fits to more complicated models (e.g. a power-law over a cutoff power-law), the BAT team has decided to require a chi-square improvement of more than 6 for each extra dof.
Time averaged spectrum fit using the average DRM
Power-law model
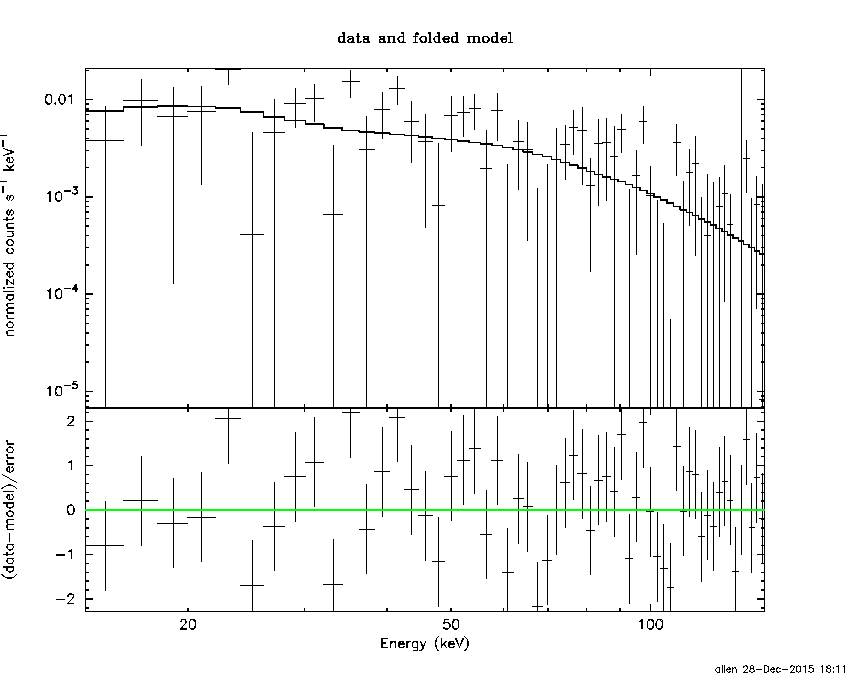
Time interval is from   -0.004 sec. to    0.064 sec.

Spectral model in power-law:
------------------------------------------------------------
Parameters  : value       lower 90%   higher 90%
Photon index: -1.20996     ( -0.341635   0.354765 )
Norm@50keV  : 2.43073E-02    ( -0.00502439   0.00502436 )
------------------------------------------------------------
#Fit statistic : Chi-Squared =          65.19 using 59 PHA bins.
# Reduced chi-squared =          1.144 for     57 degrees of freedom
# Null hypothesis probability =   2.132764e-01

Photon flux (15-150 keV)    in 0.068 sec: 2.85726 ( -0.6059  0.60728 ) ph/cm2/s
Energy fluence (15-150 keV)             : 1.67243e-08 ( -3.7833e-09  3.8208e-09 ) ergs/cm2
Cutoff power-law model
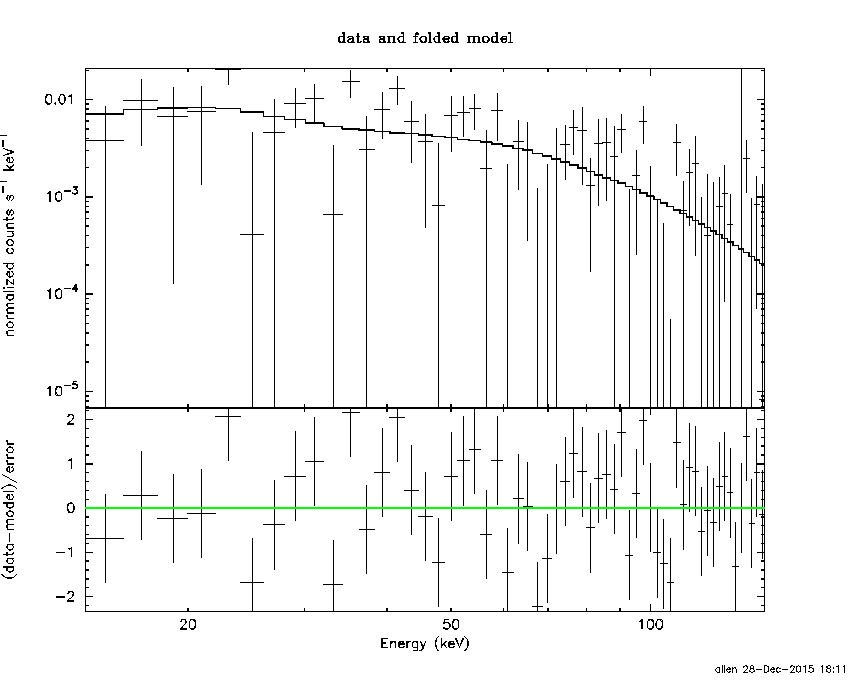
Time interval is from   -0.004 sec. to    0.064 sec.
Spectral model in the cutoff power-law:
------------------------------------------------------------
Parameters  : value       lower 90%   higher 90%
Photon index: -0.925099     (       )
Epeak [keV] : 196.187      (   )
Norm@50keV  : 3.37255E-02    (     )
------------------------------------------------------------
#Fit statistic : Chi-Squared =          65.06 using 59 PHA bins.
# Reduced chi-squared =          1.162 for     56 degrees of freedom
# Null hypothesis probability =   1.905073e-01

Photon flux (15-150 keV)    in 0.068 sec: 2.83812 ( -0.61398  0.61361 ) ph/cm2/s
Energy fluence (15-150 keV)             : 1.6444e-08 ( -4.15638e-09  3.98411e-09 ) ergs/cm2
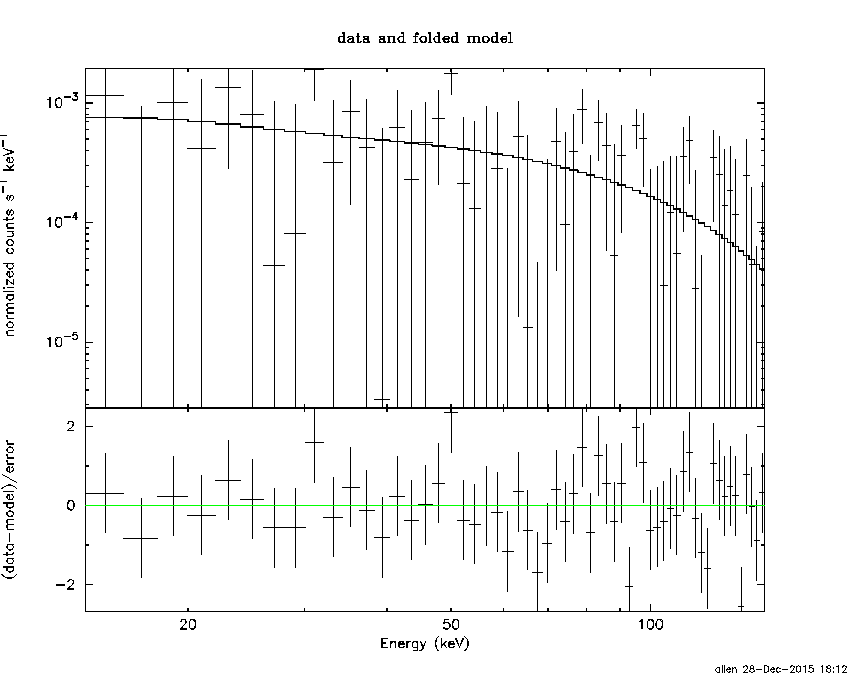
1-s peak spectrum fit
Power-law model

Time interval is from   -0.468 sec. to    0.532 sec.

Spectral model in power-law:
------------------------------------------------------------
Parameters  : value       lower 90%   higher 90%
Photon index: -0.928029     ( -0.659869   0.780344 )
Norm@50keV  : 2.70021E-03    ( -0.00106364   0.00100107 )
------------------------------------------------------------
#Fit statistic : Chi-Squared =          50.02 using 59 PHA bins.
# Reduced chi-squared =         0.8776 for     57 degrees of freedom
# Null hypothesis probability =   7.320126e-01

Photon flux (15-150 keV)    in 1 sec: 0.310049 ( -0.116531  0.118396 ) ph/cm2/s
Energy fluence (15-150 keV)             : 2.99826e-08 ( -1.13265e-08  1.14985e-08 ) ergs/cm2
Cutoff power-law model
Time interval is from   -0.468 sec. to    0.532 sec.
Spectral model in the cutoff power-law:
------------------------------------------------------------
Parameters  : value       lower 90%   higher 90%
Photon index: -2.35261     (       )
Epeak [keV] : 111.454      (   )
Norm@50keV  : 2.10354E-04    (     )
------------------------------------------------------------
#Fit statistic : Chi-Squared =          49.61 using 59 PHA bins.
# Reduced chi-squared =         0.8859 for     56 degrees of freedom
# Null hypothesis probability =   7.139123e-01

Photon flux (15-150 keV)    in 1 sec: 0.310120 ( -0.120041  0.11788 ) ph/cm2/s
Energy fluence (15-150 keV)             : 2.99889e-08 ( -1.18838e-08  1.07051e-08 ) ergs/cm2
Time-resolved spectra
Distribution
T90 vs. Hardness ratio plot
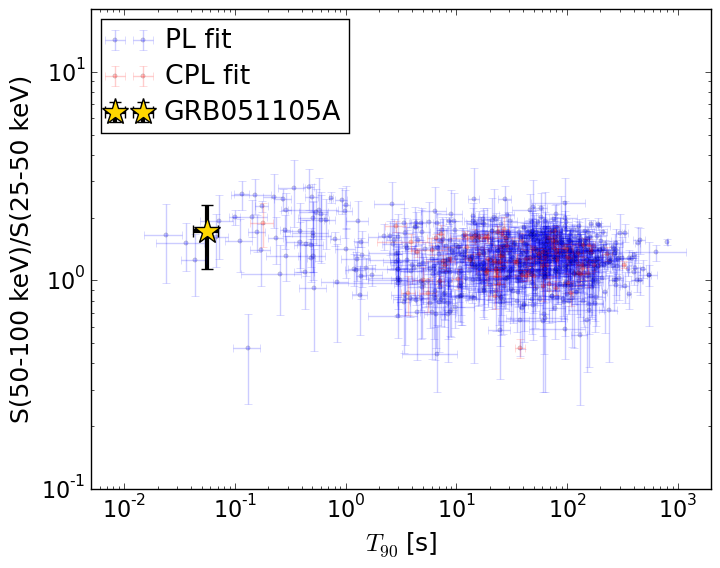
T90                                   = 0.05599999 sec.
Hardness ratio (energy fluence ratio) = 1.72913898607
S(15-50 keV) vs. S(50-150 keV) plot
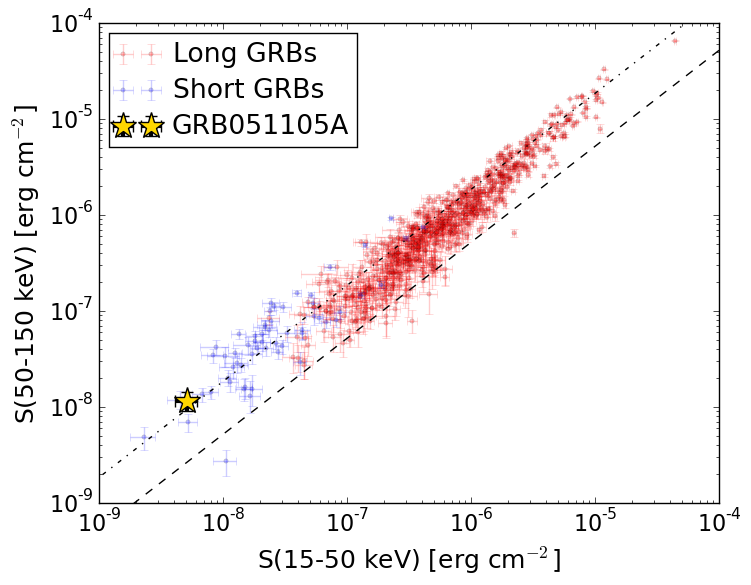
S(15-50 keV)  = 5.143031e-09
S(50-150 keV) = 1.1581387e-08
The dash-dotted line and the dashed line traces the fluences calculated from the Band function with Epeak = 15 and 150 keV, respectively. Both lines assume a canonical values of alpha = -1 and beta = -2.5.
Mask shadow pattern
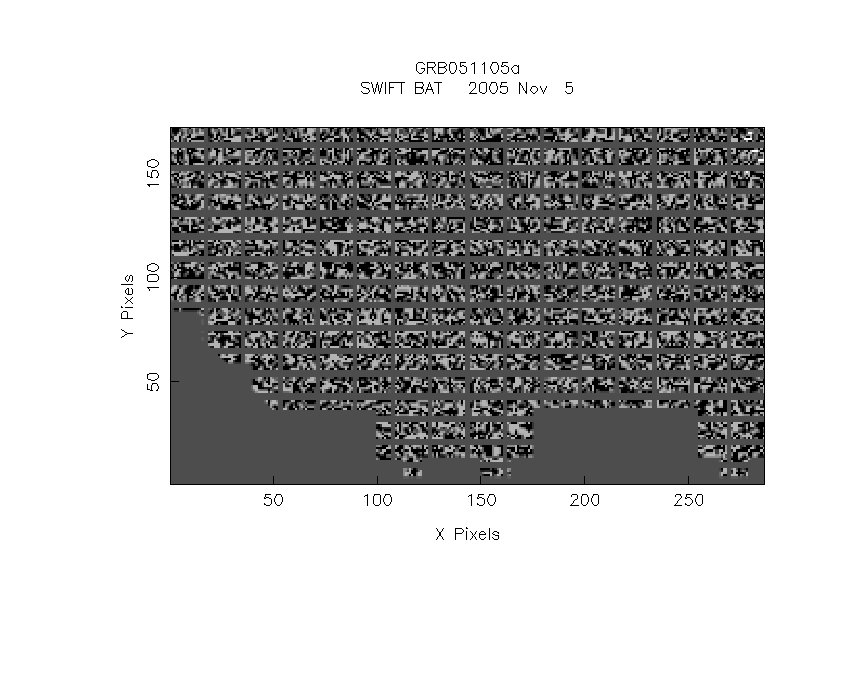
IMX = -3.005377951979895E-01, IMY = -2.345888052357080E-01
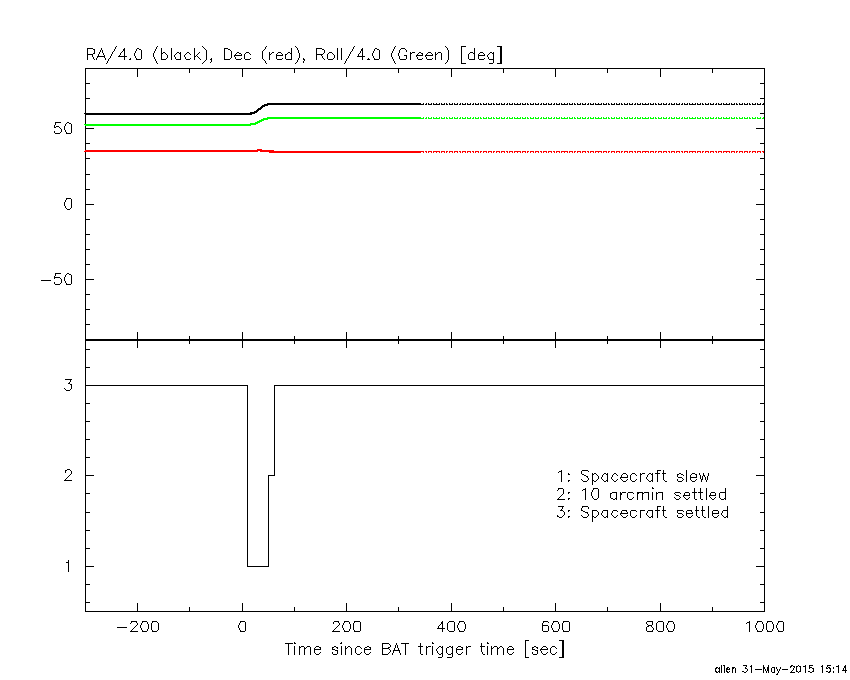
Spacecraft aspect plot
Bright source in the pre-burst/pre-slew/post-slew images
Pre-burst image of 15-350 keV band
Time interval of the image:
-299.360000 -0.004000

# RAcent  DECcent POSerr Theta    Phi  PeakCts   SNR AngSep     Name
#  [deg]    [deg]    ['] [deg]  [deg]                   [']
254.3828  35.3252    3.5  11.9  143.6   0.5479   3.2    3.8	Her X-1
268.3661  -1.4529   65.7  45.3 -163.2   0.0589   0.2    0.1	SW J1753.5-0127
273.8279 -14.0504    8.1  58.8 -160.3  -2.2660  -1.5   10.4	GX 17+2
288.7060  10.9026    6.7  50.5  165.4   1.0353   1.7    6.0	GRS 1915+105
291.4924  48.4926    2.3  40.0  113.2   2.9833   5.0 ------	UNKNOWN
275.4886   7.1684    3.3  43.0 -179.0   0.9642   3.5 ------	UNKNOWN
170.0080  41.1489    2.3  53.8   -2.0   2.8132   4.9 ------	UNKNOWN
169.6743  30.8525    2.8  57.7  -13.5   3.9534   4.2 ------	UNKNOWN
278.3402 -11.2219    2.9  58.9 -166.4   4.9512   3.9 ------	UNKNOWN
Pre-slew background subtracted image of 15-350 keV band
Time interval of the image:
-0.004000 0.064000

# RAcent  DECcent POSerr Theta    Phi  PeakCts   SNR AngSep     Name
#  [deg]    [deg]    ['] [deg]  [deg]                   [']
254.2270  35.3190  220.0  11.8  143.7  -0.0002  -0.1   11.4	Her X-1
268.2954  -1.4989   80.1  45.3 -163.1  -0.0008  -0.1    5.2	SW J1753.5-0127
274.0869 -13.9735    3.9  58.8 -160.6  -0.0472  -2.9    6.0	GX 17+2
288.8114  11.0283    6.8  50.5  165.2   0.0163   1.7    5.0	GRS 1915+105
294.7839  35.9737    2.6  44.2  131.2   0.0633   4.5 ------	UNKNOWN
265.3008  34.9446    1.3  20.9  142.0   0.0302   9.0 ------	UNKNOWN
Post-slew image of 15-350 keV band
Time interval of the image:
51.340600 302.670500

# RAcent  DECcent POSerr Theta    Phi  PeakCts   SNR AngSep     Name
#  [deg]    [deg]    ['] [deg]  [deg]                   [']
254.5274  35.3195    4.7   8.8  -42.1   0.4473   2.5    3.7	Her X-1
268.2828  -1.4155    3.4  36.4 -142.9   0.8368   3.3    5.6	SW J1753.5-0127
274.2169 -14.0513    3.7  49.7 -149.3   1.4434   3.1   12.3	GX 17+2
288.8293  11.0624    4.2  32.1  174.5   0.6698   2.8    7.2	GRS 1915+105
299.6019  35.2112    0.3  28.0  121.5  10.6112  38.8    0.8	Cyg X-1
308.1328  40.9915    4.0  34.0  108.9   1.1806   2.9    2.5	Cyg X-3
283.6475   2.8256    2.1  36.4 -169.9   1.2408   5.6 ------	UNKNOWN
272.3040  14.5154    2.6  21.4 -156.8   0.8507   4.4 ------	UNKNOWN
290.7837 -18.8494    3.1  59.0 -166.2   4.2859   3.7 ------	UNKNOWN
238.2056  21.7420    3.3  27.1  -69.7   0.7372   3.5 ------	UNKNOWN
271.7598 -19.9469    4.8  55.2 -145.3   3.4386   2.5 ------	UNKNOWN
257.2296 -11.6180    2.8  47.2 -127.1   3.1377   4.1 ------	UNKNOWN
232.7469   6.7798    3.0  41.0  -83.5   3.2356   3.9 ------	UNKNOWN