Analysis Summary
Notes:
- 1) No attempt has been made to eliminate the non-significant decimal places.
- 2) This batgrbproduct analysis is done using the HEASARC data.
- 3) This batgrbproduct analysis is using the flight position for the mask-weighting calculation.
======================================================================
BAT GRB EVENT DATA PROCESSING REPORT
Process Script Ver: batgrbproduct v2.46
Process Start Time: Wed Jan 22 19:37:57 EST 2014
Host Name: batevent1
Current Working Dir: /local/data/batevent/batevent_reproc/trigger163438
======================================================================
Trigger: 00163438 Segment: 000
BAT Trigger Time: 153381581.312 [s; MET]
Trigger Stop: 153381582.336 [s; MET]
UTC: 2005-11-11T05:59:41.478720 [includes UTCF correction]
Where From?: TDRSS position message
BAT
RA: 348.157448391974 Dec: 18.3675138886497 [deg; J2000]
Catalogged Source?: NO
Point Source?: YES
GRB Indicated?: YES [ by BAT flight software ]
Image S/N Ratio: 15.07
Image Trigger?: NO
Rate S/N Ratio: 37.0944739819828 [ if not an image trigger ]
Image S/N Ratio: 15.07
Analysis Position: [ source = BAT ]
RA: 348.157448391974 Dec: 18.3675138886497 [deg; J2000]
Refined Position: [ source = BAT pre-slew burst ]
RA: 348.135188418099 Dec: 18.3601705300343 [deg; J2000]
{ 23h 12m 32.4s , +18d 21' 36.6" }
+/- 0.934611877090684 [arcmin] (estimated 90% radius based on SNR)
+/- 0.258591239681815 [arcmin] (formal 1-sigma fit error)
SNR: 33.5022266007321
Angular difference between the analysis and refined position is 1.341975 arcmin
Partial Coding Fraction: 0.59375 [ including projection effects ]
Duration
T90: 64 +/- 16
Measured from: -11.3120000064373
to: 52.6879999935627 [s; relative to TRIGTIME]
T50: 16 +/- 16
Measured from: -11.3120000064373
to: 4.6879999935627 [s; relative to TRIGTIME]
Fluence
Peak Flux (peak 1 second)
Measured from: -3.8120000064373
to: -2.8120000064373 [s; relative to TRIGTIME]
Total Fluence
Measured from: -11.3120000064373
to: 84.6879999935627 [s; relative to TRIGTIME]
Band 1 Band 2 Band 3 Band 4
15-25 25-50 50-100 100-350 keV
Total 1.415622 2.310799 1.962746 0.515195
0.064443 0.067214 0.059472 0.050122 [error]
Peak 0.044580 0.083275 0.079457 0.021524
0.007114 0.007994 0.007454 0.005948 [error]
[ fluence units of on-axis counts / fully illuminated detector ]
======================================================================
====== Table of the duration information =============================
Value tstart tstop
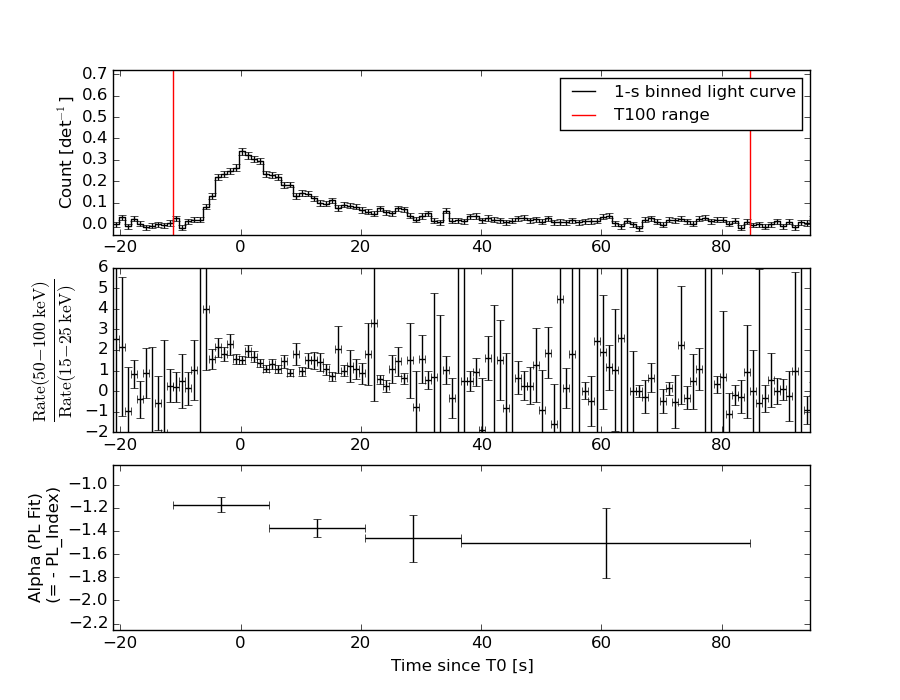
T100 96.000 -11.312 84.688
T90 64.000 -11.312 52.688
T50 16.000 -11.312 4.688
Peak 1.000 -3.812 -2.812
====== Spectral Analysis Summary =====================================
Model : spectral model: simple power-law (PL) and cutoff power-law (CPL)
Ph_index : photon index: E^{Ph_index}
Ph_90err : 90% error of the photon index
Epeak : Epeak in keV
Epeak_90err: 90% error of Epeak
Norm : normalization at 50 keV in both the PL model and CPL model
Nomr_90err : 90% error of the normalization
chi2 : Chi-Squared
dof : degree of freedo
=== Time-averaged spectral analysis ===
(Best model with acceptable fit: PL)
Model Ph_index Ph_90err_low Ph_90err_hi Epeak Epeak_90err_low Epeak_90err_hi Norm Nomr_90err_low Norm_90err_hi chi2 dof
PL -1.322 -0.062 0.062 - - - 4.52e-03 -1.51e-04 1.51e-04 63.170 57
CPL -1.137 -0.209 0.249 258.320 -116.332 -258.320 5.49e-03 -1.04e-03 1.59e-03 61.390 56
=== 1-s peak spectral analysis ===
(Best model with acceptable fit: N/A)
Model Ph_index Ph_90err_low Ph_90err_hi Epeak Epeak_90err_low Epeak_90err_hi Norm Nomr_90err_low Norm_90err_hi chi2 dof
PL -1.142 -0.179 0.182 - - - 1.57e-02 -1.59e-03 1.59e-03 74.790 57
CPL -1.138 -0.180 0.184 9998.870 -9998.870 -9998.870 1.58e-02 -5.21e-03 1.29e-02 74.800 56
=== Fluence/Peak Flux Summary ===
Model Band1 Band2 Band3 Band4 Band5 Total
15-25 25-50 50-100 100-350 15-150 15-350 keV
Fluence PL 4.69e-07 9.61e-07 1.54e-06 5.49e-06 4.27e-06 8.46e-06 erg/cm2
90%_error_low -3.16e-08 -3.81e-08 -6.10e-08 -4.88e-07 -1.52e-07 -5.21e-07 erg/cm2
90%_error_hi 3.24e-08 3.80e-08 6.08e-08 5.21e-07 1.52e-07 5.48e-07 erg/cm2
Peak flux PL 4.60e-01 5.73e-01 5.19e-01 8.18e-01 1.83e+00 2.37e+00 ph/cm2/s
90%_error_low -9.00e-02 -7.04e-02 -6.07e-02 -1.89e-01 -1.91e-01 -2.56e-01 ph/cm2/s
90%_error_hi 9.58e-02 6.91e-02 5.99e-02 2.23e-01 1.91e-01 2.62e-01 ph/cm2/s
Fluence CPL 4.49e-07 9.73e-07 1.56e-06 4.26e-06 4.22e-06 7.24e-06 erg/cm2
90%_error_low -4.00e-08 -4.10e-08 -6.89e-08 -1.14e-06 -1.66e-07 -1.14e-06 erg/cm2
90%_error_hi 4.08e-08 4.14e-08 6.96e-08 1.38e-06 1.65e-07 7.09e-07 erg/cm2
Peak flux CPL 4.59e-01 5.70e-01 5.19e-01 8.14e-01 1.84e+00 2.43e+00 ph/cm2/s
90%_error_low N/A N/A N/A N/A N/A -5.53e-01 ph/cm2/s
90%_error_hi N/A N/A N/A N/A N/A 2.45e-01 ph/cm2/s
======================================================================
Image
Pre-slew 15.0-350.0 keV image (Event data)
#   RAcent    DECcent   POSerr    Theta     Phi              Peak Cts       SNR   Name
  348.1352    18.3602   0.0057    27.1618   136.1118         6.1435707     33.502 TRIG_00163438

Foreground time interval of the image:
-11.312  84.688 (delta_t =  96.000 [sec])
Background time interval of the image:
-127.411 -11.312 (delta_t = 116.099 [sec])
Light Curves
Note: The mask-weighted lightcurves have units of either count/det or counts/sec/det, where a det is 0.4 x 0.4 = 0.16 sq cm.
Full-time range; 1 s binning
Other quick-look light curves:
- 64 ms binning (zoomed)
- 16 ms binning (zoomed)
- 8 ms binning (zoomed)
- 2 ms binning (zoomed)
- SN=5 or 10 s binning (full-time range)
- Raw light curve
Spectra
- 64 ms binning (zoomed)
- 16 ms binning (zoomed)
- 8 ms binning (zoomed)
- 2 ms binning (zoomed)
- SN=5 or 10 s binning (full-time range)
- Raw light curve
Spectra
Notes:
- 1) The fitting includes the systematic errors.
- 2) When the burst includes telescope slew time periods, the fitting uses an average response file made from multiple 5-s response files through out the slew time plus single time preiod for the non-slew times, and weighted by the total counts in the corresponding time period using addrmf. An average response file is needed becuase a spectral fit using the pre-slew DRM will introduce some errors in both a spectral shape and a normalization if the PHA file contains a lot of the slew/post-slew time interval.
- 3) For fits to more complicated models (e.g. a power-law over a cutoff power-law), the BAT team has decided to require a chi-square improvement of more than 6 for each extra dof.
Time averaged spectrum fit using the average DRM
Power-law model
Time interval is from  -11.312 sec. to   84.688 sec.

Spectral model in power-law:
------------------------------------------------------------
Parameters  : value       lower 90%   higher 90%
Photon index: -1.32175     ( -0.0618706   0.0621193 )
Norm@50keV  : 4.52067E-03    ( -0.000150573   0.000150551 )
------------------------------------------------------------
#Fit statistic : Chi-Squared =          63.17 using 59 PHA bins.
# Reduced chi-squared =          1.108 for     57 degrees of freedom
# Null hypothesis probability =   2.674292e-01

Photon flux (15-150 keV)    in 96 sec: 0.541554 ( -0.019447  0.019495 ) ph/cm2/s
Energy fluence (15-150 keV)             : 4.26679e-06 ( -1.52153e-07  1.52388e-07 ) ergs/cm2
Cutoff power-law model
Time interval is from  -11.312 sec. to   84.688 sec.
Spectral model in the cutoff power-law:
------------------------------------------------------------
Parameters  : value       lower 90%   higher 90%
Photon index: -1.13651     ( -0.208858   0.2486 )
Epeak [keV] : 258.320      ( -116.332 -258.32 )
Norm@50keV  : 5.49299E-03    ( -0.00103936   0.001587 )
------------------------------------------------------------
#Fit statistic : Chi-Squared =          61.39 using 59 PHA bins.
# Reduced chi-squared =          1.096 for     56 degrees of freedom
# Null hypothesis probability =   2.891054e-01

Photon flux (15-150 keV)    in 96 sec: 0.535244 ( -0.020938  0.020982 ) ph/cm2/s
Energy fluence (15-150 keV)             : 4.21591e-06 ( -1.66129e-07  1.65375e-07 ) ergs/cm2
1-s peak spectrum fit
Power-law model
Time interval is from   -3.812 sec. to   -2.812 sec.

Spectral model in power-law:
------------------------------------------------------------
Parameters  : value       lower 90%   higher 90%
Photon index: -1.14198     ( -0.179392   0.182163 )
Norm@50keV  : 1.57301E-02    ( -0.00159313   0.00159237 )
------------------------------------------------------------
#Fit statistic : Chi-Squared =          74.79 using 59 PHA bins.
# Reduced chi-squared =          1.312 for     57 degrees of freedom
# Null hypothesis probability =   5.702406e-02

Photon flux (15-150 keV)    in 1 sec: 1.83273 ( -0.19084  0.19123 ) ph/cm2/s
Energy fluence (15-150 keV)             : 1.62342e-07 ( -1.82765e-08  1.83837e-08 ) ergs/cm2
Cutoff power-law model

Time interval is from   -3.812 sec. to   -2.812 sec.
Spectral model in the cutoff power-law:
------------------------------------------------------------
Parameters  : value       lower 90%   higher 90%
Photon index: -1.1376     ( -0.179919   0.184036 )
Epeak [keV] : 9998.87      ( -9999.06 -9999.06 )
Norm@50keV  : 1.58117E-02    ( -0.00521463   0.0129246 )
------------------------------------------------------------
#Fit statistic : Chi-Squared =          74.80 using 59 PHA bins.
# Reduced chi-squared =          1.336 for     56 degrees of freedom
# Null hypothesis probability =   4.738621e-02

Photon flux (15-150 keV)    in 1 sec: 1.83698 (    ) ph/cm2/s
Energy fluence (15-150 keV)             : 1.62888e-07 ( -2.11618e-08  2.01705e-08 ) ergs/cm2
Time-resolved spectra
Distribution
T90 vs. Hardness ratio plot
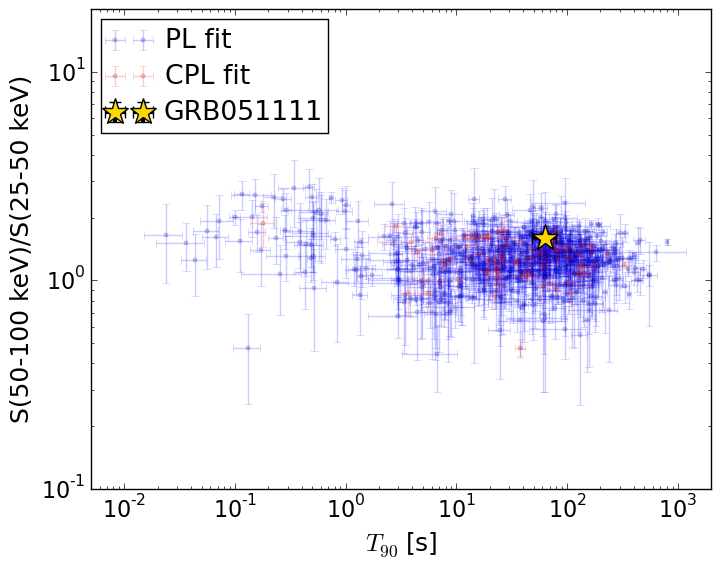
T90                                   = 64.0 sec.
Hardness ratio (energy fluence ratio) = 1.60022245279
S(15-50 keV) vs. S(50-150 keV) plot
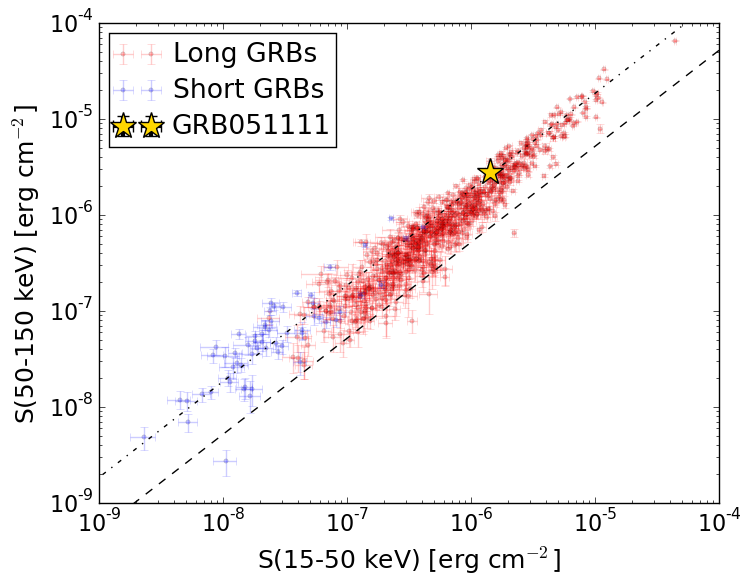
S(15-50 keV)  = 1.4302917e-06
S(50-150 keV) = 2.836435e-06
The dash-dotted line and the dashed line traces the fluences calculated from the Band function with Epeak = 15 and 150 keV, respectively. Both lines assume a canonical values of alpha = -1 and beta = -2.5.
Mask shadow pattern
IMX = -3.697797283952148E-01, IMY = -3.556999581218952E-01
Spacecraft aspect plot
Bright source in the pre-burst/pre-slew/post-slew images
Pre-burst image of 15-350 keV band
Time interval of the image:
-127.411410 -11.312000

# RAcent  DECcent POSerr Theta    Phi  PeakCts   SNR AngSep     Name
#  [deg]    [deg]    ['] [deg]  [deg]                   [']
299.5802  35.2051    0.3  24.7  -97.6   5.4537  37.8    0.5	Cyg X-1
308.1000  40.9891    1.3  16.8  -86.6   1.0714   8.7    2.2	Cyg X-3
325.9850  38.4443   19.8   4.1 -128.5   0.0681   0.6   11.5	Cyg X-2
  6.4125  16.2797    3.0  39.6  113.1   1.4862   3.8 ------	UNKNOWN
327.9672  -3.6329    2.3  44.5  178.9   0.9996   4.9 ------	UNKNOWN
Pre-slew background subtracted image of 15-350 keV band
Time interval of the image:
-11.312000 84.688000

# RAcent  DECcent POSerr Theta    Phi  PeakCts   SNR AngSep     Name
#  [deg]    [deg]    ['] [deg]  [deg]                   [']
299.7276  35.3342    9.1  24.6  -97.4   0.2239   1.3   10.4	Cyg X-1
308.2728  41.1210    0.0  16.6  -86.2  -0.2036  -1.4   12.5	Cyg X-3
326.1578  38.3277   27.4   4.1 -130.9   0.0534   0.4    0.7	Cyg X-2
348.1352  18.3602    0.3  27.2  136.1   6.1437  33.5 ------	UNKNOWN
285.1380  46.2776    2.3  32.8  -69.5   1.0295   5.1 ------	UNKNOWN
232.2807  67.8587    2.7  55.6  -31.3   2.7198   4.2 ------	UNKNOWN
Post-slew image of 15-350 keV band
Time interval of the image: