Analysis Summary
Notes:
- 1) No attempt has been made to eliminate the non-significant decimal places.
- 2) This batgrbproduct analysis is done using the HEASARC data.
- 3) This batgrbproduct analysis is using the flight position for the mask-weighting calculation.
======================================================================
BAT GRB EVENT DATA PROCESSING REPORT
Process Script Ver: batgrbproduct v2.46
Process Start Time: Wed Jan 22 19:36:18 EST 2014
Host Name: batevent1
Current Working Dir: /local/data/batevent/batevent_reproc/trigger163765
======================================================================
Trigger: 00163765 Segment: 000
BAT Trigger Time: 153588154.56 [s; MET]
Trigger Stop: 153588155.584 [s; MET]
UTC: 2005-11-13T15:22:34.722320 [includes UTCF correction]
Where From?: TDRSS position message
BAT
RA: 187.222134587575 Dec: -26.3906051826446 [deg; J2000]
Catalogged Source?: NO
Point Source?: YES
GRB Indicated?: YES [ by BAT flight software ]
Image S/N Ratio: 7.43
Image Trigger?: NO
Rate S/N Ratio: 13.7113092008021 [ if not an image trigger ]
Image S/N Ratio: 7.43
Analysis Position: [ source = BAT ]
RA: 187.222134587575 Dec: -26.3906051826446 [deg; J2000]
Refined Position: [ source = BAT pre-slew burst ]
RA: 187.245437407306 Dec: -26.3915275935324 [deg; J2000]
{ 12h 28m 58.9s , -26d 23' 29.5" }
+/- 1.44481950436595 [arcmin] (estimated 90% radius based on SNR)
+/- 0.495592608062051 [arcmin] (formal 1-sigma fit error)
SNR: 17.9809752465565
Angular difference between the analysis and refined position is 1.253676 arcmin
Partial Coding Fraction: 0.2460938 [ including projection effects ]
Duration
T90: 93.2960000038147 +/- 13.6124227002841
Measured from: -28.1920000016689
to: 65.1040000021458 [s; relative to TRIGTIME]
T50: 38.1840000152588 +/- 24.4029054809592
Measured from: -20.3280000090599
to: 17.8560000061989 [s; relative to TRIGTIME]
Fluence
Peak Flux (peak 1 second)
Measured from: 0.27199998497963
to: 1.27199998497963 [s; relative to TRIGTIME]
Total Fluence
Measured from: -30.7479999959469
to: 67.3319999873638 [s; relative to TRIGTIME]
Band 1 Band 2 Band 3 Band 4
15-25 25-50 50-100 100-350 keV
Total 1.188147 1.467127 1.159436 0.213687
0.098773 0.103251 0.090182 0.076810 [error]
Peak 0.062155 0.095800 0.075635 0.022588
0.010849 0.012245 0.011389 0.008642 [error]
[ fluence units of on-axis counts / fully illuminated detector ]
======================================================================
====== Table of the duration information =============================
Value tstart tstop
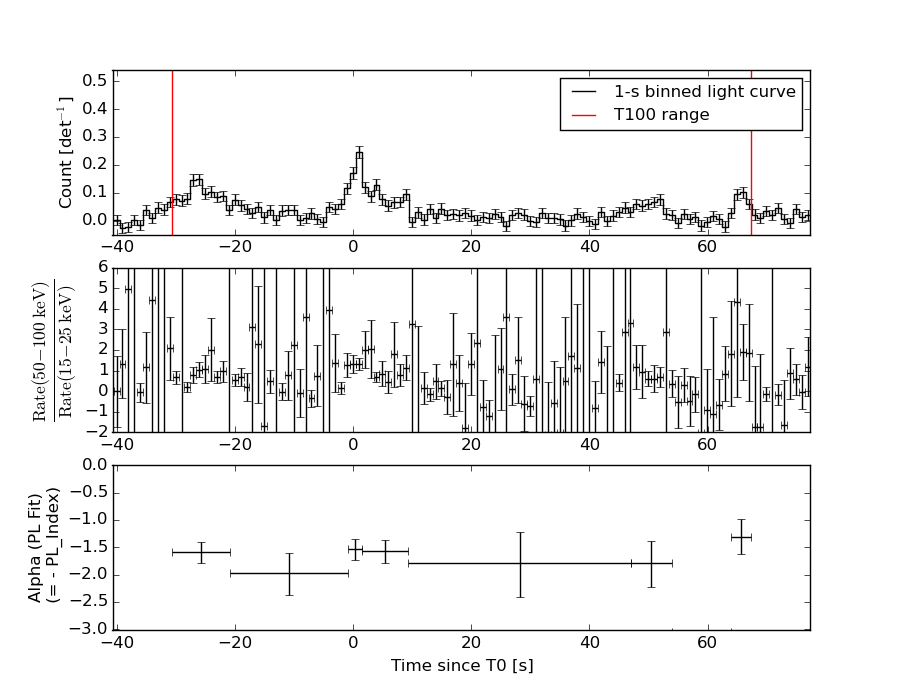
T100 98.080 -30.748 67.332
T90 93.296 -28.192 65.104
T50 38.184 -20.328 17.856
Peak 1.000 0.272 1.272
====== Spectral Analysis Summary =====================================
Model : spectral model: simple power-law (PL) and cutoff power-law (CPL)
Ph_index : photon index: E^{Ph_index}
Ph_90err : 90% error of the photon index
Epeak : Epeak in keV
Epeak_90err: 90% error of Epeak
Norm : normalization at 50 keV in both the PL model and CPL model
Nomr_90err : 90% error of the normalization
chi2 : Chi-Squared
dof : degree of freedo
=== Time-averaged spectral analysis ===
(Best model with acceptable fit: PL)
Model Ph_index Ph_90err_low Ph_90err_hi Epeak Epeak_90err_low Epeak_90err_hi Norm Nomr_90err_low Norm_90err_hi chi2 dof
PL -1.686 -0.136 0.134 - - - 2.84e-03 -2.26e-04 2.24e-04 61.520 57
CPL -1.489 -0.258 0.531 130.049 -62.907 -130.049 3.58e-03 -1.06e-03 2.93e-03 61.050 56
=== 1-s peak spectral analysis ===
(Best model with acceptable fit: PL)
Model Ph_index Ph_90err_low Ph_90err_hi Epeak Epeak_90err_low Epeak_90err_hi Norm Nomr_90err_low Norm_90err_hi chi2 dof
PL -1.491 -0.243 0.239 - - - 1.77e-02 -2.51e-03 2.49e-03 46.090 57
CPL -1.494 -0.239 0.277 9999.260 -9999.260 -9999.260 1.77e-02 -1.40e-02 2.41e-02 46.090 56
=== Fluence/Peak Flux Summary ===
Model Band1 Band2 Band3 Band4 Band5 Total
15-25 25-50 50-100 100-350 15-150 15-350 keV
Fluence PL 4.24e-07 6.96e-07 8.65e-07 2.13e-06 2.58e-06 4.11e-06 erg/cm2
90%_error_low -5.27e-08 -5.41e-08 -9.09e-08 -4.38e-07 -2.15e-07 -5.20e-07 erg/cm2
90%_error_hi 5.46e-08 5.40e-08 9.04e-08 5.07e-07 2.16e-07 5.72e-07 erg/cm2
Peak flux PL 7.20e-01 7.29e-01 5.19e-01 5.88e-01 2.20e+00 2.56e+00 ph/cm2/s
90%_error_low -1.70e-01 -1.11e-01 -9.16e-02 -1.88e-01 -3.14e-01 -3.59e-01 ph/cm2/s
90%_error_hi 1.81e-01 1.09e-01 8.97e-02 2.33e-01 3.15e-01 3.60e-01 ph/cm2/s
Fluence CPL 4.10e-07 7.10e-07 8.77e-07 1.58e-06 2.55e-06 3.58e-06 erg/cm2
90%_error_low -6.29e-08 -6.34e-08 -9.58e-08 -7.86e-07 -2.30e-07 -8.19e-07 erg/cm2
90%_error_hi 5.94e-08 6.55e-08 9.80e-08 6.76e-07 2.30e-07 7.45e-07 erg/cm2
Peak flux CPL 7.36e-01 7.19e-01 5.12e-01 6.59e-01 2.21e+00 2.64e+00 ph/cm2/s
90%_error_low -2.28e-01 -1.22e-01 -1.15e-01 -4.10e-01 -3.92e-01 -5.82e-01 ph/cm2/s
90%_error_hi 2.16e-01 1.55e-01 1.37e-01 4.67e-02 3.73e-01 3.49e-01 ph/cm2/s
======================================================================
Image
Pre-slew 15.0-350.0 keV image (Event data)
#   RAcent    DECcent   POSerr    Theta     Phi              Peak Cts       SNR   Name
  187.2454   -26.3915   0.0107    42.2245   -48.7396         4.3982655     17.981 TRIG_00163765

Foreground time interval of the image:
-30.748  67.332 (delta_t =  98.080 [sec])
Background time interval of the image:
-299.560 -30.748 (delta_t = 268.812 [sec])
Light Curves
Note: The mask-weighted lightcurves have units of either count/det or counts/sec/det, where a det is 0.4 x 0.4 = 0.16 sq cm.
Full-time range; 1 s binning
Other quick-look light curves:
- 64 ms binning (zoomed)
- 16 ms binning (zoomed)
- 8 ms binning (zoomed)
- 2 ms binning (zoomed)
- SN=5 or 10 s binning (full-time range)
- Raw light curve
Spectra
- 64 ms binning (zoomed)
- 16 ms binning (zoomed)
- 8 ms binning (zoomed)
- 2 ms binning (zoomed)
- SN=5 or 10 s binning (full-time range)
- Raw light curve
Spectra
Notes:
- 1) The fitting includes the systematic errors.
- 2) When the burst includes telescope slew time periods, the fitting uses an average response file made from multiple 5-s response files through out the slew time plus single time preiod for the non-slew times, and weighted by the total counts in the corresponding time period using addrmf. An average response file is needed becuase a spectral fit using the pre-slew DRM will introduce some errors in both a spectral shape and a normalization if the PHA file contains a lot of the slew/post-slew time interval.
- 3) For fits to more complicated models (e.g. a power-law over a cutoff power-law), the BAT team has decided to require a chi-square improvement of more than 6 for each extra dof.
Time averaged spectrum fit using the average DRM
Power-law model
Time interval is from  -30.748 sec. to   67.332 sec.

Spectral model in power-law:
------------------------------------------------------------
Parameters  : value       lower 90%   higher 90%
Photon index: -1.68636     ( -0.13626   0.13404 )
Norm@50keV  : 2.84210E-03    ( -0.000225721   0.000224089 )
------------------------------------------------------------
#Fit statistic : Chi-Squared =          61.52 using 59 PHA bins.
# Reduced chi-squared =          1.079 for     57 degrees of freedom
# Null hypothesis probability =   3.173936e-01

Photon flux (15-150 keV)    in 98.08 sec: 0.375698 ( -0.029326  0.029381 ) ph/cm2/s
Energy fluence (15-150 keV)             : 2.58416e-06 ( -2.14533e-07  2.16047e-07 ) ergs/cm2
Cutoff power-law model
Time interval is from  -30.748 sec. to   67.332 sec.
Spectral model in the cutoff power-law:
------------------------------------------------------------
Parameters  : value       lower 90%   higher 90%
Photon index: -1.48919     ( -0.257726   0.530599 )
Epeak [keV] : 130.049      ( -62.9076 -130.049 )
Norm@50keV  : 3.57617E-03    ( -0.00105581   0.00293322 )
------------------------------------------------------------
#Fit statistic : Chi-Squared =          61.05 using 59 PHA bins.
# Reduced chi-squared =          1.090 for     56 degrees of freedom
# Null hypothesis probability =   2.994780e-01

Photon flux (15-150 keV)    in 98.08 sec: 0.372175 ( -0.030581  0.030574 ) ph/cm2/s
Energy fluence (15-150 keV)             : 2.55124e-06 ( -2.29835e-07  2.30015e-07 ) ergs/cm2
1-s peak spectrum fit
Power-law model

Time interval is from    0.272 sec. to    1.272 sec.

Spectral model in power-law:
------------------------------------------------------------
Parameters  : value       lower 90%   higher 90%
Photon index: -1.4907     ( -0.243031   0.23948 )
Norm@50keV  : 1.76625E-02    ( -0.00250934   0.00249335 )
------------------------------------------------------------
#Fit statistic : Chi-Squared =          46.09 using 59 PHA bins.
# Reduced chi-squared =         0.8085 for     57 degrees of freedom
# Null hypothesis probability =   8.490208e-01

Photon flux (15-150 keV)    in 1 sec: 2.19956 ( -0.31439  0.31499 ) ph/cm2/s
Energy fluence (15-150 keV)             : 1.67834e-07 ( -2.58269e-08  2.59911e-08 ) ergs/cm2
Cutoff power-law model
Time interval is from    0.272 sec. to    1.272 sec.
Spectral model in the cutoff power-law:
------------------------------------------------------------
Parameters  : value       lower 90%   higher 90%
Photon index: -1.49403     ( -0.240277   0.275823 )
Epeak [keV] : 9999.26      ( -9999.35 -9999.35 )
Norm@50keV  : 1.76720E-02    ( -0.0139954   0.0240825 )
------------------------------------------------------------
#Fit statistic : Chi-Squared =          46.09 using 59 PHA bins.
# Reduced chi-squared =         0.8231 for     56 degrees of freedom
# Null hypothesis probability =   8.248095e-01

Photon flux (15-150 keV)    in 1 sec: 2.20849 ( -0.39179  0.37269 ) ph/cm2/s
Energy fluence (15-150 keV)             : 1.68807e-07 ( -3.26594e-08  3.08801e-08 ) ergs/cm2
Time-resolved spectra
Distribution
T90 vs. Hardness ratio plot
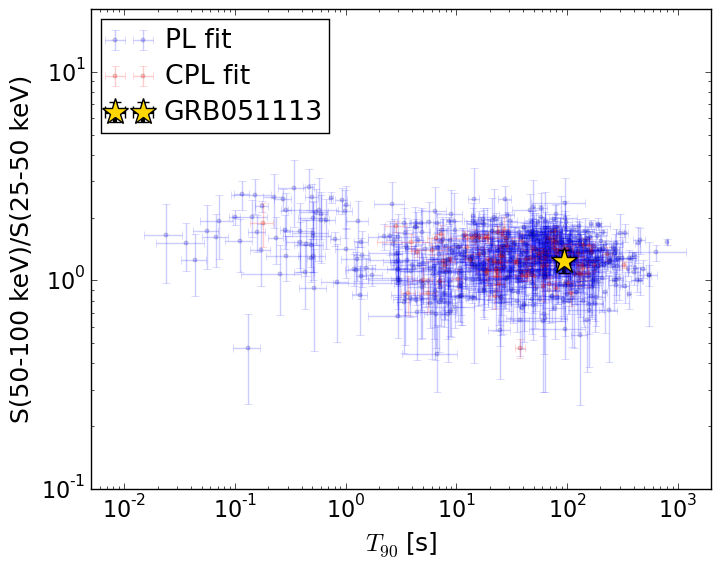
T90                                   = 93.296 sec.
Hardness ratio (energy fluence ratio) = 1.24288232617
S(15-50 keV) vs. S(50-150 keV) plot
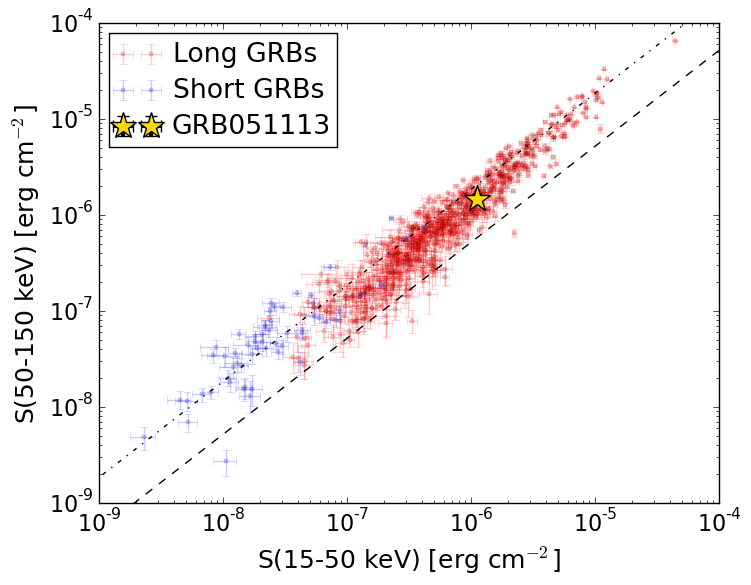
S(15-50 keV)  = 1.1196582e-06
S(50-150 keV) = 1.4645297e-06
The dash-dotted line and the dashed line traces the fluences calculated from the Band function with Epeak = 15 and 150 keV, respectively. Both lines assume a canonical values of alpha = -1 and beta = -2.5.
Mask shadow pattern
IMX = 5.984960676384176E-01, IMY = 6.822030126724233E-01
Spacecraft aspect plot

Bright source in the pre-burst/pre-slew/post-slew images
Pre-burst image of 15-350 keV band
Time interval of the image:
-299.560000 -30.748000

# RAcent  DECcent POSerr Theta    Phi  PeakCts   SNR AngSep     Name
#  [deg]    [deg]    ['] [deg]  [deg]                   [']
210.9442  61.9657    2.9  49.5  148.6   2.8386   3.9 ------	UNKNOWN
238.1786  46.4328    2.7  53.0  176.5   2.2318   4.3 ------	UNKNOWN
243.1856  43.7814    2.6  55.8 -179.3   3.3905   4.5 ------	UNKNOWN
217.9668  23.4449    2.6  31.2 -156.0   0.7980   4.4 ------	UNKNOWN
211.8578   2.5366    2.6  29.0 -112.1   1.0120   4.4 ------	UNKNOWN
159.2936 -35.5459    2.5  57.1  -21.2   3.3407   4.6 ------	UNKNOWN
161.1313 -38.3826    2.9  58.9  -24.3   4.6001   4.0 ------	UNKNOWN
Pre-slew background subtracted image of 15-350 keV band
Time interval of the image:
-30.748000 67.332000

# RAcent  DECcent POSerr Theta    Phi  PeakCts   SNR AngSep     Name
#  [deg]    [deg]    ['] [deg]  [deg]                   [']
152.2483 -18.9546    2.5  47.9   -2.0   0.9584   4.6 ------	UNKNOWN
208.5478  15.1787    1.9  22.0 -138.2   0.6363   6.1 ------	UNKNOWN
187.2454 -26.3915    0.6  42.2  -48.7   4.3985  18.0 ------	UNKNOWN
235.4889   7.9571    2.5  49.2 -133.6   2.2982   4.7 ------	UNKNOWN
Post-slew image of 15-350 keV band
Time interval of the image: