Analysis Summary
Notes:
- 1) No attempt has been made to eliminate the non-significant decimal places.
- 2) This batgrbproduct analysis is done using the HEASARC data.
- 3) This batgrbproduct analysis is using the flight position for the mask-weighting calculation.
======================================================================
BAT GRB EVENT DATA PROCESSING REPORT
Process Script Ver: batgrbproduct v2.46
Process Start Time: Wed Jan 22 19:34:03 EST 2014
Host Name: batevent1
Current Working Dir: /local/data/batevent/batevent_reproc/trigger164268
======================================================================
Trigger: 00164268 Segment: 000
BAT Trigger Time: 153917479.936 [s; MET]
Trigger Stop: 153917484.032 [s; MET]
UTC: 2005-11-17T10:51:20.091280 [includes UTCF correction]
Where From?: TDRSS position message
BAT
RA: 228.404931238687 Dec: 30.8698475591698 [deg; J2000]
Catalogged Source?: NO
Point Source?: YES
GRB Indicated?: YES [ by BAT flight software ]
Image S/N Ratio: 12.84
Image Trigger?: NO
Rate S/N Ratio: 11.6189500386223 [ if not an image trigger ]
Image S/N Ratio: 12.84
Analysis Position: [ source = BAT ]
RA: 228.404931238687 Dec: 30.8698475591698 [deg; J2000]
Refined Position: [ source = BAT pre-slew burst ]
RA: 228.400735718175 Dec: 30.8644104012478 [deg; J2000]
{ 15h 13m 36.2s , +30d 51' 51.9" }
+/- 0.942313854386257 [arcmin] (estimated 90% radius based on SNR)
+/- 0.283716357903305 [arcmin] (formal 1-sigma fit error)
SNR: 33.1117277288504
Angular difference between the analysis and refined position is 0.391298 arcmin
Partial Coding Fraction: 0.7265625 [ including projection effects ]
Duration
T90: 140.632000029087 +/- 13.5007752244694
Measured from: -11.1159999966621
to: 129.516000032425 [s; relative to TRIGTIME]
T50: 59.2200000286102 +/- 4.04570686559896
Measured from: 11.7360000014305
to: 70.9560000300407 [s; relative to TRIGTIME]
Fluence
Peak Flux (peak 1 second)
Measured from: 2.6240000128746
to: 3.6240000128746 [s; relative to TRIGTIME]
Total Fluence
Measured from: -29.6559999883175
to: 156.395999997854 [s; relative to TRIGTIME]
Band 1 Band 2 Band 3 Band 4
15-25 25-50 50-100 100-350 keV
Total 2.646556 2.899123 1.807865 0.332827
0.071634 0.074374 0.065790 0.058406 [error]
Peak 0.036576 0.049305 0.016785 0.004180
0.006132 0.006401 0.005613 0.004765 [error]
[ fluence units of on-axis counts / fully illuminated detector ]
======================================================================
====== Table of the duration information =============================
Value tstart tstop
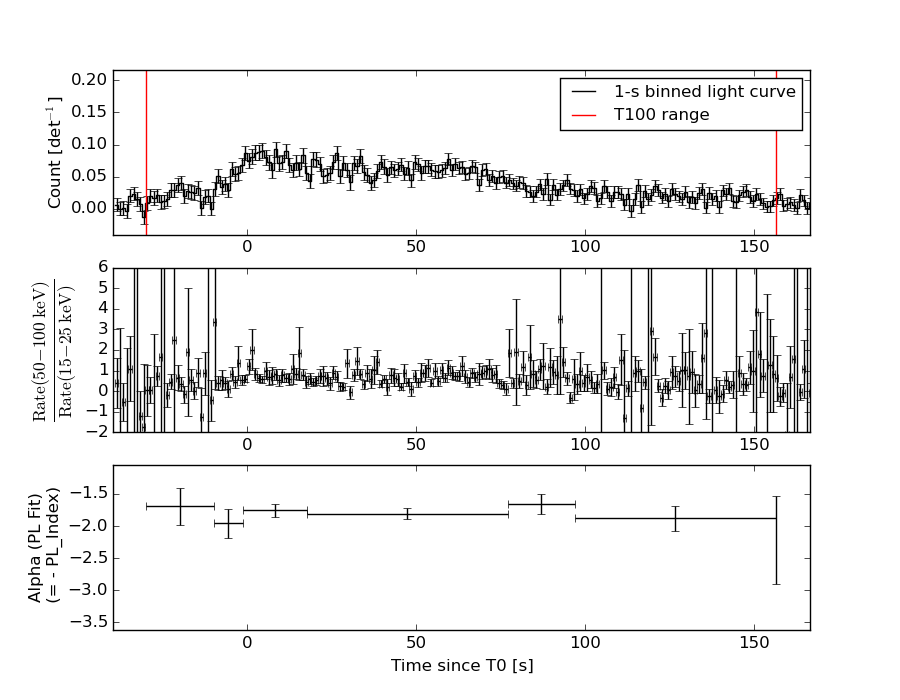
T100 186.052 -29.656 156.396
T90 140.632 -11.116 129.516
T50 59.220 11.736 70.956
Peak 1.000 2.624 3.624
====== Spectral Analysis Summary =====================================
Model : spectral model: simple power-law (PL) and cutoff power-law (CPL)
Ph_index : photon index: E^{Ph_index}
Ph_90err : 90% error of the photon index
Epeak : Epeak in keV
Epeak_90err: 90% error of Epeak
Norm : normalization at 50 keV in both the PL model and CPL model
Nomr_90err : 90% error of the normalization
chi2 : Chi-Squared
dof : degree of freedo
=== Time-averaged spectral analysis ===
(Best model with acceptable fit: PL)
Model Ph_index Ph_90err_low Ph_90err_hi Epeak Epeak_90err_low Epeak_90err_hi Norm Nomr_90err_low Norm_90err_hi chi2 dof
PL -1.817 -0.066 0.066 - - - 2.58e-03 -9.02e-05 8.99e-05 52.230 57
CPL -1.529 -0.261 0.278 80.377 -18.321 224.929 3.59e-03 -9.12e-04 1.33e-03 48.670 56
=== 1-s peak spectral analysis ===
(Best model with acceptable fit: PL)
Model Ph_index Ph_90err_low Ph_90err_hi Epeak Epeak_90err_low Epeak_90err_hi Norm Nomr_90err_low Norm_90err_hi chi2 dof
PL -2.007 -0.316 0.289 - - - 6.07e-03 -1.36e-03 1.33e-03 50.930 57
CPL -0.327 -1.429 2.625 38.074 -13.215 18.595 6.42e-02 -6.42e-02 3.32e+00 46.620 56
=== Fluence/Peak Flux Summary ===
Model Band1 Band2 Band3 Band4 Band5 Total
15-25 25-50 50-100 100-350 15-150 15-350 keV
Fluence PL 8.26e-07 1.25e-06 1.42e-06 3.07e-06 4.42e-06 6.57e-06 erg/cm2
90%_error_low -4.90e-08 -4.31e-08 -6.84e-08 -3.13e-07 -1.57e-07 -3.64e-07 erg/cm2
90%_error_hi 5.01e-08 4.29e-08 6.84e-08 3.37e-07 1.57e-07 3.82e-07 erg/cm2
Peak flux PL 4.07e-01 3.04e-01 1.51e-01 1.07e-01 9.13e-01 9.70e-01 ph/cm2/s
90%_error_low -9.04e-02 -5.26e-02 -4.25e-02 -4.75e-02 -1.56e-01 -1.69e-01 ph/cm2/s
90%_error_hi 9.37e-02 5.25e-02 4.42e-02 6.62e-02 1.56e-01 1.70e-01 ph/cm2/s
Fluence CPL 7.82e-07 1.28e-06 1.43e-06 2.00e-06 4.30e-06 5.49e-06 erg/cm2
90%_error_low -6.19e-08 -4.95e-08 -7.14e-08 -6.10e-07 -1.89e-07 -6.48e-07 erg/cm2
90%_error_hi 6.31e-08 5.00e-08 7.18e-08 9.44e-07 1.89e-07 9.61e-07 erg/cm2
Peak flux CPL 3.67e-01 3.68e-01 1.32e-01 1.34e-02 8.79e-01 8.80e-01 ph/cm2/s
90%_error_low -1.02e-01 -7.50e-02 N/A -1.34e-02 -1.57e-01 -1.58e-01 ph/cm2/s
90%_error_hi 1.03e-01 8.13e-02 N/A 6.42e-02 1.57e-01 1.61e-01 ph/cm2/s
======================================================================
Image
Pre-slew 15.0-350.0 keV image (Event data)
#   RAcent    DECcent   POSerr    Theta     Phi              Peak Cts       SNR   Name
  228.4007    30.8644   0.0058    29.1923  -141.9249         3.4115537     33.112 TRIG_00164268

Foreground time interval of the image:
-29.656  35.765 (delta_t =  65.421 [sec])
Background time interval of the image:
-299.936 -29.656 (delta_t = 270.280 [sec])
Light Curves
Note: The mask-weighted lightcurves have units of either count/det or counts/sec/det, where a det is 0.4 x 0.4 = 0.16 sq cm.
Full-time range; 1 s binning
Other quick-look light curves:
- 64 ms binning (zoomed)
- 16 ms binning (zoomed)
- 8 ms binning (zoomed)
- 2 ms binning (zoomed)
- SN=5 or 10 s binning (full-time range)
- Raw light curve
Spectra
- 64 ms binning (zoomed)
- 16 ms binning (zoomed)
- 8 ms binning (zoomed)
- 2 ms binning (zoomed)
- SN=5 or 10 s binning (full-time range)
- Raw light curve
Spectra
Notes:
- 1) The fitting includes the systematic errors.
- 2) When the burst includes telescope slew time periods, the fitting uses an average response file made from multiple 5-s response files through out the slew time plus single time preiod for the non-slew times, and weighted by the total counts in the corresponding time period using addrmf. An average response file is needed becuase a spectral fit using the pre-slew DRM will introduce some errors in both a spectral shape and a normalization if the PHA file contains a lot of the slew/post-slew time interval.
- 3) For fits to more complicated models (e.g. a power-law over a cutoff power-law), the BAT team has decided to require a chi-square improvement of more than 6 for each extra dof.
Time averaged spectrum fit using the average DRM
Power-law model
Time interval is from  -29.656 sec. to  156.396 sec.

Spectral model in power-law:
------------------------------------------------------------
Parameters  : value       lower 90%   higher 90%
Photon index: -1.81721     ( -0.0662228   0.0656423 )
Norm@50keV  : 2.57955E-03    ( -9.01797e-05   8.98487e-05 )
------------------------------------------------------------
#Fit statistic : Chi-Squared =          52.23 using 59 PHA bins.
# Reduced chi-squared =         0.9164 for     57 degrees of freedom
# Null hypothesis probability =   6.541935e-01

Photon flux (15-150 keV)    in 186.1 sec: 0.357875 ( -0.012723  0.012768 ) ph/cm2/s
Energy fluence (15-150 keV)             : 4.4177e-06 ( -1.56748e-07  1.57358e-07 ) ergs/cm2
Cutoff power-law model
Time interval is from  -29.656 sec. to  156.396 sec.
Spectral model in the cutoff power-law:
------------------------------------------------------------
Parameters  : value       lower 90%   higher 90%
Photon index: -1.52916     ( -0.260994   0.278119 )
Epeak [keV] : 80.3767      ( -18.3211 224.929 )
Norm@50keV  : 3.59483E-03    ( -0.000912216   0.00132575 )
------------------------------------------------------------
#Fit statistic : Chi-Squared =          48.67 using 59 PHA bins.
# Reduced chi-squared =         0.8691 for     56 degrees of freedom
# Null hypothesis probability =   7.459396e-01

Photon flux (15-150 keV)    in 186.1 sec: 0.349781 ( -0.014529  0.0146 ) ph/cm2/s
Energy fluence (15-150 keV)             : 4.29869e-06 ( -1.89117e-07  1.8904e-07 ) ergs/cm2
1-s peak spectrum fit
Power-law model
Time interval is from    2.624 sec. to    3.624 sec.

Spectral model in power-law:
------------------------------------------------------------
Parameters  : value       lower 90%   higher 90%
Photon index: -2.00733     ( -0.315697   0.288819 )
Norm@50keV  : 6.06592E-03    ( -0.00135753   0.00132629 )
------------------------------------------------------------
#Fit statistic : Chi-Squared =          50.93 using 59 PHA bins.
# Reduced chi-squared =         0.8935 for     57 degrees of freedom
# Null hypothesis probability =   7.008692e-01

Photon flux (15-150 keV)    in 1 sec: 0.913034 ( -0.156063  0.156066 ) ph/cm2/s
Energy fluence (15-150 keV)             : 5.5968e-08 ( -1.15591e-08  1.20071e-08 ) ergs/cm2
Cutoff power-law model
Time interval is from    2.624 sec. to    3.624 sec.
Spectral model in the cutoff power-law:
------------------------------------------------------------
Parameters  : value       lower 90%   higher 90%
Photon index: -0.327286     ( -1.43352   2.62068 )
Epeak [keV] : 38.0739      ( -13.1939 18.6163 )
Norm@50keV  : 6.42088E-02    ( -0.0649119   3.32233 )
------------------------------------------------------------
#Fit statistic : Chi-Squared =          46.62 using 59 PHA bins.
# Reduced chi-squared =         0.8324 for     56 degrees of freedom
# Null hypothesis probability =   8.099460e-01

Photon flux (15-150 keV)    in 1 sec: 0.878712 ( -0.156612  0.157468 ) ph/cm2/s
Energy fluence (15-150 keV)             : 4.81415e-08 ( -1.13523e-08  1.31373e-08 ) ergs/cm2
Time-resolved spectra
Distribution
T90 vs. Hardness ratio plot
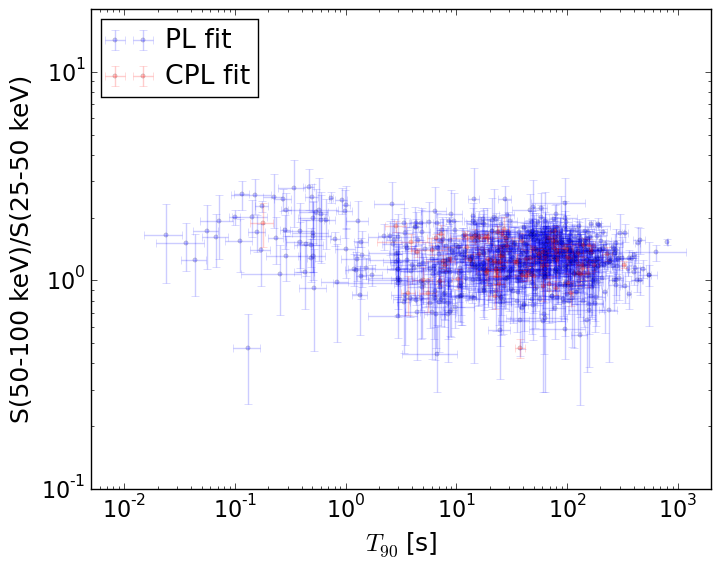
T90                                   = N/A sec.
Hardness ratio (energy fluence ratio) = N/A
S(15-50 keV) vs. S(50-150 keV) plot
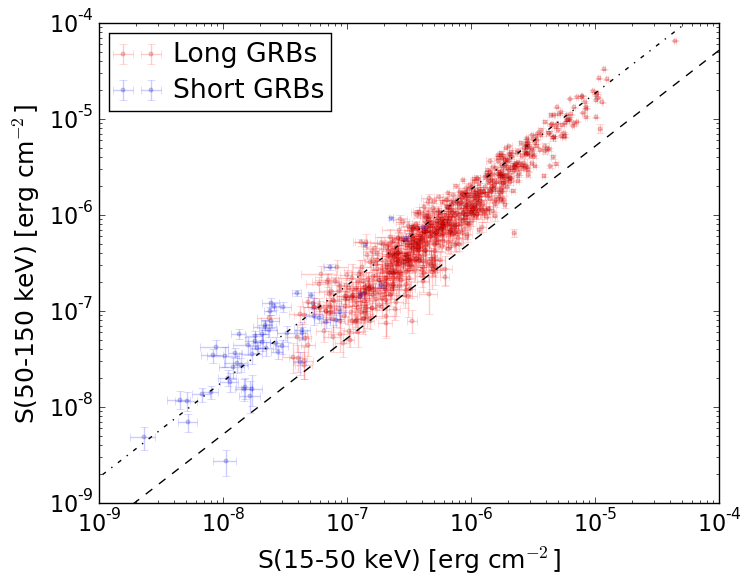
S(15-50 keV)  = N/A
S(50-150 keV) = N/A
The dash-dotted line and the dashed line traces the fluences calculated from the Band function with Epeak = 15 and 150 keV, respectively. Both lines assume a canonical values of alpha = -1 and beta = -2.5.
Mask shadow pattern
IMX = -4.398140455239909E-01, IMY = 3.445492376837285E-01
Spacecraft aspect plot
Bright source in the pre-burst/pre-slew/post-slew images
Pre-burst image of 15-350 keV band
Time interval of the image:
-299.936000 -29.656000

# RAcent  DECcent POSerr Theta    Phi  PeakCts   SNR AngSep     Name
#  [deg]    [deg]    ['] [deg]  [deg]                   [']
254.5086  35.4043    6.7  50.5 -152.3  -0.8646  -1.7    4.5	Her X-1
169.6188 -22.1344    3.1  55.7   -9.3   2.4631   3.7 ------	UNKNOWN
Pre-slew background subtracted image of 15-350 keV band
Time interval of the image:
-29.656000 35.764600

# RAcent  DECcent POSerr Theta    Phi  PeakCts   SNR AngSep     Name
#  [deg]    [deg]    ['] [deg]  [deg]                   [']
254.4769  35.3833   10.3  50.5 -152.3   0.2500   1.1    2.6	Her X-1
228.4007  30.8644    0.3  29.2 -141.9   3.4116  33.1 ------	UNKNOWN
196.5931 -24.7475    2.4  52.7  -39.9   2.0013   4.8 ------	UNKNOWN
Post-slew image of 15-350 keV band
Time interval of the image:
95.964600 302.144400

# RAcent  DECcent POSerr Theta    Phi  PeakCts   SNR AngSep     Name
#  [deg]    [deg]    ['] [deg]  [deg]                   [']
254.4461  35.2026   14.9  22.2  167.3   0.1182   0.8    8.4	Her X-1
268.3722  -1.4527  129.6  49.9 -141.6   0.0500   0.1    0.3	SW J1753.5-0127
228.4136  30.8595    0.8   0.0 -135.2   2.0353  14.1 ------	UNKNOWN
205.7297  10.7416    2.4  29.1  -33.4   0.8583   4.9 ------	UNKNOWN