Analysis Summary
Notes:
- 1) No attempt has been made to eliminate the non-significant decimal places.
- 2) This batgrbproduct analysis is done using the HEASARC data.
- 3) This batgrbproduct analysis is using the flight position for the mask-weighting calculation.
======================================================================
BAT GRB EVENT DATA PROCESSING REPORT
Process Script Ver: batgrbproduct v2.46
Process Start Time: Wed Jan 22 19:28:28 EST 2014
Host Name: batevent1
Current Working Dir: /local/data/batevent/batevent_reproc/trigger171931
======================================================================
Trigger: 00171931 Segment: 000
BAT Trigger Time: 155886381.056 [s; MET]
Trigger Stop: 155886382.08 [s; MET]
UTC: 2005-12-10T05:46:21.168500 [includes UTCF correction]
Where From?: TDRSS position message
BAT
RA: 330.196613815793 Dec: -57.6339823400996 [deg; J2000]
Catalogged Source?: NO
Point Source?: YES
GRB Indicated?: YES [ by BAT flight software ]
Image S/N Ratio: 8.97
Image Trigger?: NO
Rate S/N Ratio: 15.7797338380595 [ if not an image trigger ]
Image S/N Ratio: 8.97
Analysis Position: [ source = BAT ]
RA: 330.196613815793 Dec: -57.6339823400996 [deg; J2000]
Refined Position: [ source = BAT pre-slew burst ]
RA: 330.188381954684 Dec: -57.6241946318991 [deg; J2000]
{ 22h 00m 45.2s , -57d 37' 27.1" }
+/- 1.98445274791184 [arcmin] (estimated 90% radius based on SNR)
+/- 0.999622029534953 [arcmin] (formal 1-sigma fit error)
SNR: 11.4266070050524
Angular difference between the analysis and refined position is 0.644054 arcmin
Partial Coding Fraction: 0.8984375 [ including projection effects ]
Duration
T90: 1.30000001192093 +/- 0.295194849441729
Measured from: -0.203999996185303
to: 1.09600001573563 [s; relative to TRIGTIME]
T50: 0.560000002384186 +/- 0.28677516664519
Measured from: 0.240000009536743
to: 0.800000011920929 [s; relative to TRIGTIME]
Fluence
Peak Flux (peak 1 second)
Measured from: 0.11599999666214
to: 1.11599999666214 [s; relative to TRIGTIME]
Total Fluence
Measured from: -0.263999998569489
to: 1.19600000977516 [s; relative to TRIGTIME]
Band 1 Band 2 Band 3 Band 4
15-25 25-50 50-100 100-350 keV
Total 0.024784 0.039606 0.042895 0.015921
0.005842 0.006308 0.005789 0.004936 [error]
Peak 0.019171 0.030040 0.038293 0.011802
0.004835 0.005329 0.004884 0.004177 [error]
[ fluence units of on-axis counts / fully illuminated detector ]
======================================================================
====== Table of the duration information =============================
Value tstart tstop
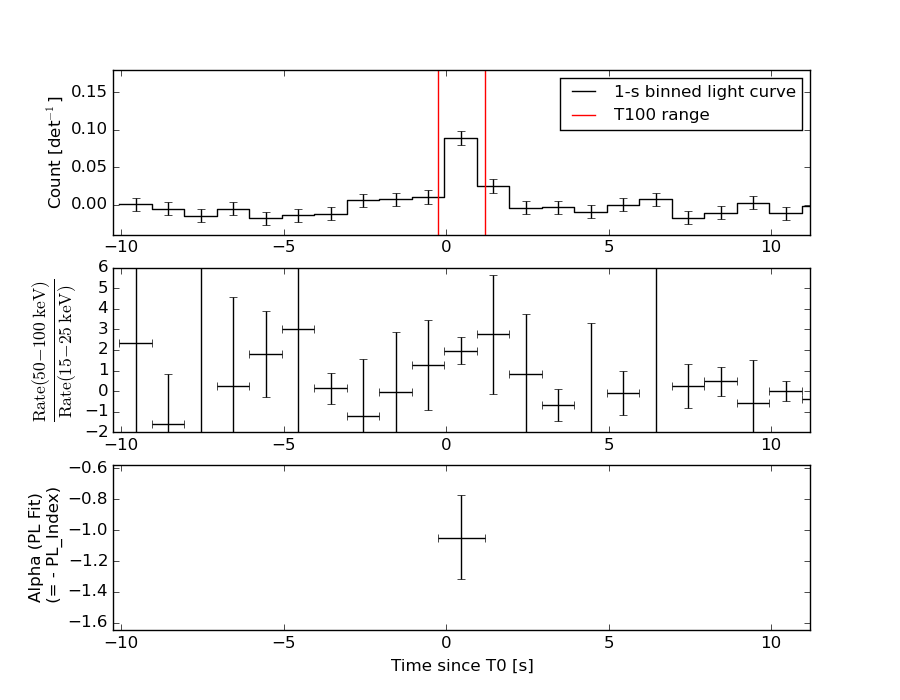
T100 1.460 -0.264 1.196
T90 1.300 -0.204 1.096
T50 0.560 0.240 0.800
Peak 1.000 0.116 1.116
====== Spectral Analysis Summary =====================================
Model : spectral model: simple power-law (PL) and cutoff power-law (CPL)
Ph_index : photon index: E^{Ph_index}
Ph_90err : 90% error of the photon index
Epeak : Epeak in keV
Epeak_90err: 90% error of Epeak
Norm : normalization at 50 keV in both the PL model and CPL model
Nomr_90err : 90% error of the normalization
chi2 : Chi-Squared
dof : degree of freedo
=== Time-averaged spectral analysis ===
(Best model with acceptable fit: PL)
Model Ph_index Ph_90err_low Ph_90err_hi Epeak Epeak_90err_low Epeak_90err_hi Norm Nomr_90err_low Norm_90err_hi chi2 dof
PL -1.051 -0.266 0.276 - - - 5.54e-03 -8.44e-04 8.40e-04 62.320 57
CPL -0.745 -0.542 1.224 243.930 -243.930 -243.930 7.50e-03 -3.46e-03 1.57e-02 62.050 56
=== 1-s peak spectral analysis ===
(Best model with acceptable fit: PL)
Model Ph_index Ph_90err_low Ph_90err_hi Epeak Epeak_90err_low Epeak_90err_hi Norm Nomr_90err_low Norm_90err_hi chi2 dof
PL -0.924 -0.268 0.284 - - - 6.69e-03 -1.06e-03 1.04e-03 50.090 57
CPL -0.575 -0.585 1.331 250.849 -250.849 -250.849 9.32e-03 -3.54e-03 2.04e-02 49.770 56
=== Fluence/Peak Flux Summary ===
Model Band1 Band2 Band3 Band4 Band5 Total
15-25 25-50 50-100 100-350 15-150 15-350 keV
Fluence PL 6.79e-09 1.65e-08 3.18e-08 1.51e-07 8.60e-08 2.06e-07 erg/cm2
90%_error_low -2.00e-09 -3.07e-09 -5.44e-09 -5.15e-08 -1.40e-08 -5.52e-08 erg/cm2
90%_error_hi 2.21e-09 2.99e-09 5.35e-09 6.82e-08 1.41e-08 6.97e-08 erg/cm2
Peak flux PL 1.59e-01 2.26e-01 2.38e-01 4.63e-01 7.68e-01 1.09e+00 ph/cm2/s
90%_error_low -5.02e-02 -4.66e-02 -3.80e-02 -1.45e-01 -1.21e-01 -1.77e-01 ph/cm2/s
90%_error_hi 5.69e-02 4.56e-02 3.76e-02 1.85e-01 1.22e-01 1.87e-01 ph/cm2/s
Fluence CPL 6.25e-09 1.67e-08 3.29e-08 1.04e-07 8.50e-08 1.60e-07 erg/cm2
90%_error_low -2.61e-09 -3.23e-09 -6.26e-09 -6.92e-08 -1.46e-08 -7.03e-08 erg/cm2
90%_error_hi 2.62e-09 3.30e-09 6.73e-09 6.22e-08 1.45e-08 8.44e-08 erg/cm2
Peak flux CPL 1.42e-01 2.27e-01 2.49e-01 3.39e-01 7.56e-01 9.58e-01 ph/cm2/s
90%_error_low -6.72e-02 -4.93e-02 -4.58e-02 -1.95e-01 -1.28e-01 -2.50e-01 ph/cm2/s
90%_error_hi 6.93e-02 4.87e-02 5.05e-02 1.71e-01 1.26e-01 2.92e-01 ph/cm2/s
======================================================================
Image
Pre-slew 15.0-350.0 keV image (Event data)
#   RAcent    DECcent   POSerr    Theta     Phi              Peak Cts       SNR   Name
  330.1884   -57.6242   0.0169    27.2103  -162.8858         0.1251672     11.427 TRIG_00171931

Foreground time interval of the image:
 -0.264   1.196 (delta_t =   1.460 [sec])
Background time interval of the image:
-299.056  -0.264 (delta_t = 298.792 [sec])
Light Curves
Note: The mask-weighted lightcurves have units of either count/det or counts/sec/det, where a det is 0.4 x 0.4 = 0.16 sq cm.
Full-time range; 1 s binning
Other quick-look light curves:
- 64 ms binning (zoomed)
- 16 ms binning (zoomed)
- 8 ms binning (zoomed)
- 2 ms binning (zoomed)
- SN=5 or 10 s binning (full-time range)
- Raw light curve
Spectra
- 64 ms binning (zoomed)
- 16 ms binning (zoomed)
- 8 ms binning (zoomed)
- 2 ms binning (zoomed)
- SN=5 or 10 s binning (full-time range)
- Raw light curve
Spectra
Notes:
- 1) The fitting includes the systematic errors.
- 2) When the burst includes telescope slew time periods, the fitting uses an average response file made from multiple 5-s response files through out the slew time plus single time preiod for the non-slew times, and weighted by the total counts in the corresponding time period using addrmf. An average response file is needed becuase a spectral fit using the pre-slew DRM will introduce some errors in both a spectral shape and a normalization if the PHA file contains a lot of the slew/post-slew time interval.
- 3) For fits to more complicated models (e.g. a power-law over a cutoff power-law), the BAT team has decided to require a chi-square improvement of more than 6 for each extra dof.
Time averaged spectrum fit using the average DRM
Power-law model
Time interval is from   -0.264 sec. to    1.196 sec.

Spectral model in power-law:
------------------------------------------------------------
Parameters  : value       lower 90%   higher 90%
Photon index: -1.05057     ( -0.266097   0.275885 )
Norm@50keV  : 5.54247E-03    ( -0.000843977   0.000840262 )
------------------------------------------------------------
#Fit statistic : Chi-Squared =          62.32 using 59 PHA bins.
# Reduced chi-squared =          1.093 for     57 degrees of freedom
# Null hypothesis probability =   2.926559e-01

Photon flux (15-150 keV)    in 1.46 sec: 0.640162 ( -0.099827  0.100347 ) ph/cm2/s
Energy fluence (15-150 keV)             : 8.59949e-08 ( -1.40363e-08  1.41394e-08 ) ergs/cm2
Cutoff power-law model
Time interval is from   -0.264 sec. to    1.196 sec.
Spectral model in the cutoff power-law:
------------------------------------------------------------
Parameters  : value       lower 90%   higher 90%
Photon index: -0.745243     ( -0.542066   1.22439 )
Epeak [keV] : 243.930      ( -243.88 -243.88 )
Norm@50keV  : 7.50237E-03    ( -0.00346295   0.0157108 )
------------------------------------------------------------
#Fit statistic : Chi-Squared =          62.05 using 59 PHA bins.
# Reduced chi-squared =          1.108 for     56 degrees of freedom
# Null hypothesis probability =   2.692739e-01

Photon flux (15-150 keV)    in 1.46 sec: 0.631286 ( -0.104663  0.103998 ) ph/cm2/s
Energy fluence (15-150 keV)             : 8.50105e-08 ( -1.45846e-08  1.45169e-08 ) ergs/cm2
1-s peak spectrum fit
Power-law model
Time interval is from    0.116 sec. to    1.116 sec.

Spectral model in power-law:
------------------------------------------------------------
Parameters  : value       lower 90%   higher 90%
Photon index: -0.924194     ( -0.26824   0.283785 )
Norm@50keV  : 6.68892E-03    ( -0.00105681   0.00104246 )
------------------------------------------------------------
#Fit statistic : Chi-Squared =          50.09 using 59 PHA bins.
# Reduced chi-squared =         0.8787 for     57 degrees of freedom
# Null hypothesis probability =   7.298975e-01

Photon flux (15-150 keV)    in 1 sec: 0.767991 ( -0.121163  0.121999 ) ph/cm2/s
Energy fluence (15-150 keV)             : 7.43807e-08 ( -1.19584e-08  1.20245e-08 ) ergs/cm2
Cutoff power-law model
Time interval is from    0.116 sec. to    1.116 sec.
Spectral model in the cutoff power-law:
------------------------------------------------------------
Parameters  : value       lower 90%   higher 90%
Photon index: -0.574966     ( -0.585752   1.33019 )
Epeak [keV] : 250.849      ( -250.441 -250.441 )
Norm@50keV  : 9.32436E-03    ( -0.00354924   0.0203493 )
------------------------------------------------------------
#Fit statistic : Chi-Squared =          49.77 using 59 PHA bins.
# Reduced chi-squared =         0.8888 for     56 degrees of freedom
# Null hypothesis probability =   7.082483e-01

Photon flux (15-150 keV)    in 1 sec: 0.755856 ( -0.127607  0.12643 ) ph/cm2/s
Energy fluence (15-150 keV)             : 7.35377e-08 ( -1.24111e-08  1.23182e-08 ) ergs/cm2
Time-resolved spectra
Distribution
T90 vs. Hardness ratio plot
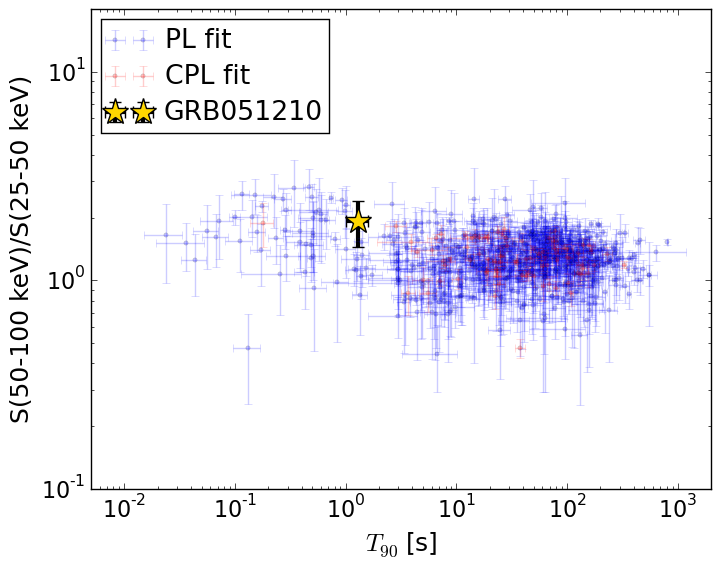
T90                                   = 1.3 sec.
Hardness ratio (energy fluence ratio) = 1.93112378957
S(15-50 keV) vs. S(50-150 keV) plot
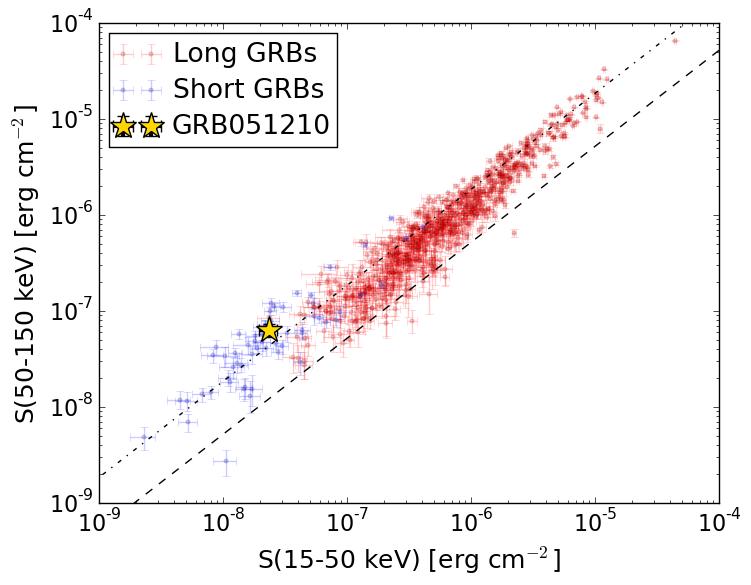
S(15-50 keV)  = 2.3254068e-08
S(50-150 keV) = 6.274165e-08
The dash-dotted line and the dashed line traces the fluences calculated from the Band function with Epeak = 15 and 150 keV, respectively. Both lines assume a canonical values of alpha = -1 and beta = -2.5.
Mask shadow pattern
IMX = -4.913912948410936E-01, IMY = 1.513051605122284E-01
Spacecraft aspect plot
Bright source in the pre-burst/pre-slew/post-slew images
Pre-burst image of 15-350 keV band
Time interval of the image:
-299.056000 -0.264000

# RAcent  DECcent POSerr Theta    Phi  PeakCts   SNR AngSep     Name
#  [deg]    [deg]    ['] [deg]  [deg]                   [']
284.8855 -24.8098  104.1  38.3  -72.6  -0.0584  -0.1   10.5	HT1900.1-2455
288.8152  10.9670    3.2  55.9  -28.7   3.3522   3.7    1.6	GRS 1915+105
323.0864 -28.1570    2.9   4.8  -43.0   0.6781   4.0 ------	UNKNOWN
280.0281 -30.2061    2.9  41.0  -82.6   3.3152   3.9 ------	UNKNOWN
Pre-slew background subtracted image of 15-350 keV band
Time interval of the image:
-0.264000 1.196000

# RAcent  DECcent POSerr Theta    Phi  PeakCts   SNR AngSep     Name
#  [deg]    [deg]    ['] [deg]  [deg]                   [']
285.0013 -24.8730    9.2  38.2  -72.7  -0.0365  -1.3    3.4	HT1900.1-2455
288.7620  10.7945 2700.0  55.8  -28.9   0.0001   0.0    9.3	GRS 1915+105
330.1885 -57.6241    1.0  27.2 -162.9   0.1252  11.4 ------	UNKNOWN
322.9227 -58.2166    2.4  28.0 -154.6   0.0547   4.9 ------	UNKNOWN
 49.2967 -83.8558    2.4  58.8 -167.4   0.3341   4.8 ------	UNKNOWN
294.6609  18.8703    2.0  58.8  -17.6   0.3939   5.9 ------	UNKNOWN
Post-slew image of 15-350 keV band
Time interval of the image:
68.044590 303.049400

# RAcent  DECcent POSerr Theta    Phi  PeakCts   SNR AngSep     Name
#  [deg]    [deg]    ['] [deg]  [deg]                   [']
186.4757 -62.8221   10.8  56.4 -162.3   0.6876   1.1    5.9	GX 301-2
264.7779 -44.4865   13.0  41.3 -102.1   0.6697   0.9    2.7	4U 1735-44
  2.8272 -23.9156    3.2  41.0   47.5   1.4241   3.6 ------	UNKNOWN
312.5843  -5.9179    2.5  53.5  -23.2   2.0304   4.6 ------	UNKNOWN