Analysis Summary
Notes:
- 1) No attempt has been made to eliminate the non-significant decimal places.
- 2) This batgrbproduct analysis is done using the HEASARC data.
- 3) This batgrbproduct analysis is using the flight position for the mask-weighting calculation.
======================================================================
BAT GRB EVENT DATA PROCESSING REPORT
Process Script Ver: batgrbproduct v2.46
Process Start Time: Wed Jan 22 19:22:29 EST 2014
Host Name: batevent1
Current Working Dir: /local/data/batevent/batevent_reproc/trigger173780
======================================================================
Trigger: 00173780 Segment: 000
BAT Trigger Time: 156822675.776 [s; MET]
Trigger Stop: 156822675.84 [s; MET]
UTC: 2005-12-21T01:51:15.868000 [includes UTCF correction]
Where From?: (*SHORT BURST*) TDRSS scaled map message
BAT
RA: 328.710912255944 Dec: 16.8957209657683 [deg; J2000]
Catalogged Source?: NO
Point Source?: YES
GRB Indicated?: YES [ by BAT flight software ]
Image S/N Ratio: 16.39
Image Trigger?: NO
Rate S/N Ratio: 56.0267793113258 [ if not an image trigger ]
Image S/N Ratio: 16.39
Analysis Position: [ source = BAT ]
RA: 328.710912255944 Dec: 16.8957209657683 [deg; J2000]
Refined Position: [ source = BAT pre-slew burst ]
RA: 328.712488221718 Dec: 16.8911945453272 [deg; J2000]
{ 21h 54m 51.0s , +16d 53' 28.3" }
+/- 0.616931500733245 [arcmin] (estimated 90% radius based on SNR)
+/- 0.191656142438593 [arcmin] (formal 1-sigma fit error)
SNR: 60.6428894105721
Angular difference between the analysis and refined position is 0.286260 arcmin
Partial Coding Fraction: 0.6328125 [ including projection effects ]
Duration
T90: 1.39200001955032 +/- 0.1974638995435
Measured from: 0.0320000052452087
to: 1.42400002479553 [s; relative to TRIGTIME]
T50: 0.548000007867813 +/- 0.0800999213143316
Measured from: 0.112000018358231
to: 0.660000026226044 [s; relative to TRIGTIME]
Fluence
Peak Flux (peak 1 second)
Measured from: -0.0279999971389771
to: 0.972000002861023 [s; relative to TRIGTIME]
Total Fluence
Measured from: -0.0320000052452087
to: 2.09200000762939 [s; relative to TRIGTIME]
Band 1 Band 2 Band 3 Band 4
15-25 25-50 50-100 100-350 keV
Total 0.453369 0.589756 0.545039 0.166671
0.013733 0.015021 0.014121 0.010538 [error]
Peak 0.333818 0.493821 0.491908 0.150075
0.010863 0.012541 0.012510 0.009073 [error]
[ fluence units of on-axis counts / fully illuminated detector ]
======================================================================
====== Table of the duration information =============================
Value tstart tstop
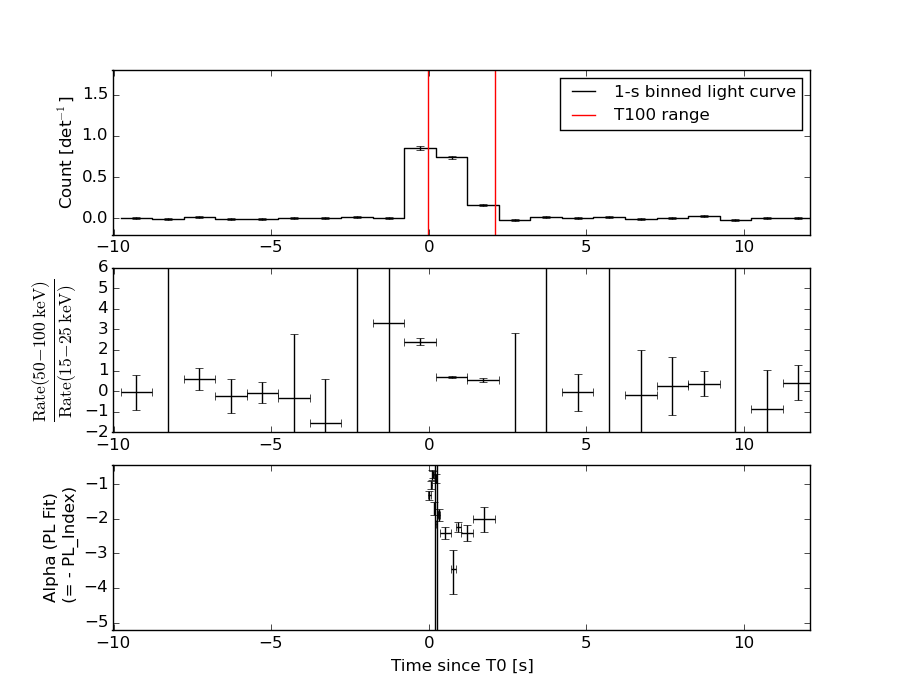
T100 2.124 -0.032 2.092
T90 1.392 0.032 1.424
T50 0.548 0.112 0.660
Peak 1.000 -0.028 0.972
====== Spectral Analysis Summary =====================================
Model : spectral model: simple power-law (PL) and cutoff power-law (CPL)
Ph_index : photon index: E^{Ph_index}
Ph_90err : 90% error of the photon index
Epeak : Epeak in keV
Epeak_90err: 90% error of Epeak
Norm : normalization at 50 keV in both the PL model and CPL model
Nomr_90err : 90% error of the normalization
chi2 : Chi-Squared
dof : degree of freedo
=== Time-averaged spectral analysis ===
(Best model with acceptable fit: PL)
Model Ph_index Ph_90err_low Ph_90err_hi Epeak Epeak_90err_low Epeak_90err_hi Norm Nomr_90err_low Norm_90err_hi chi2 dof
PL -1.395 -0.054 0.054 - - - 5.63e-02 -1.61e-03 1.61e-03 61.000 57
CPL -1.392 -0.054 0.149 9988.260 -9988.260 -9988.260 5.65e-02 -1.62e-03 8.77e-03 61.030 56
=== 1-s peak spectral analysis ===
(Best model with acceptable fit: N/A)
Model Ph_index Ph_90err_low Ph_90err_hi Epeak Epeak_90err_low Epeak_90err_hi Norm Nomr_90err_low Norm_90err_hi chi2 dof
PL -1.270 -0.052 0.052 - - - 1.02e-01 -2.91e-03 2.91e-03 66.640 57
CPL -1.199 -0.094 0.209 657.548 -657.548 -657.548 1.10e-01 -1.37e-02 2.49e-02 66.280 56
=== Fluence/Peak Flux Summary ===
Model Band1 Band2 Band3 Band4 Band5 Total
15-25 25-50 50-100 100-350 15-150 15-350 keV
Fluence PL 1.38e-07 2.71e-07 4.13e-07 1.37e-06 1.16e-06 2.19e-06 erg/cm2
90%_error_low -8.16e-09 -9.34e-09 -1.41e-08 -1.06e-07 -3.49e-08 -1.13e-07 erg/cm2
90%_error_hi 8.37e-09 9.31e-09 1.41e-08 1.12e-07 3.50e-08 1.18e-07 erg/cm2
Peak flux PL 8.10e-04 1.02e-02 8.87e-02 1.00e+01 3.93e-01 9.83e+00 ph/cm2/s
90%_error_low N/A N/A N/A N/A N/A N/A ph/cm2/s
90%_error_hi N/A N/A N/A N/A N/A N/A ph/cm2/s
Fluence CPL 1.38e-07 2.71e-07 4.13e-07 1.36e-06 1.16e-06 2.29e-06 erg/cm2
90%_error_low N/A -9.35e-09 N/A N/A -3.49e-08 -3.48e-07 erg/cm2
90%_error_hi N/A 9.30e-09 N/A N/A 3.49e-08 4.49e-09 erg/cm2
Peak flux CPL 3.31e+00 3.90e+00 3.25e+00 4.19e+00 1.21e+01 1.47e+01 ph/cm2/s
90%_error_low -2.68e-01 -1.36e-01 -1.06e-01 -7.58e-01 -3.97e-01 -8.96e-01 ph/cm2/s
90%_error_hi 2.32e-01 1.43e-01 1.29e-01 4.26e-01 3.98e-01 5.78e-01 ph/cm2/s
======================================================================
Image
Pre-slew 15.0-350.0 keV image (Event data)
#   RAcent    DECcent   POSerr    Theta     Phi              Peak Cts       SNR   Name
  328.7125    16.8912   0.0032    36.6224  -178.5787         1.8182488     60.643 TRIG_00173780

Foreground time interval of the image:
 -0.032   2.092 (delta_t =   2.124 [sec])
Background time interval of the image:
-223.875  -0.032 (delta_t = 223.843 [sec])
Light Curves
Note: The mask-weighted lightcurves have units of either count/det or counts/sec/det, where a det is 0.4 x 0.4 = 0.16 sq cm.
Full-time range; 1 s binning
Other quick-look light curves:
- 64 ms binning (zoomed)
- 16 ms binning (zoomed)
- 8 ms binning (zoomed)
- 2 ms binning (zoomed)
- SN=5 or 10 s binning (full-time range)
- Raw light curve
Spectra
- 64 ms binning (zoomed)
- 16 ms binning (zoomed)
- 8 ms binning (zoomed)
- 2 ms binning (zoomed)
- SN=5 or 10 s binning (full-time range)
- Raw light curve
Spectra
Notes:
- 1) The fitting includes the systematic errors.
- 2) When the burst includes telescope slew time periods, the fitting uses an average response file made from multiple 5-s response files through out the slew time plus single time preiod for the non-slew times, and weighted by the total counts in the corresponding time period using addrmf. An average response file is needed becuase a spectral fit using the pre-slew DRM will introduce some errors in both a spectral shape and a normalization if the PHA file contains a lot of the slew/post-slew time interval.
- 3) For fits to more complicated models (e.g. a power-law over a cutoff power-law), the BAT team has decided to require a chi-square improvement of more than 6 for each extra dof.
Time averaged spectrum fit using the average DRM
Power-law model

Time interval is from   -0.032 sec. to    2.092 sec.

Spectral model in power-law:
------------------------------------------------------------
Parameters  : value       lower 90%   higher 90%
Photon index: -1.39466     ( -0.0544723   0.0544858 )
Norm@50keV  : 5.63380E-02    ( -0.00161317   0.00161293 )
------------------------------------------------------------
#Fit statistic : Chi-Squared =          61.00 using 59 PHA bins.
# Reduced chi-squared =          1.070 for     57 degrees of freedom
# Null hypothesis probability =   3.342475e-01

Photon flux (15-150 keV)    in 2.124 sec: 6.85276 ( -0.21712  0.21807 ) ph/cm2/s
Energy fluence (15-150 keV)             : 1.15767e-06 ( -3.49154e-08  3.49574e-08 ) ergs/cm2
Cutoff power-law model
Time interval is from   -0.032 sec. to    2.092 sec.
Spectral model in the cutoff power-law:
------------------------------------------------------------
Parameters  : value       lower 90%   higher 90%
Photon index: -1.39186     ( -0.0541745   0.14865 )
Epeak [keV] : 9988.26      ( -9996.57 -9996.57 )
Norm@50keV  : 5.65433E-02    ( -0.00161638   0.00877272 )
------------------------------------------------------------
#Fit statistic : Chi-Squared =          61.03 using 59 PHA bins.
# Reduced chi-squared =          1.090 for     56 degrees of freedom
# Null hypothesis probability =   2.998938e-01

Photon flux (15-150 keV)    in 2.124 sec: 6.85109 (    ) ph/cm2/s
Energy fluence (15-150 keV)             : 1.15743e-06 ( -3.49339e-08  3.49228e-08 ) ergs/cm2
1-s peak spectrum fit
Power-law model

Time interval is from   -0.028 sec. to    0.972 sec.

Spectral model in power-law:
------------------------------------------------------------
Parameters  : value       lower 90%   higher 90%
Photon index: -1.27041     ( -0.0521367   0.0522041 )
Norm@50keV  : 0.102082    ( -0.00291305   0.00291161 )
------------------------------------------------------------
#Fit statistic : Chi-Squared =          66.64 using 59 PHA bins.
# Reduced chi-squared =          1.169 for     57 degrees of freedom
# Null hypothesis probability =   1.793145e-01

Photon flux (15-150 keV)    in 1 sec: 0.393205 (    ) ph/cm2/s
Energy fluence (15-150 keV)             : 1.01634e-06 ( -3.07189e-08  3.07644e-08 ) ergs/cm2
Cutoff power-law model
Time interval is from   -0.028 sec. to    0.972 sec.
Spectral model in the cutoff power-law:
------------------------------------------------------------
Parameters  : value       lower 90%   higher 90%
Photon index: -1.19933     ( -0.0941724   0.208753 )
Epeak [keV] : 657.548      ( -657.776 -657.776 )
Norm@50keV  : 0.109669    ( -0.013688   0.0249344 )
------------------------------------------------------------
#Fit statistic : Chi-Squared =          66.28 using 59 PHA bins.
# Reduced chi-squared =          1.184 for     56 degrees of freedom
# Null hypothesis probability =   1.635932e-01

Photon flux (15-150 keV)    in 1 sec: 12.0640 ( -0.3969  0.3982 ) ph/cm2/s
Energy fluence (15-150 keV)             : 1.01326e-06 ( -3.20544e-08  2.88894e-08 ) ergs/cm2
Time-resolved spectra
Distribution
T90 vs. Hardness ratio plot
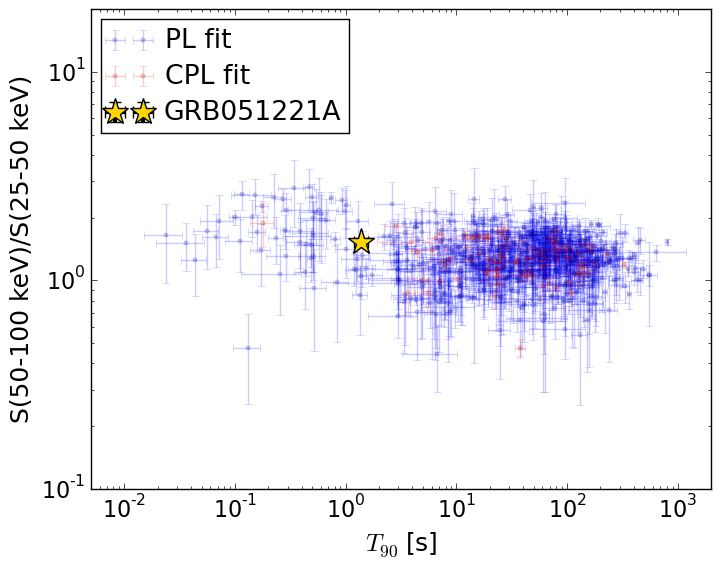
T90                                   = 1.392 sec.
Hardness ratio (energy fluence ratio) = 1.52138925683
S(15-50 keV) vs. S(50-150 keV) plot
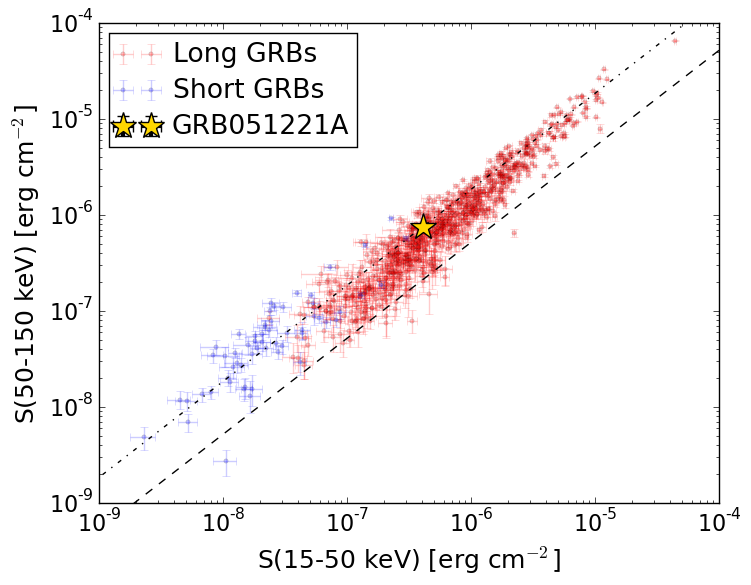
S(15-50 keV)  = 4.097687e-07
S(50-150 keV) = 7.478876e-07
The dash-dotted line and the dashed line traces the fluences calculated from the Band function with Epeak = 15 and 150 keV, respectively. Both lines assume a canonical values of alpha = -1 and beta = -2.5.
Mask shadow pattern
IMX = -7.430423029095083E-01, IMY = 1.843573853546018E-02
Spacecraft aspect plot
Bright source in the pre-burst/pre-slew/post-slew images
Pre-burst image of 15-350 keV band
Time interval of the image:
-223.875410 -0.032000

# RAcent  DECcent POSerr Theta    Phi  PeakCts   SNR AngSep     Name
#  [deg]    [deg]    ['] [deg]  [deg]                   [']
254.2593  35.4597    0.0  31.3   -4.1  -0.1827  -1.0   12.0	Her X-1
268.3728  -1.4794   27.3  42.3  -70.0  -0.3276  -0.4    1.6	SW J1753.5-0127
288.8034  10.9475    1.0  23.5  -98.2   2.2623  12.1    0.3	GRS 1915+105
299.5954  35.2068    0.2   5.8  150.6   8.4280  57.0    0.4	Cyg X-1
308.1176  40.9471    1.2  14.0  129.1   1.6485   9.9    0.5	Cyg X-3
325.9302  38.3016    0.0  27.0  144.0   0.2889   1.4   11.4	Cyg X-2
308.0334  37.6509    2.3  13.0  142.6   0.7942   5.0 ------	UNKNOWN
253.5291  34.6955    2.4  32.0   -5.4   0.9066   4.7 ------	UNKNOWN
261.5087  13.7542    2.3  34.8  -46.0   1.1761   5.0 ------	UNKNOWN
319.2934 -11.9825    2.9  52.7 -141.1   3.4436   4.0 ------	UNKNOWN
Pre-slew background subtracted image of 15-350 keV band
Time interval of the image:
-0.032000 2.092000

# RAcent  DECcent POSerr Theta    Phi  PeakCts   SNR AngSep     Name
#  [deg]    [deg]    ['] [deg]  [deg]                   [']
254.4546  35.3423  125.4  31.2   -4.4  -0.0023  -0.1    0.1	Her X-1
268.3713  -1.6049    4.5  42.4  -70.1   0.2224   2.5    9.1	SW J1753.5-0127
288.9672  11.0551    7.5  23.4  -98.6  -0.0425  -1.5   11.9	GRS 1915+105
299.6674  35.0157   25.9   5.9  152.5  -0.0092  -0.4   11.8	Cyg X-1
308.0246  41.1546    0.0  14.0  128.2   0.0455   2.0   12.7	Cyg X-3
326.2491  38.1556    7.6  27.3  144.3  -0.0427  -1.5   10.6	Cyg X-2
311.9930  33.7512    2.5  16.1  158.6   0.0992   4.5 ------	UNKNOWN
341.8897   9.1392    2.4  51.6  179.5   0.3077   4.8 ------	UNKNOWN
328.7125  16.8912    0.2  36.6 -178.6   1.8183  60.6 ------	UNKNOWN
335.5700   5.0871    2.0  49.3 -171.2   0.2788   5.7 ------	UNKNOWN
260.3820  23.9530    2.0  29.8  -29.1   0.1423   5.9 ------	UNKNOWN
279.7984  19.8688    2.3  18.3  -66.0   0.1215   4.9 ------	UNKNOWN
227.4760  20.6360    2.7  58.4  -12.9   0.4406   4.3 ------	UNKNOWN
Post-slew image of 15-350 keV band
Time interval of the image:
71.524590 290.682800
292.224000 302.318300

# RAcent  DECcent POSerr Theta    Phi  PeakCts   SNR AngSep     Name
#  [deg]    [deg]    ['] [deg]  [deg]                   [']
288.8013  10.9748    2.0  39.1  -60.2   2.4122   5.9    1.8	GRS 1915+105
299.5908  35.2037    0.2  31.7  -15.9   8.7165  48.3    0.1	Cyg X-1
308.1094  40.9643    1.4  29.9    1.0   1.3731   8.0    0.7	Cyg X-3
326.3159  38.2764    3.8  21.5   28.1   0.4481   3.0    7.3	Cyg X-2
308.0424  20.2956    2.6  19.8  -43.8   0.7076   4.5 ------	UNKNOWN
347.0517 -39.9776    3.5  59.4 -163.1   4.8915   3.3 ------	UNKNOWN
311.0822  -3.7825    2.3  27.0 -105.2   1.0067   4.9 ------	UNKNOWN
265.3358  36.0675    2.3  58.8  -24.5   5.4058   5.0 ------	UNKNOWN
278.0306  16.0245    2.4  48.4  -50.2   3.5392   4.8 ------	UNKNOWN