Analysis Summary
Notes:
- 1) No attempt has been made to eliminate the non-significant decimal places.
- 2) This batgrbproduct analysis is done using the HEASARC data.
- 3) This batgrbproduct analysis is using the flight position for the mask-weighting calculation.
======================================================================
BAT GRB EVENT DATA PROCESSING REPORT
Process Script Ver: batgrbproduct v2.46
Process Start Time: Wed Jan 22 19:08:23 EST 2014
Host Name: batevent1
Current Working Dir: /local/data/batevent/batevent_reproc/trigger176453
======================================================================
Trigger: 00176453 Segment: 000
BAT Trigger Time: 158423952.704 [s; MET]
Trigger Stop: 158423953.728 [s; MET]
UTC: 2006-01-08T14:39:11.760360 [includes UTCF correction]
Where From?: TDRSS position message
BAT
RA: 146.991545670284 Dec: 31.9164170544607 [deg; J2000]
Catalogged Source?: NO
Point Source?: YES
GRB Indicated?: YES [ by BAT flight software ]
Image S/N Ratio: 8.51
Image Trigger?: NO
Rate S/N Ratio: 13.7477270848675 [ if not an image trigger ]
Image S/N Ratio: 8.51
Analysis Position: [ source = BAT ]
RA: 146.991545670284 Dec: 31.9164170544607 [deg; J2000]
Refined Position: [ source = BAT pre-slew burst ]
RA: 147.01909205963 Dec: 31.9313639482555 [deg; J2000]
{ 09h 48m 04.6s , +31d 55' 52.9" }
+/- 1.3376802573893 [arcmin] (estimated 90% radius based on SNR)
+/- 0.640649173699714 [arcmin] (formal 1-sigma fit error)
SNR: 20.0731287118385
Angular difference between the analysis and refined position is 1.664971 arcmin
Partial Coding Fraction: 1.015625 [ including projection effects ]
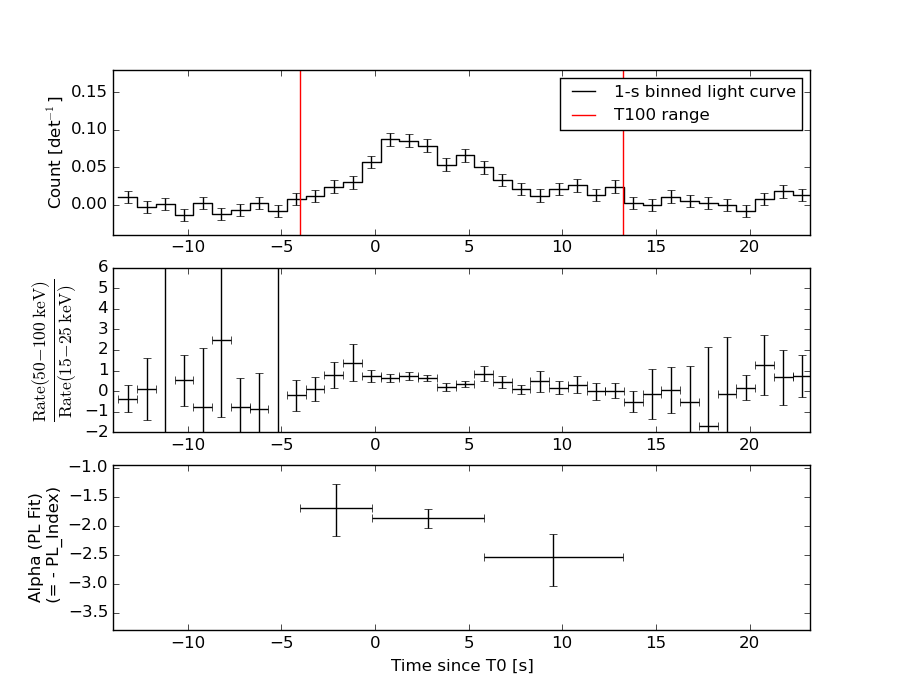
Duration
T90: 14.2200000286102 +/- 2.14442533480997
Measured from: -2.56000000238419
to: 11.660000026226 [s; relative to TRIGTIME]
T50: 4.9040000140667 +/- 0.840951826128777
Measured from: 0.780000001192093
to: 5.68400001525879 [s; relative to TRIGTIME]
Fluence
Peak Flux (peak 1 second)
Measured from: 0.604000002145767
to: 1.60400000214577 [s; relative to TRIGTIME]
Total Fluence
Measured from: -4.02399998903275
to: 13.2280000150204 [s; relative to TRIGTIME]
Band 1 Band 2 Band 3 Band 4
15-25 25-50 50-100 100-350 keV
Total 0.292122 0.249592 0.144702 0.028160
0.018911 0.019701 0.016855 0.013845 [error]
Peak 0.026406 0.042154 0.018874 0.011895
0.004786 0.005147 0.004299 0.003347 [error]
[ fluence units of on-axis counts / fully illuminated detector ]
======================================================================
====== Table of the duration information =============================
Value tstart tstop
T100 17.252 -4.024 13.228
T90 14.220 -2.560 11.660
T50 4.904 0.780 5.684
Peak 1.000 0.604 1.604
====== Spectral Analysis Summary =====================================
Model : spectral model: simple power-law (PL) and cutoff power-law (CPL)
Ph_index : photon index: E^{Ph_index}
Ph_90err : 90% error of the photon index
Epeak : Epeak in keV
Epeak_90err: 90% error of Epeak
Norm : normalization at 50 keV in both the PL model and CPL model
Nomr_90err : 90% error of the normalization
chi2 : Chi-Squared
dof : degree of freedo
=== Time-averaged spectral analysis ===
(Best model with acceptable fit: PL)
Model Ph_index Ph_90err_low Ph_90err_hi Epeak Epeak_90err_low Epeak_90err_hi Norm Nomr_90err_low Norm_90err_hi chi2 dof
PL -1.997 -0.168 0.161 - - - 2.34e-03 -2.47e-04 2.41e-04 49.820 57
CPL -2.006 -0.104 0.628 30.421 N/A N/A 2.31e-03 N/A N/A 49.820 56
=== 1-s peak spectral analysis ===
(Best model with acceptable fit: PL)
Model Ph_index Ph_90err_low Ph_90err_hi Epeak Epeak_90err_low Epeak_90err_hi Norm Nomr_90err_low Norm_90err_hi chi2 dof
PL -1.675 -0.265 0.254 - - - 5.69e-03 -9.87e-04 9.66e-04 52.620 57
CPL -0.543 -1.231 1.875 55.286 -14.226 -55.286 2.51e-02 -2.51e-02 2.76e-01 50.530 56
=== Fluence/Peak Flux Summary ===
Model Band1 Band2 Band3 Band4 Band5 Total
15-25 25-50 50-100 100-350 15-150 15-350 keV
Fluence PL 8.23e-08 1.12e-07 1.12e-07 2.03e-07 3.72e-07 5.09e-07 erg/cm2
90%_error_low -9.80e-09 -9.09e-09 -1.63e-08 -5.40e-08 -3.65e-08 -7.23e-08 erg/cm2
90%_error_hi 1.01e-08 9.09e-09 1.66e-08 6.59e-08 3.72e-08 8.15e-08 erg/cm2
Peak flux PL 2.77e-01 2.51e-01 1.57e-01 1.50e-01 7.49e-01 8.36e-01 ph/cm2/s
90%_error_low -6.19e-02 -3.89e-02 -3.46e-02 -5.55e-02 -1.15e-01 -1.32e-01 ph/cm2/s
90%_error_hi 6.46e-02 3.88e-02 3.46e-02 7.20e-02 1.15e-01 1.33e-01 ph/cm2/s
Fluence CPL 8.24e-08 1.12e-07 1.12e-07 2.07e-07 3.72e-07 5.13e-07 erg/cm2
90%_error_low -9.32e-09 -1.91e-08 -1.60e-08 -1.28e-07 -4.32e-08 -1.48e-07 erg/cm2
90%_error_hi 1.05e-08 1.19e-08 1.31e-08 1.81e-07 3.78e-08 9.01e-08 erg/cm2
Peak flux CPL 2.48e-01 2.88e-01 1.58e-01 4.02e-02 7.25e-01 7.34e-01 ph/cm2/s
90%_error_low -7.43e-02 -5.75e-02 -4.54e-02 -4.02e-02 -1.19e-01 -1.26e-01 ph/cm2/s
90%_error_hi 7.40e-02 6.17e-02 4.06e-02 1.31e-01 1.19e-01 1.66e-01 ph/cm2/s
======================================================================
Image
Pre-slew 15.0-350.0 keV image (Event data)
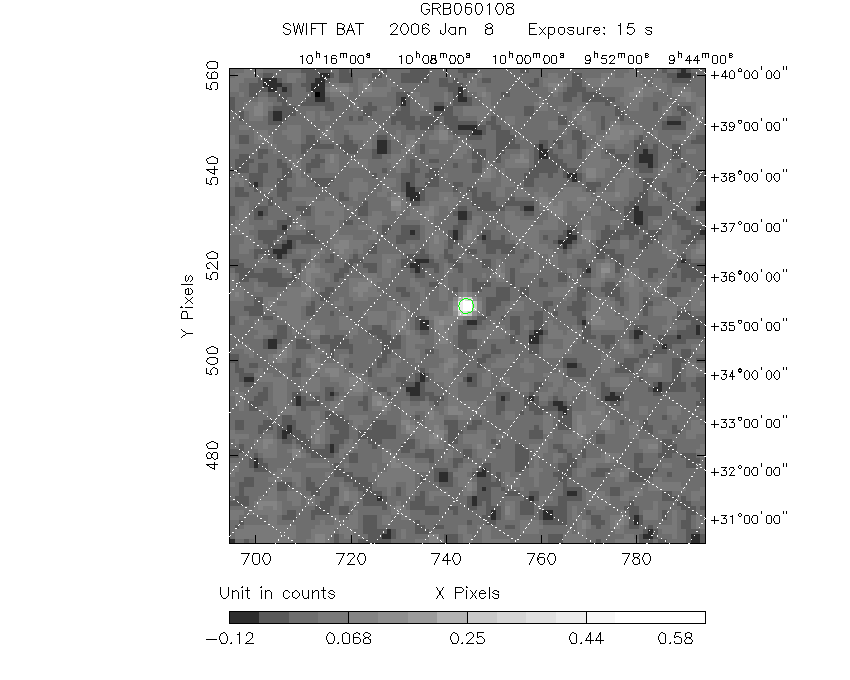
#   RAcent    DECcent   POSerr    Theta     Phi              Peak Cts       SNR   Name
  147.0191    31.9314   0.0095    16.3729   -14.4375         0.7151399     20.073 TRIG_00176453

Foreground time interval of the image:
 -4.024  11.197 (delta_t =  15.221 [sec])
Background time interval of the image:
-299.704  -4.024 (delta_t = 295.680 [sec])
Light Curves
Note: The mask-weighted lightcurves have units of either count/det or counts/sec/det, where a det is 0.4 x 0.4 = 0.16 sq cm.
Full-time range; 1 s binning
Other quick-look light curves:
- 64 ms binning (zoomed)
- 16 ms binning (zoomed)
- 8 ms binning (zoomed)
- 2 ms binning (zoomed)
- SN=5 or 10 s binning (full-time range)
- Raw light curve
Spectra
- 64 ms binning (zoomed)
- 16 ms binning (zoomed)
- 8 ms binning (zoomed)
- 2 ms binning (zoomed)
- SN=5 or 10 s binning (full-time range)
- Raw light curve
Spectra
Notes:
- 1) The fitting includes the systematic errors.
- 2) When the burst includes telescope slew time periods, the fitting uses an average response file made from multiple 5-s response files through out the slew time plus single time preiod for the non-slew times, and weighted by the total counts in the corresponding time period using addrmf. An average response file is needed becuase a spectral fit using the pre-slew DRM will introduce some errors in both a spectral shape and a normalization if the PHA file contains a lot of the slew/post-slew time interval.
- 3) For fits to more complicated models (e.g. a power-law over a cutoff power-law), the BAT team has decided to require a chi-square improvement of more than 6 for each extra dof.
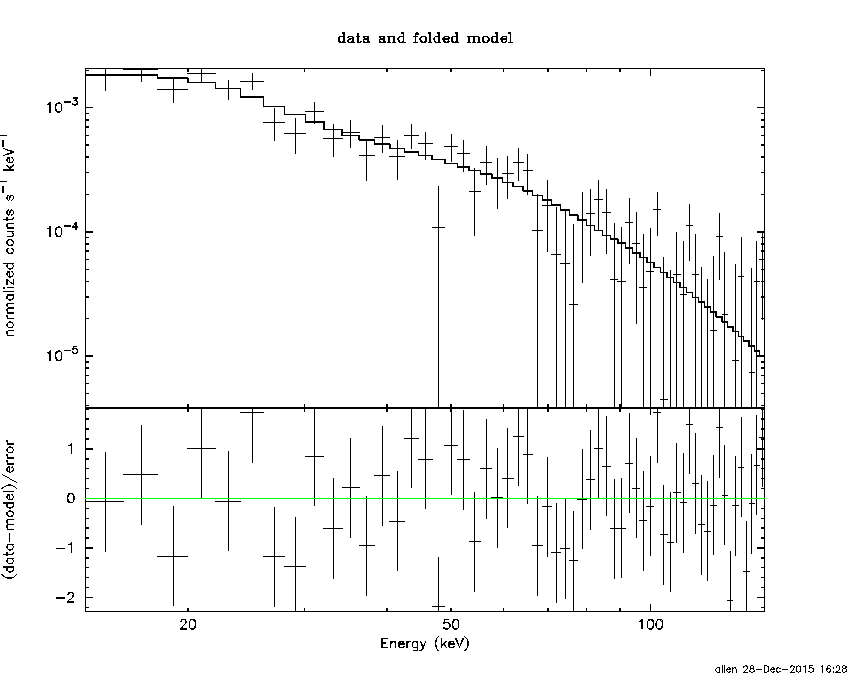
Time averaged spectrum fit using the average DRM
Power-law model

Time interval is from   -4.024 sec. to   13.228 sec.

Spectral model in power-law:
------------------------------------------------------------
Parameters  : value       lower 90%   higher 90%
Photon index: -1.99738     ( -0.168319   0.161021 )
Norm@50keV  : 2.33748E-03    ( -0.000246744   0.000241177 )
------------------------------------------------------------
#Fit statistic : Chi-Squared =          49.82 using 59 PHA bins.
# Reduced chi-squared =         0.8740 for     57 degrees of freedom
# Null hypothesis probability =   7.388576e-01

Photon flux (15-150 keV)    in 17.25 sec: 0.350226 ( -0.028502  0.028518 ) ph/cm2/s
Energy fluence (15-150 keV)             : 3.71851e-07 ( -3.64853e-08  3.71824e-08 ) ergs/cm2
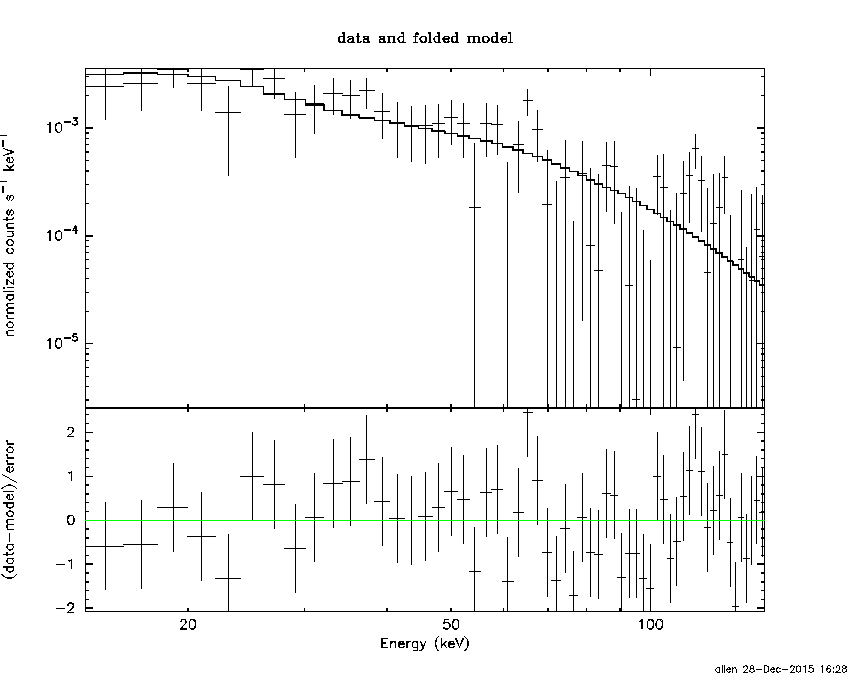
Cutoff power-law model
Time interval is from   -4.024 sec. to   13.228 sec.
Spectral model in the cutoff power-law:
------------------------------------------------------------
Parameters  : value       lower 90%   higher 90%
Photon index: -2.00632     ( -0.10405   0.627948 )
Epeak [keV] : 30.4214      (   )
Norm@50keV  : 2.31060E-03    (     )
------------------------------------------------------------
#Fit statistic : Chi-Squared =          49.82 using 59 PHA bins.
# Reduced chi-squared =         0.8896 for     56 degrees of freedom
# Null hypothesis probability =   7.065648e-01

Photon flux (15-150 keV)    in 17.25 sec: 0.350377 ( -0.028415  0.029231 ) ph/cm2/s
Energy fluence (15-150 keV)             : 3.72227e-07 ( -4.32175e-08  3.77587e-08 ) ergs/cm2
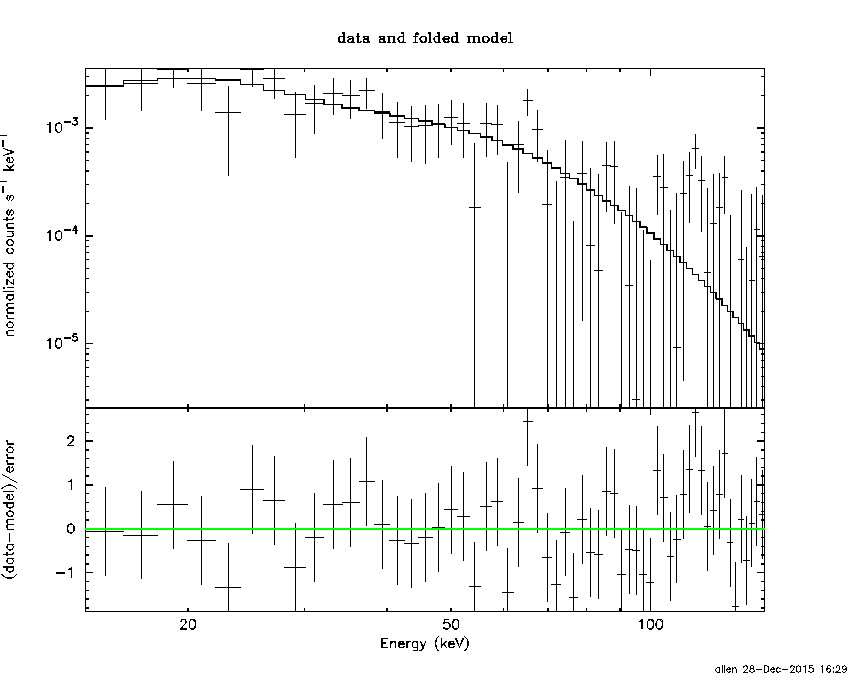
1-s peak spectrum fit
Power-law model
Time interval is from    0.604 sec. to    1.604 sec.

Spectral model in power-law:
------------------------------------------------------------
Parameters  : value       lower 90%   higher 90%
Photon index: -1.6755     ( -0.265274   0.253541 )
Norm@50keV  : 5.68579E-03    ( -0.000986892   0.000965753 )
------------------------------------------------------------
#Fit statistic : Chi-Squared =          52.62 using 59 PHA bins.
# Reduced chi-squared =         0.9231 for     57 degrees of freedom
# Null hypothesis probability =   6.400871e-01

Photon flux (15-150 keV)    in 1 sec: 0.748818 ( -0.115039  0.115059 ) ph/cm2/s
Energy fluence (15-150 keV)             : 5.27594e-08 ( -9.52693e-09  9.73052e-09 ) ergs/cm2
Cutoff power-law model
Time interval is from    0.604 sec. to    1.604 sec.
Spectral model in the cutoff power-law:
------------------------------------------------------------
Parameters  : value       lower 90%   higher 90%
Photon index: -0.542794     ( -1.23114   1.87423 )
Epeak [keV] : 55.2864      ( -14.214 -55.2744 )
Norm@50keV  : 2.50591E-02    ( -0.0250907   0.275674 )
------------------------------------------------------------
#Fit statistic : Chi-Squared =          50.53 using 59 PHA bins.
# Reduced chi-squared =         0.9023 for     56 degrees of freedom
# Null hypothesis probability =   6.812574e-01

Photon flux (15-150 keV)    in 1 sec: 0.724853 ( -0.119305  0.119083 ) ph/cm2/s
Energy fluence (15-150 keV)             : 4.73031e-08 ( -1.04274e-08  1.1588e-08 ) ergs/cm2
Time-resolved spectra
Distribution
T90 vs. Hardness ratio plot
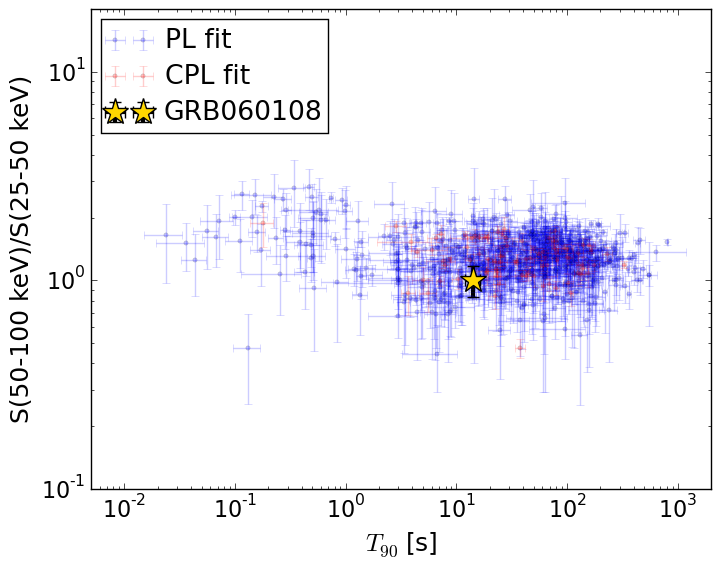
T90                                   = 14.22 sec.
Hardness ratio (energy fluence ratio) = 1.00186681592
S(15-50 keV) vs. S(50-150 keV) plot
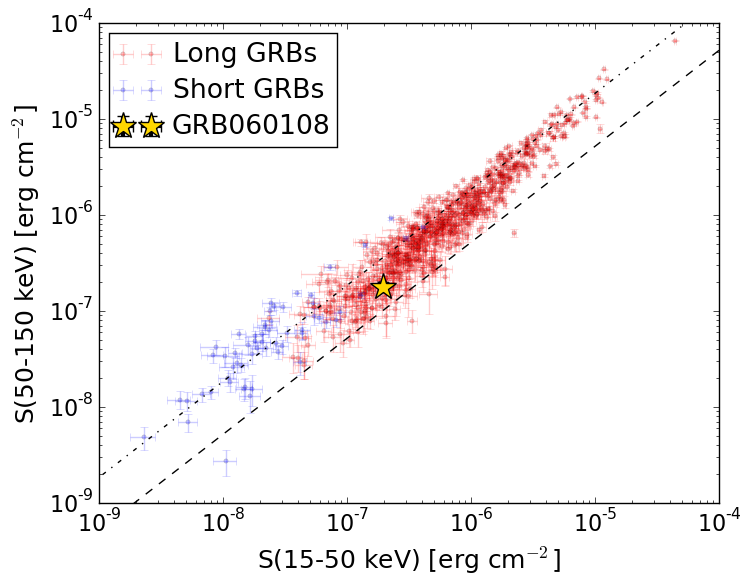
S(15-50 keV)  = 1.9415375e-07
S(50-150 keV) = 1.776986e-07
The dash-dotted line and the dashed line traces the fluences calculated from the Band function with Epeak = 15 and 150 keV, respectively. Both lines assume a canonical values of alpha = -1 and beta = -2.5.
Mask shadow pattern
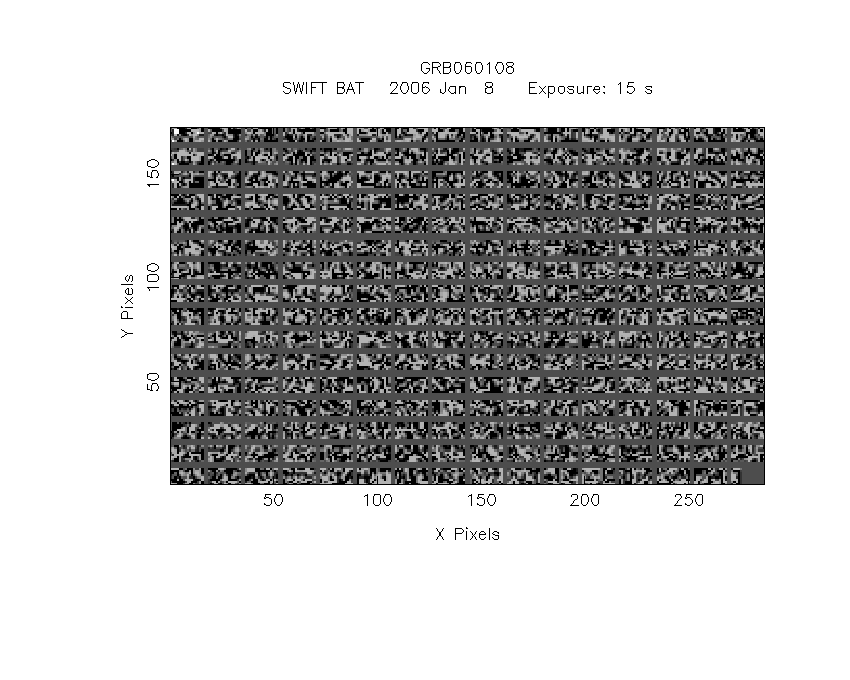
IMX = 2.845244767049336E-01, IMY = 7.325220387693542E-02
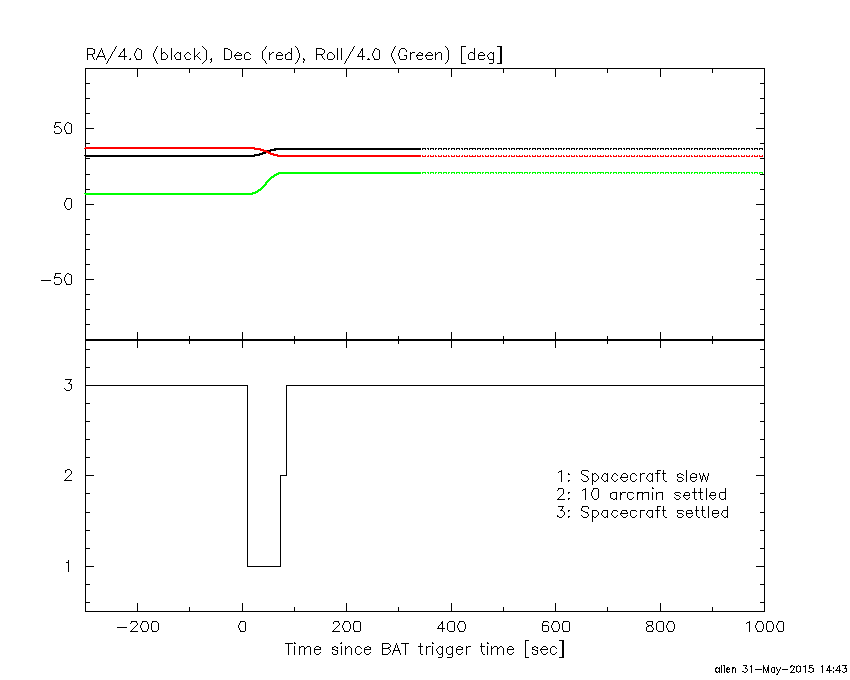
Spacecraft aspect plot
Bright source in the pre-burst/pre-slew/post-slew images
Pre-burst image of 15-350 keV band
Time interval of the image:
-299.704000 -4.024000

# RAcent  DECcent POSerr Theta    Phi  PeakCts   SNR AngSep     Name
#  [deg]    [deg]    ['] [deg]  [deg]                   [']
 83.6330  22.0156    0.4  41.1  144.0  12.2611  25.9    0.1	Crab
191.6780  34.3330    2.7  50.7  -44.4   4.1510   4.3 ------	UNKNOWN
187.3989  50.1064    3.0  43.6  -64.2   3.7623   3.8 ------	UNKNOWN
145.7057  79.6174    3.0  43.1 -112.7   3.2062   3.8 ------	UNKNOWN
Pre-slew background subtracted image of 15-350 keV band
Time interval of the image:
-4.024000 11.196590

# RAcent  DECcent POSerr Theta    Phi  PeakCts   SNR AngSep     Name
#  [deg]    [deg]    ['] [deg]  [deg]                   [']
 83.5200  21.9072    5.4  41.2  143.9   0.1685   2.1    9.0	Crab
147.0191  31.9313    0.6  16.4  -14.4   0.7150  20.0 ------	UNKNOWN
 46.9241  46.8349    2.5  58.4 -169.8   0.8768   4.6 ------	UNKNOWN
188.7064  45.7971    2.3  45.1  -58.3   0.7435   5.0 ------	UNKNOWN
Post-slew image of 15-350 keV band
Time interval of the image:
73.196600 302.352300

# RAcent  DECcent POSerr Theta    Phi  PeakCts   SNR AngSep     Name
#  [deg]    [deg]    ['] [deg]  [deg]                   [']
 82.1988  69.2800    3.1  51.5  162.9   2.0762   3.8 ------	UNKNOWN
135.3167  44.4224    3.1  15.5  154.3   0.5087   3.7 ------	UNKNOWN
164.0628  -1.3341    2.5  36.9  -22.3   0.8323   4.7 ------	UNKNOWN
244.3148  84.1193    2.9  59.1 -166.2   4.2010   4.0 ------	UNKNOWN
170.7315 -18.0851    2.9  54.9  -20.9   1.8920   4.0 ------	UNKNOWN
198.0841  62.5382    3.1  44.4 -142.1   1.1169   3.7 ------	UNKNOWN
184.3662  -4.2649    3.0  50.7  -44.5   3.0870   3.9 ------	UNKNOWN
192.7812  23.7254    2.8  41.0  -83.4   2.8509   4.1 ------	UNKNOWN