Analysis Summary
Notes:
- 1) No attempt has been made to eliminate the non-significant decimal places.
- 2) This batgrbproduct analysis is done using the HEASARC data.
- 3) This batgrbproduct analysis is using the flight position for the mask-weighting calculation.
======================================================================
                  BAT GRB EVENT DATA PROCESSING REPORT
    Process Script Ver: batgrbproduct v2.46
    Process Start Time: Wed Jan 22 19:02:42 EST 2014
             Host Name: batevent1
   Current Working Dir: /local/data/batevent/batevent_reproc/trigger176702
======================================================================

  Trigger: 00176702      Segment: 000

  BAT Trigger Time: 158572878.72   [s; MET]
      Trigger Stop: 158572879.232   [s; MET]
               UTC: 2006-01-10T08:01:17.773060    [includes UTCF correction]
       Where From?: TDRSS position message

  BAT
    RA: 72.740721621106   Dec: 28.3800293891184  [deg; J2000]

     Catalogged Source?: NO
     Point Source?:      YES
     GRB Indicated?:     YES    [ by BAT flight software ]
     Image S/N Ratio:    7.92
     Image Trigger?:     NO
     Rate S/N Ratio:     18.5202591774521  [ if not an image trigger ]
     Image S/N Ratio:    7.92

  Analysis Position:   [ source = BAT ]
    RA: 72.740721621106   Dec: 28.3800293891184  [deg; J2000]

  Refined Position:   [ source = BAT pre-slew burst ]
    RA: 72.7386578133127   Dec: 28.4285627643664  [deg; J2000]
        { 04h 50m 57.3s , +28d 25' 42.8" }
         +/- 0.737448770678398 [arcmin] (estimated 90% radius based on SNR)
         +/- 0.238758501584685 [arcmin] (formal 1-sigma fit error)
    SNR: 46.9972960001081

  Angular difference between the analysis and refined position is 2.914039 arcmin

  Partial Coding Fraction: 0.921875    [ including projection effects ]

  Duration
     T90: 21.33599999547 +/- 2.04848920027237
        Measured from: 0.272000014781952
                   to: 21.608000010252     [s; relative to TRIGTIME]
     T50: 7.74400001764297 +/- 0.746726173608233
        Measured from: 2.71999999880791
                   to: 10.4640000164509     [s; relative to TRIGTIME]


  Fluence
     Peak Flux  (peak 1 second)
        Measured from: 1.21999999880791
                   to: 2.21999999880791     [s; relative to TRIGTIME]
     Total Fluence
        Measured from: -1.56400001049042
                   to: 26.5879999995232     [s; relative to TRIGTIME]

             Band 1     Band 2     Band 3     Band 4
              15-25      25-50     50-100    100-350     keV
 Total     0.788194   0.910125   0.676515   0.150426
           0.028603   0.029857   0.025933   0.021294 [error]
 Peak      0.055383   0.093891   0.079826   0.005713
           0.005923   0.006409   0.005916   0.004569 [error]

     [ fluence units of on-axis counts / fully illuminated detector ]

======================================================================


====== Table of the duration information =============================

        Value   tstart    tstop
T100   28.152   -1.564   26.588
T90    21.336    0.272   21.608
T50     7.744    2.720   10.464
Peak    1.000    1.220    2.220


====== Spectral Analysis Summary =====================================

Model      : spectral model: simple power-law (PL) and cutoff power-law (CPL)
Ph_index   : photon index: E^{Ph_index}
Ph_90err   : 90% error of the photon index
Epeak      : Epeak in keV
Epeak_90err: 90% error of Epeak
Norm       : normalization at 50 keV in both the PL model and CPL model
Nomr_90err : 90% error of the normalization
chi2       : Chi-Squared
dof        : degree of freedo

=== Time-averaged spectral analysis ===
(Best model with acceptable fit: PL)

Model Ph_index Ph_90err_low Ph_90err_hi  Epeak  Epeak_90err_low  Epeak_90err_hi  Norm       Nomr_90err_low    Norm_90err_hi    chi2    dof
PL      -1.635    -0.074      0.074       -           -               -         5.72e-03     -2.23e-04          2.22e-04      37.370   57
CPL     -1.592    -0.113      0.247      491.385    -491.375      -491.385      6.00e-03     -4.89e-04          1.81e-03      37.430   56


=== 1-s peak spectral analysis ===
(Best model with acceptable fit: CPL)

Model Ph_index Ph_90err_low Ph_90err_hi  Epeak  Epeak_90err_low  Epeak_90err_hi  Norm       Nomr_90err_low    Norm_90err_hi    chi2    dof
PL      -1.333     -0.125     0.125       -           -               -         1.62e-02     -1.26e-03          1.26e-03      69.170   57
CPL     -0.257     -0.553     0.636       81.998     -14.488        34.696      5.57e-02     -2.57e-02          5.74e-02      56.770   56


=== Fluence/Peak Flux Summary ===

              Model    Band1     Band2     Band3     Band4     Band5     Total
                       15-25     25-50    50-100    100-350    15-150    15-350    keV
Fluence         PL   2.33e-07  3.95e-07  5.09e-07  1.32e-06  1.50e-06  2.46e-06   erg/cm2
      90%_error_low -1.65e-08 -1.62e-08 -2.64e-08 -1.47e-07 -6.20e-08 -1.65e-07   erg/cm2
      90%_error_hi   1.69e-08  1.62e-08  2.63e-08  1.60e-07  6.22e-08  1.75e-07   erg/cm2
Peak flux       PL   5.66e-01  6.30e-01  5.00e-01  6.57e-01  1.94e+00  2.35e+00   ph/cm2/s
      90%_error_low -7.41e-02 -5.35e-02 -4.65e-02 -1.15e-01 -1.52e-01 -1.89e-01   ph/cm2/s
      90%_error_hi   7.70e-02  5.32e-02  4.63e-02  1.29e-01  1.53e-01  1.90e-01   ph/cm2/s

Fluence        CPL   2.33e-07  3.95e-07  5.09e-07  1.31e-06  1.50e-06  2.41e-06   erg/cm2
      90%_error_low -2.09e-08 -1.61e-08 -2.49e-08 -4.45e-07 -7.03e-08 -4.12e-07   erg/cm2
      90%_error_hi   1.26e-08  1.82e-08  2.77e-08  9.98e-08  6.17e-08  2.09e-07   erg/cm2
Peak flux      CPL   4.64e-01  6.93e-01  5.45e-01  2.39e-01  1.87e+00  1.94e+00   ph/cm2/s
      90%_error_low -8.81e-02 -6.49e-02 -5.51e-02 -9.28e-02 -1.57e-01 -1.84e-01   ph/cm2/s
      90%_error_hi   9.10e-02  6.64e-02  5.60e-02  1.48e-01  1.57e-01  2.05e-01   ph/cm2/s

======================================================================
Image
Pre-slew 15.0-350.0 keV image (Event data)
#   RAcent    DECcent   POSerr    Theta     Phi              Peak Cts       SNR   Name
   72.7387    28.4286   0.0041    24.1119  -177.4841         2.7492266     46.997 TRIG_00176702

Foreground time interval of the image:
 -1.564  26.588 (delta_t =  28.152 [sec])
Background time interval of the image:
-299.720 -20.391 (delta_t = 279.329 [sec])
-19.720  -1.564 (delta_t =  18.156 [sec])
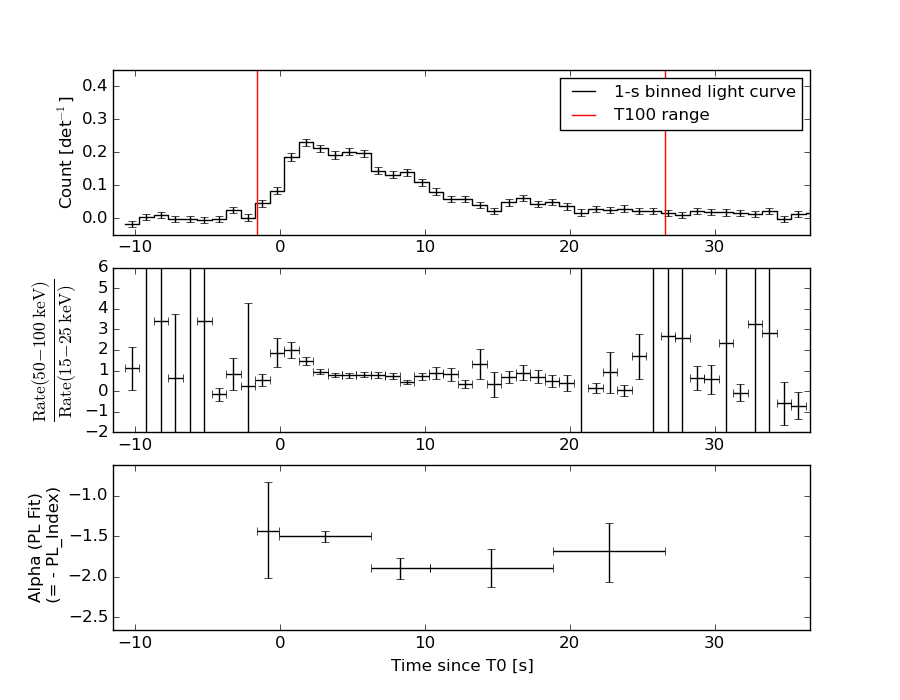
Light Curves
Note: The mask-weighted lightcurves have units of either count/det or counts/sec/det, where a det is 0.4 x 0.4 = 0.16 sq cm.
Full-time range; 1 s binning
Other quick-look light curves:
- 64 ms binning (zoomed)
- 16 ms binning (zoomed)
- 8 ms binning (zoomed)
- 2 ms binning (zoomed)
- SN=5 or 10 s binning (full-time range)
- Raw light curve
Spectra
- 64 ms binning (zoomed)
- 16 ms binning (zoomed)
- 8 ms binning (zoomed)
- 2 ms binning (zoomed)
- SN=5 or 10 s binning (full-time range)
- Raw light curve
Spectra
Notes:
- 1) The fitting includes the systematic errors.
- 2) When the burst includes telescope slew time periods, the fitting uses an average response file made from multiple 5-s response files through out the slew time plus single time preiod for the non-slew times, and weighted by the total counts in the corresponding time period using addrmf. An average response file is needed becuase a spectral fit using the pre-slew DRM will introduce some errors in both a spectral shape and a normalization if the PHA file contains a lot of the slew/post-slew time interval.
- 3) For fits to more complicated models (e.g. a power-law over a cutoff power-law), the BAT team has decided to require a chi-square improvement of more than 6 for each extra dof.
Time averaged spectrum fit using the average DRM
Power-law model

Time interval is from   -1.564 sec. to   26.588 sec.

Spectral model in power-law:
------------------------------------------------------------
Parameters  : value       lower 90%   higher 90%
Photon index: -1.63491     ( -0.0741497   0.0737026 )
Norm@50keV  : 5.72016E-03    ( -0.00022302   0.000222264 )
------------------------------------------------------------
#Fit statistic : Chi-Squared =          37.37 using 59 PHA bins.
# Reduced chi-squared =         0.6557 for     57 degrees of freedom
# Null hypothesis probability =   9.793692e-01

Photon flux (15-150 keV)    in 28.15 sec: 0.743267 ( -0.030291  0.030423 ) ph/cm2/s
Energy fluence (15-150 keV)             : 1.50013e-06 ( -6.19635e-08  6.21867e-08 ) ergs/cm2
Cutoff power-law model
Time interval is from   -1.564 sec. to   26.588 sec.
Spectral model in the cutoff power-law:
------------------------------------------------------------
Parameters  : value       lower 90%   higher 90%
Photon index: -1.63301     ( -0.109799   0.250168 )
Epeak [keV] : 9996.98      ( -9996.9 -9996.91 )
Norm@50keV  : 5.73271E-03    ( -0.000218944   0.00207839 )
------------------------------------------------------------
#Fit statistic : Chi-Squared =          37.37 using 59 PHA bins.
# Reduced chi-squared =         0.6674 for     56 degrees of freedom
# Null hypothesis probability =   9.738053e-01

Photon flux (15-150 keV)    in 28.15 sec: 0.743099 ( -0.033537  0.030201 ) ph/cm2/s
Energy fluence (15-150 keV)             : 1.49989e-06 ( -7.02728e-08  6.16736e-08 ) ergs/cm2
1-s peak spectrum fit
Power-law model
Time interval is from    1.220 sec. to    2.220 sec.

Spectral model in power-law:
------------------------------------------------------------
Parameters  : value       lower 90%   higher 90%
Photon index: -1.33251     ( -0.124822   0.125005 )
Norm@50keV  : 1.61510E-02    ( -0.0012591   0.00125779 )
------------------------------------------------------------
#Fit statistic : Chi-Squared =          69.17 using 59 PHA bins.
# Reduced chi-squared =          1.214 for     57 degrees of freedom
# Null hypothesis probability =   1.294174e-01

Photon flux (15-150 keV)    in 1 sec: 1.93891 ( -0.15239  0.15253 ) ph/cm2/s
Energy fluence (15-150 keV)             : 1.58391e-07 ( -1.36305e-08  1.37364e-08 ) ergs/cm2
Cutoff power-law model
Time interval is from    1.220 sec. to    2.220 sec.
Spectral model in the cutoff power-law:
------------------------------------------------------------
Parameters  : value       lower 90%   higher 90%
Photon index: -0.256594     ( -0.553008   0.635662 )
Epeak [keV] : 81.9978      ( -14.4884 34.696 )
Norm@50keV  : 5.56859E-02    ( -0.0256913   0.0573806 )
------------------------------------------------------------
#Fit statistic : Chi-Squared =          56.77 using 59 PHA bins.
# Reduced chi-squared =          1.014 for     56 degrees of freedom
# Null hypothesis probability =   4.461748e-01

Photon flux (15-150 keV)    in 1 sec: 1.86555 ( -0.15706  0.15708 ) ph/cm2/s
Energy fluence (15-150 keV)             : 1.47258e-07 ( -1.47293e-08  1.49081e-08 ) ergs/cm2
Time-resolved spectra
Distribution
T90 vs. Hardness ratio plot
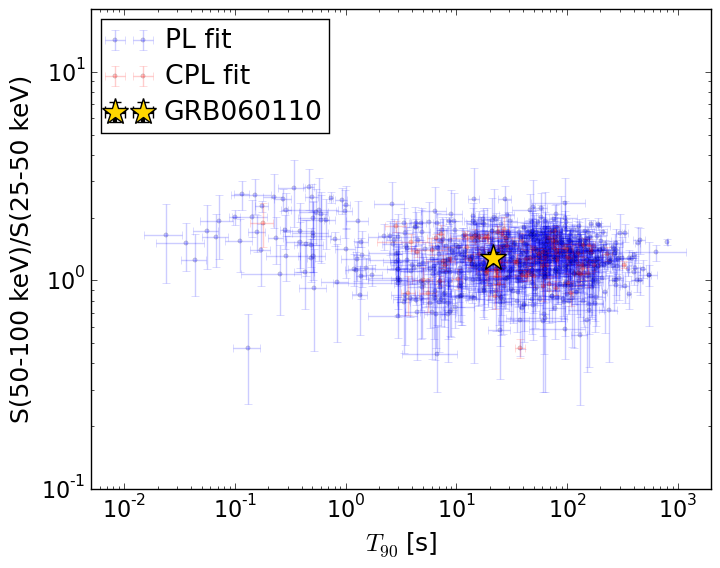
T90                                   = 21.336 sec.
Hardness ratio (energy fluence ratio) = 1.28798244786
S(15-50 keV) vs. S(50-150 keV) plot
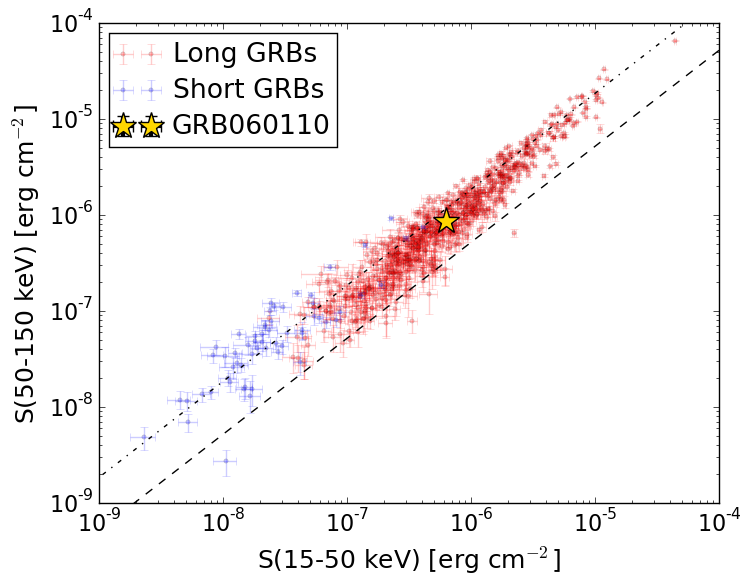
S(15-50 keV)  = 6.28371e-07
S(50-150 keV) = 8.717579e-07
The dash-dotted line and the dashed line traces the fluences calculated from the Band function with Epeak = 15 and 150 keV, respectively. Both lines assume a canonical values of alpha = -1 and beta = -2.5.
Mask shadow pattern
IMX = -4.471397921066536E-01, IMY = 1.964669167818170E-02
Spacecraft aspect plot
Bright source in the pre-burst/pre-slew/post-slew images
Pre-burst image of 15-350 keV band
Time interval of the image:
-299.720000 -20.391000
-19.720000 -1.564000

# RAcent  DECcent POSerr Theta    Phi  PeakCts   SNR AngSep     Name
#  [deg]    [deg]    ['] [deg]  [deg]                   [']
 83.6286  22.0164    0.2  18.4  153.7  13.0136  58.4    0.3	Crab
110.0523  -4.9716    2.6  39.0   80.4   3.4005   4.5 ------	UNKNOWN
 48.7583   8.1977    3.3  53.6  170.4   2.9568   3.5 ------	UNKNOWN
147.4127  32.8567    2.6  39.2   -7.3   1.3145   4.5 ------	UNKNOWN
130.2696  68.3913    3.2  39.3  -67.3   2.1264   3.6 ------	UNKNOWN
167.6182  57.5601    3.1  50.7  -44.4   5.2345   3.7 ------	UNKNOWN
 48.3630  62.2864    2.8  43.8 -116.1   4.4785   4.2 ------	UNKNOWN
 66.9471  69.8570    2.2  41.3 -100.8   5.8575   5.3 ------	UNKNOWN
Pre-slew background subtracted image of 15-350 keV band
Time interval of the image:
-1.564000 26.588000

# RAcent  DECcent POSerr Theta    Phi  PeakCts   SNR AngSep     Name
#  [deg]    [deg]    ['] [deg]  [deg]                   [']
 83.4930  22.1230    4.1  18.4  154.2  -0.1618  -2.8   10.2	Crab
141.5631   2.6136    1.9  49.0   35.2   1.6786   6.1 ------	UNKNOWN
107.0108  14.7827    2.0  19.1   75.9   0.3680   5.8 ------	UNKNOWN
138.0651  22.5823    2.4  34.7   13.4   0.3613   4.8 ------	UNKNOWN
 72.7387  28.4286    0.2  24.1 -177.5   2.7493  47.0 ------	UNKNOWN
107.4211  38.2186    2.3   7.8  -38.8   0.2549   5.0 ------	UNKNOWN
 98.0203  41.1371    3.0   8.4  -96.3   0.2021   3.9 ------	UNKNOWN
 59.6586  67.5792    2.3  41.8 -106.0   1.1995   5.1 ------	UNKNOWN
Post-slew image of 15-350 keV band
Time interval of the image:
117.980600 302.362400

# RAcent  DECcent POSerr Theta    Phi  PeakCts   SNR AngSep     Name
#  [deg]    [deg]    ['] [deg]  [deg]                   [']
127.9704   1.8201    2.9  35.0   58.4   1.0373   4.0 ------	UNKNOWN
184.9147  -2.4513    2.5  49.7  -29.8   1.5411   4.6 ------	UNKNOWN