Analysis Summary
Notes:
- 1) No attempt has been made to eliminate the non-significant decimal places.
- 2) This batgrbproduct analysis is done using the HEASARC data.
- 3) This batgrbproduct analysis is using the flight position for the mask-weighting calculation.
======================================================================
BAT GRB EVENT DATA PROCESSING REPORT
Process Script Ver: batgrbproduct v2.46
Process Start Time: Wed Jan 22 19:00:01 EST 2014
Host Name: batevent1
Current Working Dir: /local/data/batevent/batevent_reproc/trigger176818
======================================================================
Trigger: 00176818 Segment: 000
BAT Trigger Time: 158646187.072 [s; MET]
Trigger Stop: 158646187.584 [s; MET]
UTC: 2006-01-11T04:23:06.123420 [includes UTCF correction]
Where From?: TDRSS position message
BAT
RA: 276.212529459245 Dec: 37.6021981979871 [deg; J2000]
Catalogged Source?: NO
Point Source?: YES
GRB Indicated?: YES [ by BAT flight software ]
Image S/N Ratio: 7.47
Image Trigger?: NO
Rate S/N Ratio: 13.490737563232 [ if not an image trigger ]
Image S/N Ratio: 7.47
Analysis Position: [ source = BAT ]
RA: 276.212529459245 Dec: 37.6021981979871 [deg; J2000]
Refined Position: [ source = BAT pre-slew burst ]
RA: 276.195122916218 Dec: 37.6025187890992 [deg; J2000]
{ 18h 24m 46.8s , +37d 36' 09.1" }
+/- 0.745420441804269 [arcmin] (estimated 90% radius based on SNR)
+/- 0.175819634076369 [arcmin] (formal 1-sigma fit error)
SNR: 46.2809472804975
Angular difference between the analysis and refined position is 0.827659 arcmin
Partial Coding Fraction: 0.9765625 [ including projection effects ]
Duration
T90: 13.2120000123978 +/- 1.16562085145432
Measured from: 0.416000008583069
to: 13.6280000209808 [s; relative to TRIGTIME]
T50: 5.8759999871254 +/- 0.370621123835605
Measured from: 3.09600001573563
to: 8.97200000286102 [s; relative to TRIGTIME]
Fluence
Peak Flux (peak 1 second)
Measured from: 4.3120000064373
to: 5.3120000064373 [s; relative to TRIGTIME]
Total Fluence
Measured from: -0.65200001001358
to: 17.5760000050068 [s; relative to TRIGTIME]
Band 1 Band 2 Band 3 Band 4
15-25 25-50 50-100 100-350 keV
Total 0.580907 0.862868 0.572613 0.085311
0.022678 0.024311 0.021082 0.017420 [error]
Peak 0.047394 0.088599 0.067138 0.015762
0.005592 0.006138 0.005385 0.004256 [error]
[ fluence units of on-axis counts / fully illuminated detector ]
======================================================================
====== Table of the duration information =============================
Value tstart tstop
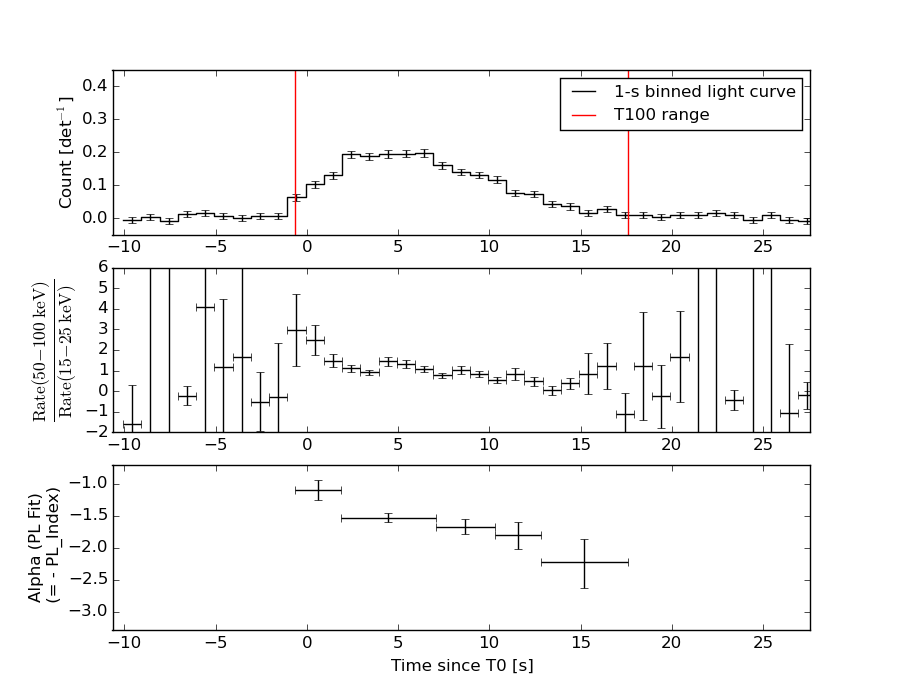
T100 18.228 -0.652 17.576
T90 13.212 0.416 13.628
T50 5.876 3.096 8.972
Peak 1.000 4.312 5.312
====== Spectral Analysis Summary =====================================
Model : spectral model: simple power-law (PL) and cutoff power-law (CPL)
Ph_index : photon index: E^{Ph_index}
Ph_90err : 90% error of the photon index
Epeak : Epeak in keV
Epeak_90err: 90% error of Epeak
Norm : normalization at 50 keV in both the PL model and CPL model
Nomr_90err : 90% error of the normalization
chi2 : Chi-Squared
dof : degree of freedo
=== Time-averaged spectral analysis ===
(Best model with acceptable fit: CPL)
Model Ph_index Ph_90err_low Ph_90err_hi Epeak Epeak_90err_low Epeak_90err_hi Norm Nomr_90err_low Norm_90err_hi chi2 dof
PL -1.621 -0.065 0.064 - - - 7.50e-03 -2.77e-04 2.77e-04 63.410 57
CPL -0.882 -0.283 0.302 73.880 -9.112 16.935 1.78e-02 -4.91e-03 7.38e-03 41.340 56
=== 1-s peak spectral analysis ===
(Best model with acceptable fit: CPL)
Model Ph_index Ph_90err_low Ph_90err_hi Epeak Epeak_90err_low Epeak_90err_hi Norm Nomr_90err_low Norm_90err_hi chi2 dof
PL -1.375 -0.130 0.130 - - - 1.46e-02 -1.16e-03 1.16e-03 53.850 57
CPL -0.522 -0.570 0.662 86.007 -18.969 71.903 3.96e-02 -1.90e-02 4.49e-02 46.900 56
=== Fluence/Peak Flux Summary ===
Model Band1 Band2 Band3 Band4 Band5 Total
15-25 25-50 50-100 100-350 15-150 15-350 keV
Fluence PL 1.96e-07 3.34e-07 4.34e-07 1.14e-06 1.28e-06 2.11e-06 erg/cm2
90%_error_low -1.21e-08 -1.26e-08 -2.11e-08 -1.15e-07 -5.02e-08 -1.32e-07 erg/cm2
90%_error_hi 1.23e-08 1.26e-08 2.11e-08 1.23e-07 5.04e-08 1.38e-07 erg/cm2
Peak flux PL 5.32e-01 5.77e-01 4.44e-01 5.61e-01 1.76e+00 2.11e+00 ph/cm2/s
90%_error_low -7.01e-02 -4.90e-02 -4.34e-02 -1.03e-01 -1.40e-01 -1.72e-01 ph/cm2/s
90%_error_hi 7.28e-02 4.87e-02 4.31e-02 1.17e-01 1.40e-01 1.74e-01 ph/cm2/s
Fluence CPL 1.72e-07 3.57e-07 4.46e-07 4.22e-07 1.20e-06 1.40e-06 erg/cm2
90%_error_low -1.45e-08 -1.53e-08 -2.33e-08 -1.18e-07 -5.76e-08 -1.31e-07 erg/cm2
90%_error_hi 1.48e-08 1.55e-08 2.34e-08 1.72e-07 5.79e-08 1.78e-07 erg/cm2
Peak flux CPL 4.59e-01 6.26e-01 4.74e-01 2.34e-01 1.71e+00 1.79e+00 ph/cm2/s
90%_error_low -8.39e-02 -6.02e-02 -5.00e-02 -1.00e-01 -1.45e-01 -1.79e-01 ph/cm2/s
90%_error_hi 8.61e-02 6.21e-02 5.09e-02 1.76e-01 1.45e-01 2.14e-01 ph/cm2/s
======================================================================
Image
Pre-slew 15.0-350.0 keV image (Event data)
#   RAcent    DECcent   POSerr    Theta     Phi              Peak Cts       SNR   Name
  276.1951    37.6025   0.0042    17.9957   -34.0834         1.7417863     46.281 TRIG_00176818

Foreground time interval of the image:
 -0.652  10.029 (delta_t =  10.681 [sec])
Background time interval of the image:
-299.072  -0.652 (delta_t = 298.420 [sec])
Light Curves
Note: The mask-weighted lightcurves have units of either count/det or counts/sec/det, where a det is 0.4 x 0.4 = 0.16 sq cm.
Full-time range; 1 s binning
Other quick-look light curves:
- 64 ms binning (zoomed)
- 16 ms binning (zoomed)
- 8 ms binning (zoomed)
- 2 ms binning (zoomed)
- SN=5 or 10 s binning (full-time range)
- Raw light curve
Spectra
- 64 ms binning (zoomed)
- 16 ms binning (zoomed)
- 8 ms binning (zoomed)
- 2 ms binning (zoomed)
- SN=5 or 10 s binning (full-time range)
- Raw light curve
Spectra
Notes:
- 1) The fitting includes the systematic errors.
- 2) When the burst includes telescope slew time periods, the fitting uses an average response file made from multiple 5-s response files through out the slew time plus single time preiod for the non-slew times, and weighted by the total counts in the corresponding time period using addrmf. An average response file is needed becuase a spectral fit using the pre-slew DRM will introduce some errors in both a spectral shape and a normalization if the PHA file contains a lot of the slew/post-slew time interval.
- 3) For fits to more complicated models (e.g. a power-law over a cutoff power-law), the BAT team has decided to require a chi-square improvement of more than 6 for each extra dof.
Time averaged spectrum fit using the average DRM
Power-law model
Time interval is from   -0.652 sec. to   17.576 sec.

Spectral model in power-law:
------------------------------------------------------------
Parameters  : value       lower 90%   higher 90%
Photon index: -1.62126     ( -0.0647158   0.0643743 )
Norm@50keV  : 7.50084E-03    ( -0.000277474   0.000276868 )
------------------------------------------------------------
#Fit statistic : Chi-Squared =          63.41 using 59 PHA bins.
# Reduced chi-squared =          1.112 for     57 degrees of freedom
# Null hypothesis probability =   2.607037e-01

Photon flux (15-150 keV)    in 18.23 sec: 0.970386 ( -0.036229  0.036284 ) ph/cm2/s
Energy fluence (15-150 keV)             : 1.27581e-06 ( -5.02178e-08  5.04114e-08 ) ergs/cm2
Cutoff power-law model
Time interval is from   -0.652 sec. to   17.576 sec.
Spectral model in the cutoff power-law:
------------------------------------------------------------
Parameters  : value       lower 90%   higher 90%
Photon index: -0.881578     ( -0.282745   0.302151 )
Epeak [keV] : 73.8797      ( -9.11199 16.9346 )
Norm@50keV  : 1.78008E-02    ( -0.00491232   0.00738222 )
------------------------------------------------------------
#Fit statistic : Chi-Squared =          41.34 using 59 PHA bins.
# Reduced chi-squared =         0.7381 for     56 degrees of freedom
# Null hypothesis probability =   9.285129e-01

Photon flux (15-150 keV)    in 18.23 sec: 0.929450 ( -0.038988  0.039053 ) ph/cm2/s
Energy fluence (15-150 keV)             : 1.19695e-06 ( -5.75776e-08  5.78824e-08 ) ergs/cm2
1-s peak spectrum fit
Power-law model
Time interval is from    4.312 sec. to    5.312 sec.

Spectral model in power-law:
------------------------------------------------------------
Parameters  : value       lower 90%   higher 90%
Photon index: -1.37543     ( -0.130281   0.129848 )
Norm@50keV  : 1.45642E-02    ( -0.00116344   0.00116075 )
------------------------------------------------------------
#Fit statistic : Chi-Squared =          53.85 using 59 PHA bins.
# Reduced chi-squared =         0.9446 for     57 degrees of freedom
# Null hypothesis probability =   5.941915e-01

Photon flux (15-150 keV)    in 1 sec: 1.76404 ( -0.14025  0.14035 ) ph/cm2/s
Energy fluence (15-150 keV)             : 1.41472e-07 ( -1.25491e-08  1.2659e-08 ) ergs/cm2
Cutoff power-law model
Time interval is from    4.312 sec. to    5.312 sec.
Spectral model in the cutoff power-law:
------------------------------------------------------------
Parameters  : value       lower 90%   higher 90%
Photon index: -0.522309     ( -0.569944   0.661791 )
Epeak [keV] : 86.0075      ( -18.9695 71.902 )
Norm@50keV  : 3.95962E-02    ( -0.0189837   0.0449301 )
------------------------------------------------------------
#Fit statistic : Chi-Squared =          46.90 using 59 PHA bins.
# Reduced chi-squared =         0.8375 for     56 degrees of freedom
# Null hypothesis probability =   8.017045e-01

Photon flux (15-150 keV)    in 1 sec: 1.71031 ( -0.14524  0.14504 ) ph/cm2/s
Energy fluence (15-150 keV)             : 1.32749e-07 ( -1.3896e-08  1.40016e-08 ) ergs/cm2
Time-resolved spectra
Distribution
T90 vs. Hardness ratio plot
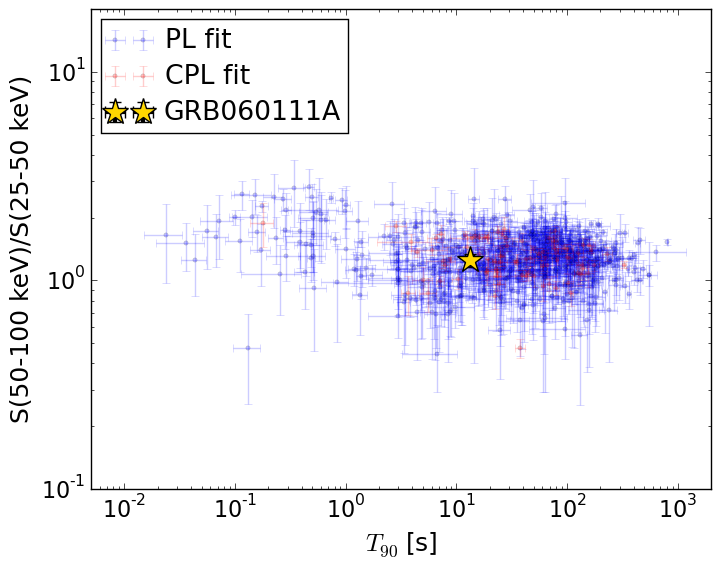
T90                                   = 13.212 sec.
Hardness ratio (energy fluence ratio) = 1.24956798927
S(15-50 keV) vs. S(50-150 keV) plot

S(15-50 keV)  = 5.286764e-07
S(50-150 keV) = 6.682792e-07
The dash-dotted line and the dashed line traces the fluences calculated from the Band function with Epeak = 15 and 150 keV, respectively. Both lines assume a canonical values of alpha = -1 and beta = -2.5.
Mask shadow pattern
IMX = 2.690370798467176E-01, IMY = 1.820379872454307E-01
Spacecraft aspect plot
Bright source in the pre-burst/pre-slew/post-slew images
Pre-burst image of 15-350 keV band
Time interval of the image:
-299.072000 -0.652000

# RAcent  DECcent POSerr Theta    Phi  PeakCts   SNR AngSep     Name
#  [deg]    [deg]    ['] [deg]  [deg]                   [']
254.3310  35.1879    0.0  34.0  -16.1  -0.3124  -1.2   11.2	Her X-1
288.8336  10.9480    1.8  36.2  -88.1   3.7315   6.5    2.1	GRS 1915+105
299.5871  35.1991    0.2  11.3 -111.5  13.9365  68.6    0.2	Cyg X-1
308.0550  40.8911    2.2   9.4 -160.9   1.0635   5.2    4.5	Cyg X-3
326.1285  38.4589    4.0  22.4  177.6   0.6274   2.9    8.5	Cyg X-2
317.3283  32.1986    2.5  20.8 -156.7   0.9655   4.6 ------	UNKNOWN
268.4826  11.9729    2.7  42.2  -57.7   2.8238   4.3 ------	UNKNOWN
324.7872   0.3522    2.8  51.9 -138.3   4.8418   4.1 ------	UNKNOWN
Pre-slew background subtracted image of 15-350 keV band
Time interval of the image:
-0.652000 10.028600

# RAcent  DECcent POSerr Theta    Phi  PeakCts   SNR AngSep     Name
#  [deg]    [deg]    ['] [deg]  [deg]                   [']
254.3898  35.1992   25.7  34.0  -16.1  -0.0205  -0.4    9.2	Her X-1
288.9143  10.8850   11.4  36.2  -88.3  -0.0891  -1.0    7.7	GRS 1915+105
299.7305  35.3277   16.2  11.2 -112.2   0.0267   0.7   10.2	Cyg X-1
308.1111  41.0295    3.7   9.3 -161.7   0.1152   3.1    4.6	Cyg X-3
326.2214  38.3440    6.3  22.6  177.8  -0.0740  -1.8    2.7	Cyg X-2
276.1951  37.6025    0.2  18.0  -34.1   1.7418  46.3 ------	UNKNOWN
242.8969  22.5658    2.2  49.7  -21.9   0.4308   5.2 ------	UNKNOWN
236.2190  15.9283    1.9  58.8  -22.4   1.4478   6.1 ------	UNKNOWN
Post-slew image of 15-350 keV band
Time interval of the image:
54.828600 302.991400

# RAcent  DECcent POSerr Theta    Phi  PeakCts   SNR AngSep     Name
#  [deg]    [deg]    ['] [deg]  [deg]                   [']
254.4621  35.3507   92.4  17.6   16.5  -0.0216  -0.1    0.5	Her X-1
268.2952  -1.3360    6.3  39.6  -60.3   0.8829   1.8    8.2	SW J1753.5-0127
288.7988  10.9677    1.0  28.9  -99.0   3.4256  12.1    1.3	GRS 1915+105
299.5860  35.1937    0.2  18.9 -162.5  11.2391  66.4    0.5	Cyg X-1
308.1127  40.9461    3.2  24.8  179.5   0.7006   3.7    0.4	Cyg X-3
325.9715  38.2417    7.6  38.8 -179.5  -0.4081  -1.5   10.6	Cyg X-2
251.2310  51.9083    2.7  22.6   64.5   0.9082   4.3 ------	UNKNOWN
249.3029  36.5424    2.2  21.4   22.7   0.9277   5.2 ------	UNKNOWN
334.2533  16.9821    2.5  54.6 -157.3   2.9918   4.6 ------	UNKNOWN
270.1099  -5.6797    2.4  43.7  -64.0   3.8503   4.7 ------	UNKNOWN