Analysis Summary
Notes:
- 1) No attempt has been made to eliminate the non-significant decimal places.
- 2) This batgrbproduct analysis is done using the HEASARC data.
- 3) This batgrbproduct analysis is using the flight position for the mask-weighting calculation.
======================================================================
                  BAT GRB EVENT DATA PROCESSING REPORT
    Process Script Ver: batgrbproduct v2.46
    Process Start Time: Wed Jan 22 18:56:53 EST 2014
             Host Name: batevent1
   Current Working Dir: /local/data/batevent/batevent_reproc/trigger176918
======================================================================

  Trigger: 00176918      Segment: 000

  BAT Trigger Time: 158703344.192   [s; MET]
      Trigger Stop: 158703345.216   [s; MET]
               UTC: 2006-01-11T20:15:43.242160    [includes UTCF correction]
       Where From?: TDRSS position message

  BAT
    RA: 286.33719257667   Dec: 70.3598868857769  [deg; J2000]

     Catalogged Source?: NO
     Point Source?:      YES
     GRB Indicated?:     YES    [ by BAT flight software ]
     Image S/N Ratio:    6.97
     Image Trigger?:     NO
     Rate S/N Ratio:     18.5202591774521  [ if not an image trigger ]
     Image S/N Ratio:    6.97

  Analysis Position:   [ source = BAT ]
    RA: 286.33719257667   Dec: 70.3598868857769  [deg; J2000]

  Refined Position:   [ source = BAT pre-slew burst ]
    RA: 286.438531629384   Dec: 70.3798717461811  [deg; J2000]
        { 19h 05m 45.2s , +70d 22' 47.5" }
         +/- 1.50481362963756 [arcmin] (estimated 90% radius based on SNR)
         +/- 0.704802884287371 [arcmin] (formal 1-sigma fit error)
    SNR: 16.9656945094922

  Angular difference between the analysis and refined position is 2.368613 arcmin

  Partial Coding Fraction: 0.2851562    [ including projection effects ]

  Duration
     T90: 58.8320000171661 +/- 4.2843211762303
        Measured from: -1.2039999961853
                   to: 57.6280000209808     [s; relative to TRIGTIME]
     T50: 21.1599999964237 +/- 2.91653561614679
        Measured from: 2.30000001192093
                   to: 23.4600000083447     [s; relative to TRIGTIME]


  Fluence
     Peak Flux  (peak 1 second)
        Measured from: 0.243999987840652
                   to: 1.24399998784065     [s; relative to TRIGTIME]
     Total Fluence
        Measured from: -2.02799999713898
                   to: 61.6960000097752     [s; relative to TRIGTIME]

             Band 1     Band 2     Band 3     Band 4
              15-25      25-50     50-100    100-350     keV
 Total     0.517679   0.557789   0.876554   0.365391
           0.061983   0.065212   0.057827   0.048210 [error]
 Peak      0.041492   0.024755   0.096288   0.024909
           0.009839   0.011005   0.010627   0.008203 [error]

     [ fluence units of on-axis counts / fully illuminated detector ]

======================================================================


====== Table of the duration information =============================

        Value   tstart    tstop
T100   63.724   -2.028   61.696
T90    58.832   -1.204   57.628
T50    21.160    2.300   23.460
Peak    1.000    0.244    1.244


====== Spectral Analysis Summary =====================================

Model      : spectral model: simple power-law (PL) and cutoff power-law (CPL)
Ph_index   : photon index: E^{Ph_index}
Ph_90err   : 90% error of the photon index
Epeak      : Epeak in keV
Epeak_90err: 90% error of Epeak
Norm       : normalization at 50 keV in both the PL model and CPL model
Nomr_90err : 90% error of the normalization
chi2       : Chi-Squared
dof        : degree of freedo

=== Time-averaged spectral analysis ===
(Best model with acceptable fit: PL)

Model Ph_index Ph_90err_low Ph_90err_hi  Epeak  Epeak_90err_low  Epeak_90err_hi  Norm       Nomr_90err_low    Norm_90err_hi    chi2    dof
PL      -0.992    -0.159      0.165       -           -               -         2.35e-03     -2.09e-04          2.06e-04      53.280   57
CPL     -0.930    -0.224      0.407      987.810    -987.810      -987.810      2.51e-03     -3.48e-04          9.86e-04      53.590   56


=== 1-s peak spectral analysis ===
(Best model with acceptable fit: PL)

Model Ph_index Ph_90err_low Ph_90err_hi  Epeak  Epeak_90err_low  Epeak_90err_hi  Norm       Nomr_90err_low    Norm_90err_hi    chi2    dof
PL      -0.823     -0.322     0.347       -           -               -         1.22e-02     -2.37e-03          2.29e-03      62.510   57
CPL     -0.645     -0.497     1.873      503.264    -503.264      -503.264      1.43e-02     -4.18e-03          4.48e-02      62.570   56


=== Fluence/Peak Flux Summary ===

              Model    Band1     Band2     Band3     Band4     Band5     Total
                       15-25     25-50    50-100    100-350    15-150    15-350    keV
Fluence         PL   1.19e-07  3.00e-07  6.02e-07  3.04e-06  1.63e-06  4.06e-06   erg/cm2
      90%_error_low -2.25e-08 -3.44e-08 -5.47e-08 -6.20e-07 -1.44e-07 -6.44e-07   erg/cm2
      90%_error_hi   2.42e-08  3.38e-08  5.43e-08  7.34e-07  1.44e-07  7.43e-07   erg/cm2
Peak flux       PL   2.63e-01  3.98e-01  4.50e-01  9.68e-01  1.40e+00  2.08e+00   ph/cm2/s
      90%_error_low -1.02e-01 -1.03e-01 -8.02e-02 -3.40e-01 -2.61e-01 -3.94e-01   ph/cm2/s
      90%_error_hi   1.21e-01  1.01e-01  7.95e-02  4.50e-01  2.63e-01  4.25e-01   ph/cm2/s

Fluence        CPL   1.19e-07  3.00e-07  6.03e-07  3.23e-06  1.63e-06  4.03e-06   erg/cm2
      90%_error_low    N/A    -3.45e-08    N/A    -1.43e-06 -1.87e-07 -1.20e-06   erg/cm2
      90%_error_hi     N/A     3.38e-08    N/A     1.21e-07  1.80e-07  3.66e-07   erg/cm2
Peak flux      CPL   2.64e-01  4.00e-01  4.50e-01  9.61e-01  1.40e+00  2.08e+00   ph/cm2/s
      90%_error_low     N/A       N/A   -7.99e-02     N/A   -2.80e-01 -7.88e-01   ph/cm2/s
      90%_error_hi      N/A       N/A    6.32e-02     N/A    2.61e-01  4.12e-01   ph/cm2/s

======================================================================
Image
Pre-slew 15.0-350.0 keV image (Event data)
#   RAcent    DECcent   POSerr    Theta     Phi              Peak Cts       SNR   Name
  286.4385    70.3799   0.0114    33.2487   113.5190         1.4167181     16.966 TRIG_00176918

Foreground time interval of the image:
 -2.028  15.509 (delta_t =  17.537 [sec])
Background time interval of the image:
-299.192  -2.028 (delta_t = 297.164 [sec])
Light Curves
Note: The mask-weighted lightcurves have units of either count/det or counts/sec/det, where a det is 0.4 x 0.4 = 0.16 sq cm.
Full-time range; 1 s binning
Other quick-look light curves:
- 64 ms binning (zoomed)
- 16 ms binning (zoomed)
- 8 ms binning (zoomed)
- 2 ms binning (zoomed)
- SN=5 or 10 s binning (full-time range)
- Raw light curve
Spectra
- 64 ms binning (zoomed)
- 16 ms binning (zoomed)
- 8 ms binning (zoomed)
- 2 ms binning (zoomed)
- SN=5 or 10 s binning (full-time range)
- Raw light curve
Spectra
Notes:
- 1) The fitting includes the systematic errors.
- 2) When the burst includes telescope slew time periods, the fitting uses an average response file made from multiple 5-s response files through out the slew time plus single time preiod for the non-slew times, and weighted by the total counts in the corresponding time period using addrmf. An average response file is needed becuase a spectral fit using the pre-slew DRM will introduce some errors in both a spectral shape and a normalization if the PHA file contains a lot of the slew/post-slew time interval.
- 3) For fits to more complicated models (e.g. a power-law over a cutoff power-law), the BAT team has decided to require a chi-square improvement of more than 6 for each extra dof.
Time averaged spectrum fit using the average DRM
Power-law model
Time interval is from   -2.028 sec. to   61.696 sec.

Spectral model in power-law:
------------------------------------------------------------
Parameters  : value       lower 90%   higher 90%
Photon index: -0.992214     ( -0.159213   0.164542 )
Norm@50keV  : 2.35260E-03    ( -0.000208598   0.000206442 )
------------------------------------------------------------
#Fit statistic : Chi-Squared =          53.28 using 59 PHA bins.
# Reduced chi-squared =         0.9347 for     57 degrees of freedom
# Null hypothesis probability =   6.153932e-01

Photon flux (15-150 keV)    in 63.72 sec: 0.270744 ( -0.024566  0.024681 ) ph/cm2/s
Energy fluence (15-150 keV)             : 1.62568e-06 ( -1.43861e-07  1.44451e-07 ) ergs/cm2
Cutoff power-law model
Time interval is from   -2.028 sec. to   61.696 sec.
Spectral model in the cutoff power-law:
------------------------------------------------------------
Parameters  : value       lower 90%   higher 90%
Photon index: -0.986074     ( -0.224224   0.406973 )
Epeak [keV] : 9999.33      ( -9999.34 -9999.34 )
Norm@50keV  : 2.36655E-03    ( -0.000205989   0.00112786 )
------------------------------------------------------------
#Fit statistic : Chi-Squared =          53.31 using 59 PHA bins.
# Reduced chi-squared =         0.9519 for     56 degrees of freedom
# Null hypothesis probability =   5.774262e-01

Photon flux (15-150 keV)    in 63.72 sec: 0.270680 (    ) ph/cm2/s
Energy fluence (15-150 keV)             : 1.63044e-06 ( -1.86547e-07  1.79922e-07 ) ergs/cm2
1-s peak spectrum fit
Power-law model

Time interval is from    0.244 sec. to    1.244 sec.

Spectral model in power-law:
------------------------------------------------------------
Parameters  : value       lower 90%   higher 90%
Photon index: -0.822632     ( -0.32192   0.347208 )
Norm@50keV  : 1.21987E-02    ( -0.00237469   0.00229355 )
------------------------------------------------------------
#Fit statistic : Chi-Squared =          62.51 using 59 PHA bins.
# Reduced chi-squared =          1.097 for     57 degrees of freedom
# Null hypothesis probability =   2.870833e-01

Photon flux (15-150 keV)    in 1 sec: 1.40104 ( -0.26113  0.263 ) ph/cm2/s
Energy fluence (15-150 keV)             : 1.41228e-07 ( -2.57285e-08  2.57695e-08 ) ergs/cm2
Cutoff power-law model
Time interval is from    0.244 sec. to    1.244 sec.
Spectral model in the cutoff power-law:
------------------------------------------------------------
Parameters  : value       lower 90%   higher 90%
Photon index: -0.814724     ( -0.484086   1.8854 )
Epeak [keV] : 9997.61      ( -9997.73 -9997.73 )
Norm@50keV  : 1.22833E-02    ( -0.00221087   0.0467567 )
------------------------------------------------------------
#Fit statistic : Chi-Squared =          62.51 using 59 PHA bins.
# Reduced chi-squared =          1.116 for     56 degrees of freedom
# Null hypothesis probability =   2.562420e-01

Photon flux (15-150 keV)    in 1 sec: 1.40225 ( -0.28035  0.26129 ) ph/cm2/s
Energy fluence (15-150 keV)             : 1.14101e-08 ( 0  0 ) ergs/cm2
Time-resolved spectra
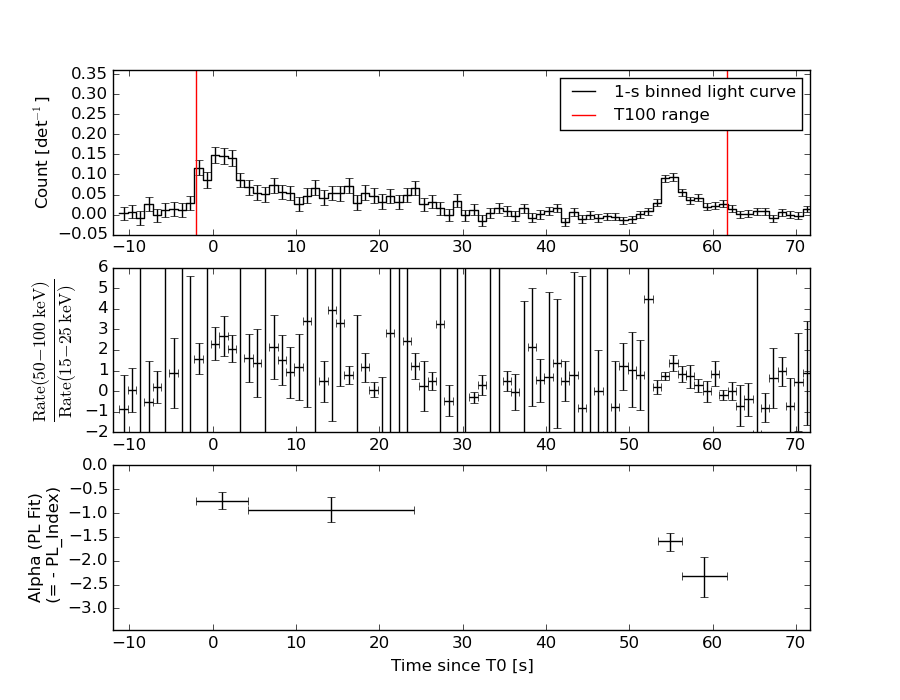
Distribution
T90 vs. Hardness ratio plot
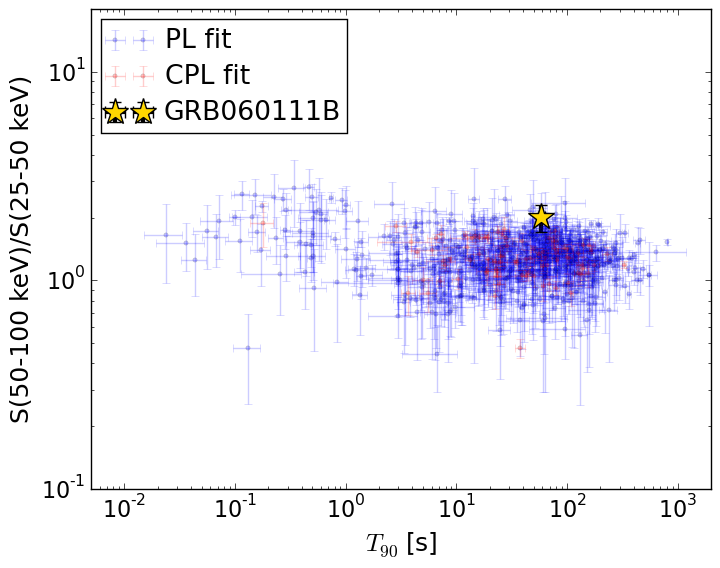
T90                                   = 58.832 sec.
Hardness ratio (energy fluence ratio) = 2.01085152828
S(15-50 keV) vs. S(50-150 keV) plot
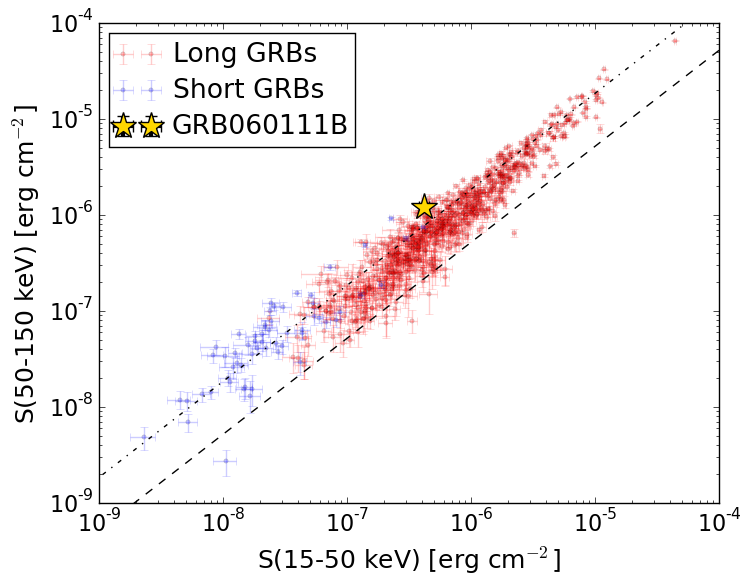
S(15-50 keV)  = 4.187363e-07
S(50-150 keV) = 1.2069566e-06
The dash-dotted line and the dashed line traces the fluences calculated from the Band function with Epeak = 15 and 150 keV, respectively. Both lines assume a canonical values of alpha = -1 and beta = -2.5.
Mask shadow pattern
IMX = -2.616173330901552E-01, IMY = -6.011339002880519E-01
Spacecraft aspect plot
Bright source in the pre-burst/pre-slew/post-slew images
Pre-burst image of 15-350 keV band
Time interval of the image:
-299.192000 -2.028000

# RAcent  DECcent POSerr Theta    Phi  PeakCts   SNR AngSep     Name
#  [deg]    [deg]    ['] [deg]  [deg]                   [']
254.3859  35.1428    6.2  17.7   16.0  -0.3932  -1.8   12.5	Her X-1
268.1781  -1.3529    0.0  39.6  -60.1   1.0489   1.9   12.9	SW J1753.5-0127
288.7743  10.9503    1.0  28.9  -99.0   3.9498  11.7    1.4	GRS 1915+105
299.5846  35.1978    0.1  18.9 -162.6  16.8311  80.1    0.4	Cyg X-1
308.0994  40.9372    1.9  24.8  179.5   1.4651   5.9    1.0	Cyg X-3
326.1981  38.3173   87.8  38.9 -179.7   0.0430   0.1    1.3	Cyg X-2
328.6865  73.5763    2.9  43.8  126.2   3.5246   4.1 ------	UNKNOWN
245.6426  -3.2338    2.4  49.7  -31.0   2.8252   4.9 ------	UNKNOWN
289.5333  -1.3627    3.0  40.9  -93.4   4.0055   3.9 ------	UNKNOWN
307.4620   2.9580    4.3  44.9 -120.0   2.5342   2.7 ------	UNKNOWN
Pre-slew background subtracted image of 15-350 keV band
Time interval of the image:
-2.028000 15.508590

# RAcent  DECcent POSerr Theta    Phi  PeakCts   SNR AngSep     Name
#  [deg]    [deg]    ['] [deg]  [deg]                   [']
254.4573  35.3421  282.7  17.6   16.6   0.0017   0.0    0.0	Her X-1
268.1781  -1.3529    0.0  39.6  -60.1   0.0289   0.3   12.9	SW J1753.5-0127
288.6823  10.8391   13.4  29.0  -98.7  -0.0528  -0.9    9.4	GRS 1915+105
299.7772  35.1186    3.9  19.1 -162.5   0.1239   3.0   10.4	Cyg X-1
307.9203  41.0788   90.0  24.7  179.1   0.0058   0.1   11.5	Cyg X-3
326.0378  38.4413    3.7  38.8 -179.9  -0.1832  -3.2    9.5	Cyg X-2
286.4385  70.3798    0.7  33.2  113.5   1.4168  17.0 ------	UNKNOWN
220.4739  15.4203    2.2  53.7    8.7   1.0369   5.2 ------	UNKNOWN
313.0368  35.8848    2.3  29.4 -170.8   0.2248   4.9 ------	UNKNOWN
328.0953  21.7378    2.7  47.2 -158.4   0.3281   4.2 ------	UNKNOWN
274.3820  10.9500    2.4  26.7  -68.8   0.2426   4.7 ------	UNKNOWN
239.8975  -4.0082    2.0  53.5  -25.5   0.7700   5.7 ------	UNKNOWN
295.8118   0.1902    2.6  41.5 -103.2   0.6821   4.4 ------	UNKNOWN
Post-slew image of 15-350 keV band
Time interval of the image:
68.508600 302.871400

# RAcent  DECcent POSerr Theta    Phi  PeakCts   SNR AngSep     Name
#  [deg]    [deg]    ['] [deg]  [deg]                   [']
254.3746  35.2104   12.9  39.1  -40.3  -0.2645  -0.9    8.9	Her X-1
299.5910  35.1915    0.4  35.9 -102.2  12.4409  30.4    0.6	Cyg X-1
308.1103  41.0048    1.7  31.4 -116.1   1.7400   6.6    3.1	Cyg X-3
326.2988  38.2564    3.8  38.2 -138.2   0.8019   3.0    7.2	Cyg X-2
286.2296  29.1858    3.3  41.2  -83.5   2.5840   3.5 ------	UNKNOWN