Analysis Summary
Notes:
- 1) No attempt has been made to eliminate the non-significant decimal places.
- 2) This batgrbproduct analysis is done using the HEASARC data.
- 3) This batgrbproduct analysis is using the flight position for the mask-weighting calculation.
======================================================================
BAT GRB EVENT DATA PROCESSING REPORT
Process Script Ver: batgrbproduct v2.46
Process Start Time: Wed Jan 22 18:51:25 EST 2014
Host Name: batevent1
Current Working Dir: /local/data/batevent/batevent_reproc/trigger177533
======================================================================
Trigger: 00177533 Segment: 000
BAT Trigger Time: 159093448.192 [s; MET]
Trigger Stop: 159093464.576 [s; MET]
UTC: 2006-01-16T08:37:27.233480 [includes UTCF correction]
Where From?: TDRSS position message
BAT
RA: 84.6992896947215 Dec: -5.4486871468953 [deg; J2000]
Catalogged Source?: NO
Point Source?: YES
GRB Indicated?: YES [ by BAT flight software ]
Image S/N Ratio: 6.58
Image Trigger?: NO
Rate S/N Ratio: 10.4403065089106 [ if not an image trigger ]
Image S/N Ratio: 6.58
Analysis Position: [ source = BAT ]
RA: 84.6992896947215 Dec: -5.4486871468953 [deg; J2000]
Refined Position: [ source = BAT pre-slew burst ]
RA: 84.701028157119 Dec: -5.44075165544001 [deg; J2000]
{ 05h 38m 48.2s , -05d 26' 26.7" }
+/- 1.71143086121601 [arcmin] (estimated 90% radius based on SNR)
+/- 0.628663727296607 [arcmin] (formal 1-sigma fit error)
SNR: 14.117177230572
Angular difference between the analysis and refined position is 0.487321 arcmin
Partial Coding Fraction: 0.2050781 [ including projection effects ]
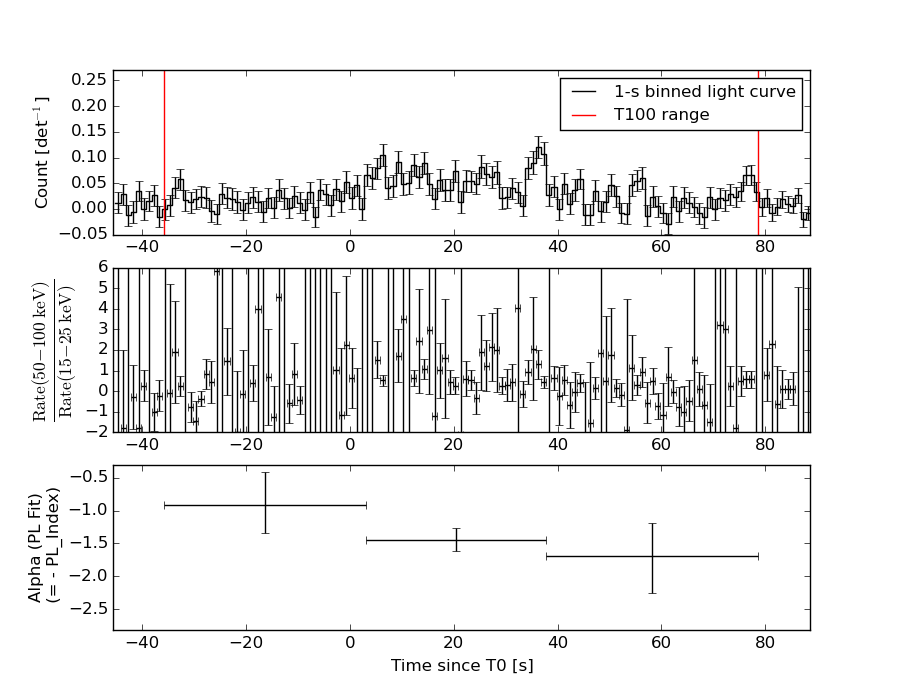
Duration
T90: 104.831999987364 +/- 27.2568347520558
Measured from: -29.0480000078678
to: 75.783999979496 [s; relative to TRIGTIME]
T50: 31.055999994278 +/- 6.83722515012333
Measured from: 5.63999998569489
to: 36.6959999799728 [s; relative to TRIGTIME]
Fluence
Peak Flux (peak 1 second)
Measured from: 36.3959999978542
to: 37.3959999978542 [s; relative to TRIGTIME]
Total Fluence
Measured from: -35.7360000014305
to: 78.6319999992847 [s; relative to TRIGTIME]
Band 1 Band 2 Band 3 Band 4
15-25 25-50 50-100 100-350 keV
Total 0.850017 1.214557 1.082156 0.432063
0.118445 0.122497 0.106289 0.089990 [error]
Peak 0.026129 0.060425 0.037927 0.017533
0.012039 0.012471 0.010513 0.008865 [error]
[ fluence units of on-axis counts / fully illuminated detector ]
======================================================================
====== Table of the duration information =============================
Value tstart tstop
T100 114.368 -35.736 78.632
T90 104.832 -29.048 75.784
T50 31.056 5.640 36.696
Peak 1.000 36.396 37.396
====== Spectral Analysis Summary =====================================
Model : spectral model: simple power-law (PL) and cutoff power-law (CPL)
Ph_index : photon index: E^{Ph_index}
Ph_90err : 90% error of the photon index
Epeak : Epeak in keV
Epeak_90err: 90% error of Epeak
Norm : normalization at 50 keV in both the PL model and CPL model
Nomr_90err : 90% error of the normalization
chi2 : Chi-Squared
dof : degree of freedo
=== Time-averaged spectral analysis ===
(Best model with acceptable fit: PL)
Model Ph_index Ph_90err_low Ph_90err_hi Epeak Epeak_90err_low Epeak_90err_hi Norm Nomr_90err_low Norm_90err_hi chi2 dof
PL -1.366 -0.171 0.173 - - - 2.15e-03 -2.15e-04 2.15e-04 59.050 57
CPL -0.934 -0.529 0.786 129.601 -53.691 -129.601 3.48e-03 -1.33e-03 4.69e-03 57.860 56
=== 1-s peak spectral analysis ===
(Best model with acceptable fit: PL)
Model Ph_index Ph_90err_low Ph_90err_hi Epeak Epeak_90err_low Epeak_90err_hi Norm Nomr_90err_low Norm_90err_hi chi2 dof
PL -1.454 -0.408 0.416 - - - 9.51e-03 -2.37e-03 2.37e-03 40.460 57
CPL -1.024 -1.394 2.042 117.025 -117.025 -117.025 1.56e-02 N/A N/A 40.230 56
=== Fluence/Peak Flux Summary ===
Model Band1 Band2 Band3 Band4 Band5 Total
15-25 25-50 50-100 100-350 15-150 15-350 keV
Fluence PL 2.77e-07 5.52e-07 8.57e-07 2.92e-06 2.39e-06 4.61e-06 erg/cm2
90%_error_low -4.99e-08 -6.25e-08 -1.04e-07 -7.04e-07 -2.58e-07 -7.84e-07 erg/cm2
90%_error_hi 5.26e-08 6.18e-08 1.03e-07 8.44e-07 2.60e-07 8.97e-07 erg/cm2
Peak flux PL 3.74e-01 3.87e-01 2.83e-01 3.32e-01 1.17e+00 1.38e+00 ph/cm2/s
90%_error_low -1.55e-01 -1.11e-01 -8.25e-02 -1.60e-01 -3.08e-01 -3.43e-01 ph/cm2/s
90%_error_hi 1.75e-01 1.08e-01 8.07e-02 2.26e-01 3.10e-01 3.44e-01 ph/cm2/s
Fluence CPL 2.55e-07 5.75e-07 8.88e-07 1.62e-06 2.33e-06 3.33e-06 erg/cm2
90%_error_low -6.00e-08 -7.23e-08 -1.16e-07 -9.19e-07 -2.82e-07 -9.52e-07 erg/cm2
90%_error_hi 6.18e-08 7.51e-08 1.19e-07 1.49e-06 2.79e-07 1.61e-06 erg/cm2
Peak flux CPL 3.47e-01 4.06e-01 2.97e-01 2.11e-01 1.16e+00 1.26e+00 ph/cm2/s
90%_error_low -1.78e-01 -1.24e-01 -9.25e-02 -2.11e-01 -3.10e-01 -3.76e-01 ph/cm2/s
90%_error_hi 1.93e-01 1.36e-01 1.00e-01 1.79e-01 3.12e-01 4.27e-01 ph/cm2/s
======================================================================
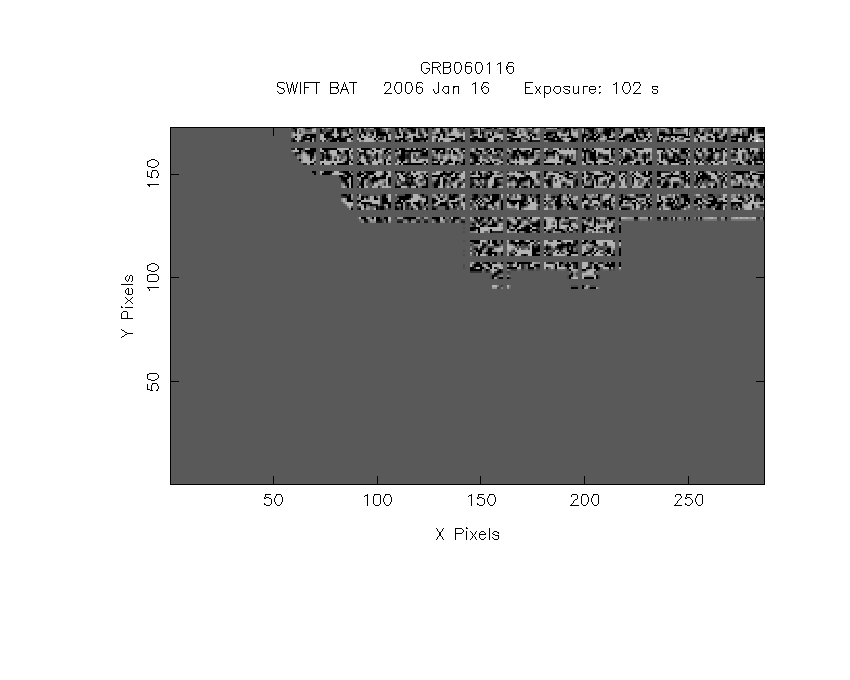
Image
Pre-slew 15.0-350.0 keV image (Event data)
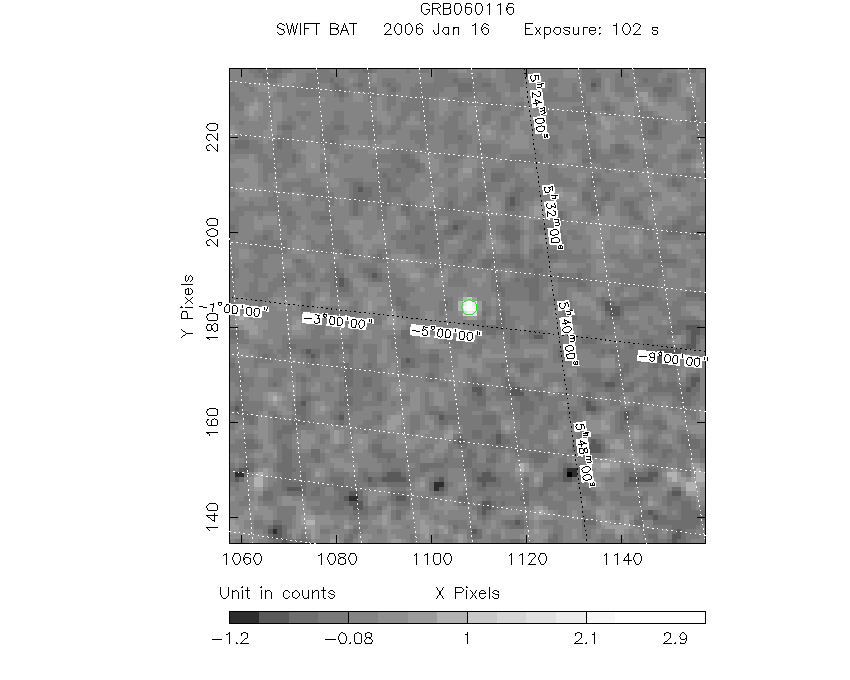
#   RAcent    DECcent   POSerr    Theta     Phi              Peak Cts       SNR   Name
   84.7010    -5.4408   0.0136    37.9331   127.9743         3.4115524     14.117 TRIG_00177533

Foreground time interval of the image:
-35.736  66.509 (delta_t = 102.245 [sec])
Background time interval of the image:
-299.192 -35.736 (delta_t = 263.456 [sec])
Light Curves
Note: The mask-weighted lightcurves have units of either count/det or counts/sec/det, where a det is 0.4 x 0.4 = 0.16 sq cm.
Full-time range; 1 s binning
Other quick-look light curves:
- 64 ms binning (zoomed)
- 16 ms binning (zoomed)
- 8 ms binning (zoomed)
- 2 ms binning (zoomed)
- SN=5 or 10 s binning (full-time range)
- Raw light curve
Spectra
- 64 ms binning (zoomed)
- 16 ms binning (zoomed)
- 8 ms binning (zoomed)
- 2 ms binning (zoomed)
- SN=5 or 10 s binning (full-time range)
- Raw light curve
Spectra
Notes:
- 1) The fitting includes the systematic errors.
- 2) When the burst includes telescope slew time periods, the fitting uses an average response file made from multiple 5-s response files through out the slew time plus single time preiod for the non-slew times, and weighted by the total counts in the corresponding time period using addrmf. An average response file is needed becuase a spectral fit using the pre-slew DRM will introduce some errors in both a spectral shape and a normalization if the PHA file contains a lot of the slew/post-slew time interval.
- 3) For fits to more complicated models (e.g. a power-law over a cutoff power-law), the BAT team has decided to require a chi-square improvement of more than 6 for each extra dof.
Time averaged spectrum fit using the average DRM
Power-law model
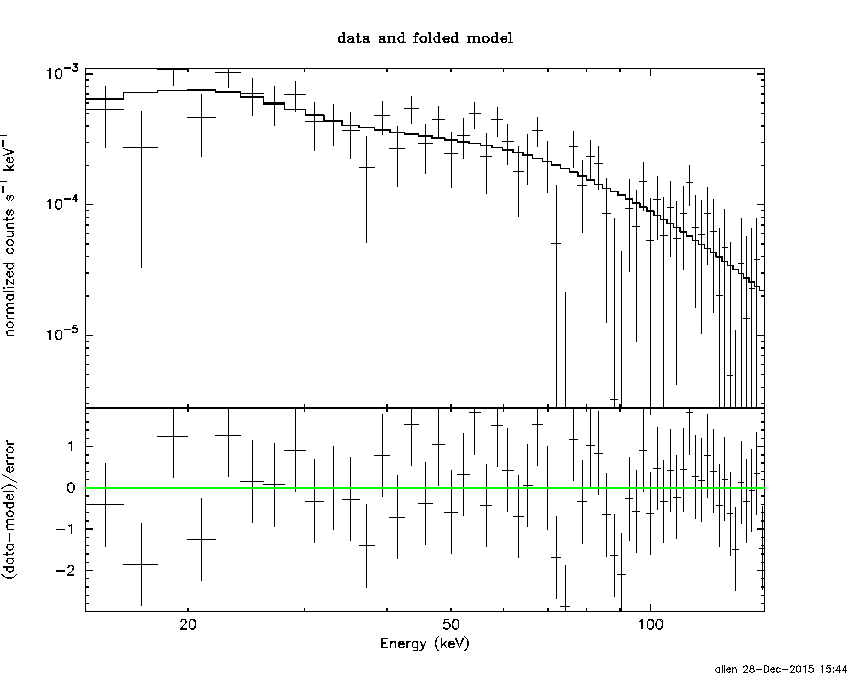
Time interval is from  -35.736 sec. to   78.632 sec.

Spectral model in power-law:
------------------------------------------------------------
Parameters  : value       lower 90%   higher 90%
Photon index: -1.36551     ( -0.170991   0.173006 )
Norm@50keV  : 2.14768E-03    ( -0.000215434   0.000215371 )
------------------------------------------------------------
#Fit statistic : Chi-Squared =          59.05 using 59 PHA bins.
# Reduced chi-squared =          1.036 for     57 degrees of freedom
# Null hypothesis probability =   4.004280e-01

Photon flux (15-150 keV)    in 114.4 sec: 0.259578 ( -0.027309  0.027395 ) ph/cm2/s
Energy fluence (15-150 keV)             : 2.39169e-06 ( -2.58274e-07  2.59651e-07 ) ergs/cm2
Cutoff power-law model
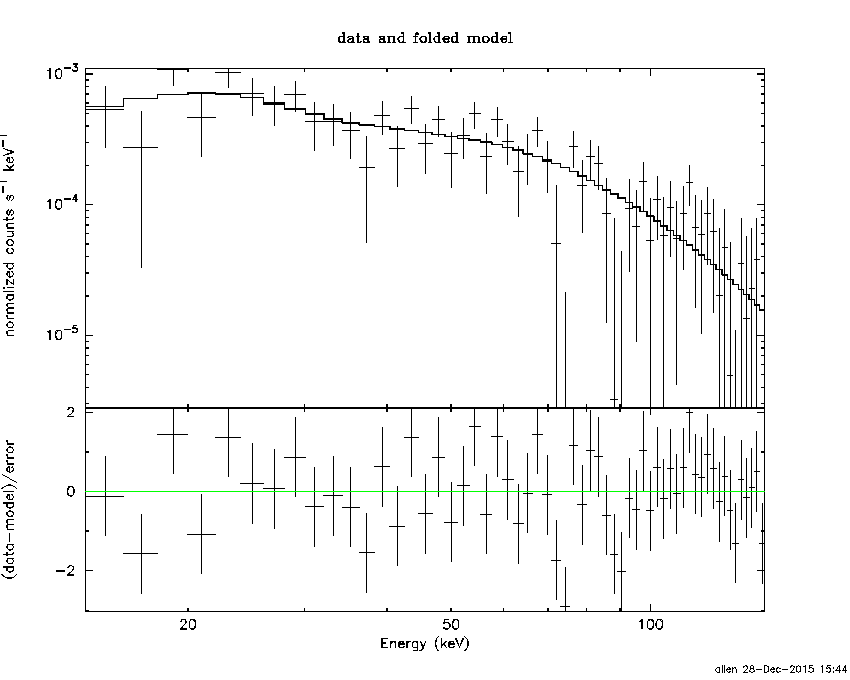
Time interval is from  -35.736 sec. to   78.632 sec.
Spectral model in the cutoff power-law:
------------------------------------------------------------
Parameters  : value       lower 90%   higher 90%
Photon index: -0.934283     ( -0.528769   0.785647 )
Epeak [keV] : 129.601      ( -53.6933 -129.603 )
Norm@50keV  : 3.48331E-03    ( -0.00133253   0.0046907 )
------------------------------------------------------------
#Fit statistic : Chi-Squared =          57.86 using 59 PHA bins.
# Reduced chi-squared =          1.033 for     56 degrees of freedom
# Null hypothesis probability =   4.064454e-01

Photon flux (15-150 keV)    in 114.4 sec: 0.254926 ( -0.028345  0.028339 ) ph/cm2/s
Energy fluence (15-150 keV)             : 2.32839e-06 ( -2.81544e-07  2.78696e-07 ) ergs/cm2
1-s peak spectrum fit
Power-law model
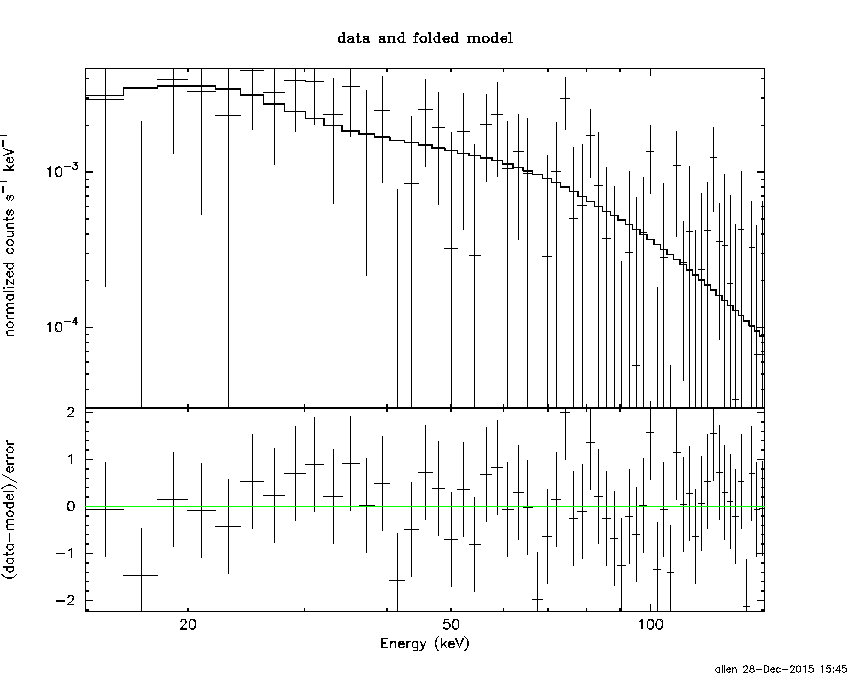
Time interval is from   36.396 sec. to   37.396 sec.

Spectral model in power-law:
------------------------------------------------------------
Parameters  : value       lower 90%   higher 90%
Photon index: -1.45362     ( -0.408154   0.416391 )
Norm@50keV  : 9.51113E-03    ( -0.00237426   0.00237201 )
------------------------------------------------------------
#Fit statistic : Chi-Squared =          40.46 using 59 PHA bins.
# Reduced chi-squared =         0.7098 for     57 degrees of freedom
# Null hypothesis probability =   9.522617e-01

Photon flux (15-150 keV)    in 1 sec: 1.17320 ( -0.307831  0.3098 ) ph/cm2/s
Energy fluence (15-150 keV)             : 9.09662e-08 ( -2.38851e-08  2.40582e-08 ) ergs/cm2
Cutoff power-law model

Time interval is from   36.396 sec. to   37.396 sec.
Spectral model in the cutoff power-law:
------------------------------------------------------------
Parameters  : value       lower 90%   higher 90%
Photon index: -1.02407     ( -1.39388   2.04189 )
Epeak [keV] : 117.025      ( -117.062 -117.062 )
Norm@50keV  : 1.56449E-02    (     )
------------------------------------------------------------
#Fit statistic : Chi-Squared =          40.23 using 59 PHA bins.
# Reduced chi-squared =         0.7183 for     56 degrees of freedom
# Null hypothesis probability =   9.445749e-01

Photon flux (15-150 keV)    in 1 sec: 1.16164 ( -0.310204  0.31241 ) ph/cm2/s
Energy fluence (15-150 keV)             : 8.92421e-08 ( -2.54672e-08  2.48617e-08 ) ergs/cm2
Time-resolved spectra
Distribution
T90 vs. Hardness ratio plot
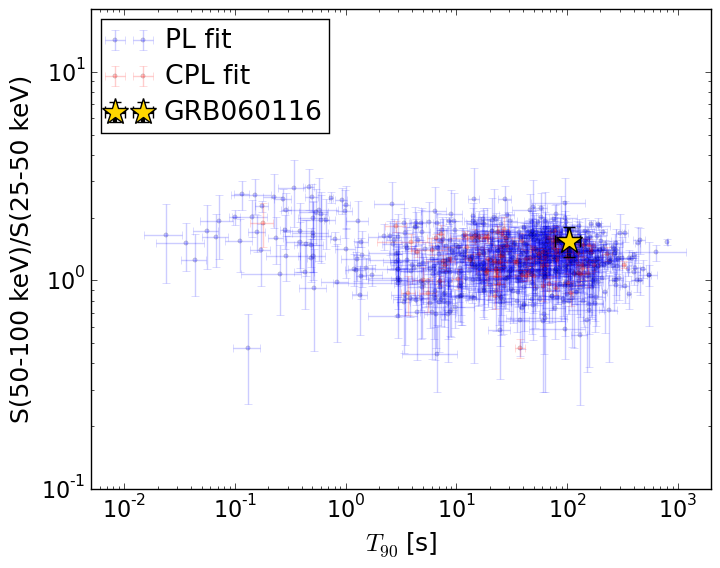
T90                                   = 104.832 sec.
Hardness ratio (energy fluence ratio) = 1.55242286247
S(15-50 keV) vs. S(50-150 keV) plot
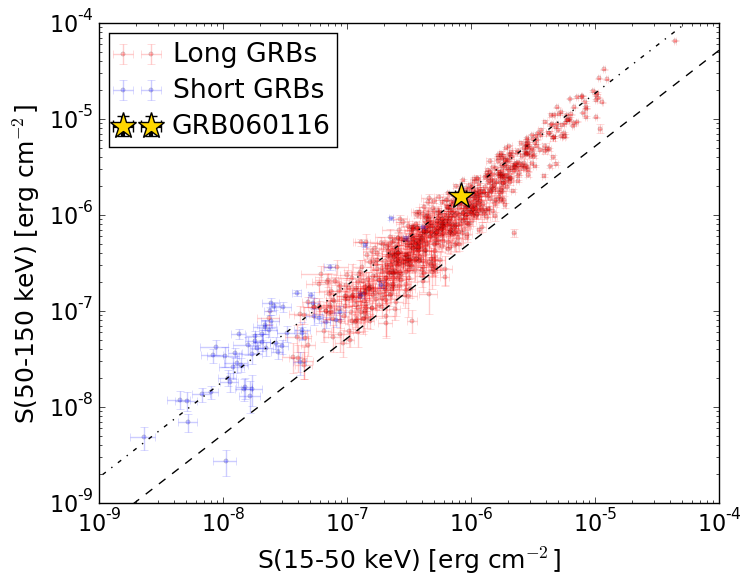
S(15-50 keV)  = 8.285159e-07
S(50-150 keV) = 1.5632019e-06
The dash-dotted line and the dashed line traces the fluences calculated from the Band function with Epeak = 15 and 150 keV, respectively. Both lines assume a canonical values of alpha = -1 and beta = -2.5.
Mask shadow pattern
IMX = -4.795761723661797E-01, IMY = -6.143969452651807E-01
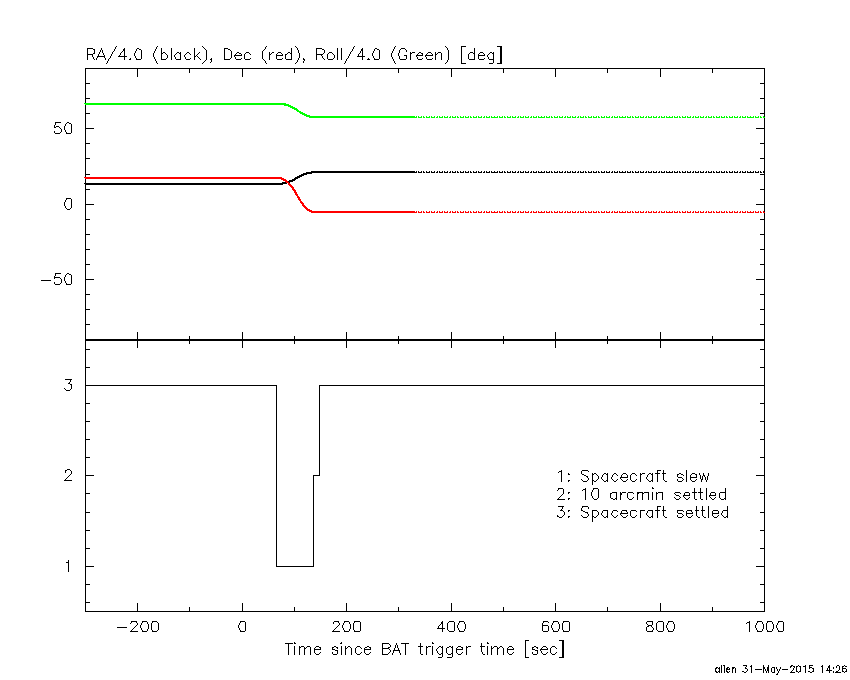
Spacecraft aspect plot
Bright source in the pre-burst/pre-slew/post-slew images
Pre-burst image of 15-350 keV band
Time interval of the image:
-299.192000 -35.736000

# RAcent  DECcent POSerr Theta    Phi  PeakCts   SNR AngSep     Name
#  [deg]    [deg]    ['] [deg]  [deg]                   [']
 83.6358  22.0173    0.3  28.2   79.4  11.5839  40.3    0.2	Crab
 68.2851  -7.1796    2.5  28.3  152.7   1.0351   4.7 ------	UNKNOWN
 42.5425 -40.6336    4.6  59.0 -166.2   3.3180   2.5 ------	UNKNOWN
  2.0507  42.9137    4.4  50.7  -44.5   2.9019   2.6 ------	UNKNOWN
 12.9182   8.6580    4.4  40.9  -93.2   2.5777   2.7 ------	UNKNOWN
Pre-slew background subtracted image of 15-350 keV band
Time interval of the image:
-35.736000 66.508590

# RAcent  DECcent POSerr Theta    Phi  PeakCts   SNR AngSep     Name
#  [deg]    [deg]    ['] [deg]  [deg]                   [']
 83.7447  21.9106    7.8  28.3   79.6  -0.2498  -1.5    8.8	Crab
 84.7010  -5.4408    0.8  37.9  128.0   3.4121  14.1 ------	UNKNOWN
Post-slew image of 15-350 keV band
Time interval of the image:
137.108620 302.879200

# RAcent  DECcent POSerr Theta    Phi  PeakCts   SNR AngSep     Name
#  [deg]    [deg]    ['] [deg]  [deg]                   [']
 83.6308  22.0205    0.3  27.5   37.9   7.2393  41.3    0.4	Crab
 63.9770 -46.5780    2.3  44.8 -119.9   3.1938   5.0 ------	UNKNOWN