Analysis Summary
Notes:
- 1) No attempt has been made to eliminate the non-significant decimal places.
- 2) This batgrbproduct analysis is done using the HEASARC data.
- 3) This batgrbproduct analysis is using the flight position for the mask-weighting calculation.
======================================================================
                  BAT GRB EVENT DATA PROCESSING REPORT
    Process Script Ver: batgrbproduct v2.46
    Process Start Time: Wed Jan 22 18:46:17 EST 2014
             Host Name: batevent1
   Current Working Dir: /local/data/batevent/batevent_reproc/trigger178750
======================================================================

  Trigger: 00178750      Segment: 000

  BAT Trigger Time: 159810892.8   [s; MET]
      Trigger Stop: 159810893.824   [s; MET]
               UTC: 2006-01-24T15:54:51.825540    [includes UTCF correction]
       Where From?: TDRSS position message

  BAT
    RA: 77.0434182139533   Dec: 69.7093915850525  [deg; J2000]

     Catalogged Source?: NO
     Point Source?:      YES
     GRB Indicated?:     YES    [ by BAT flight software ]
     Image S/N Ratio:    6.59
     Image Trigger?:     NO
     Rate S/N Ratio:     10.7238052947636  [ if not an image trigger ]
     Image S/N Ratio:    6.59

  Analysis Position:   [ source = BAT ]
    RA: 77.0434182139533   Dec: 69.7093915850525  [deg; J2000]

  Refined Position:   [ source = BAT pre-slew burst ]
    RA: 77.1048846448311   Dec: 69.7250425081988  [deg; J2000]
        { 05h 08m 25.2s , +69d 43' 30.2" }
         +/- 1.71076130854364 [arcmin] (estimated 90% radius based on SNR)
         +/- 0.71950606777471 [arcmin] (formal 1-sigma fit error)
    SNR: 14.1250709479624

  Angular difference between the analysis and refined position is 1.586276 arcmin

  Partial Coding Fraction: 0.6171875    [ including projection effects ]

  Duration
     T90: 13.4239999949932 +/- 1.2916485778453
        Measured from: -0.548000007867813
                   to: 12.8759999871254     [s; relative to TRIGTIME]
     T50: 7.90000000596046 +/- 2.23261727894755
        Measured from: 1.21999999880791
                   to: 9.12000000476837     [s; relative to TRIGTIME]


  Fluence
     Peak Flux  (peak 1 second)
        Measured from: 0.183999985456467
                   to: 1.18399998545647     [s; relative to TRIGTIME]
     Total Fluence
        Measured from: -1.20000001788139
                   to: 13.5479999780655     [s; relative to TRIGTIME]

             Band 1     Band 2     Band 3     Band 4
              15-25      25-50     50-100    100-350     keV
 Total     0.243279   0.310482   0.159298   0.061306
           0.024313   0.025660   0.023216   0.022237 [error]
 Peak      0.024301   0.040557   0.028215   0.013410
           0.006538   0.006896   0.006483   0.005819 [error]

     [ fluence units of on-axis counts / fully illuminated detector ]

======================================================================


====== Table of the duration information =============================

        Value   tstart    tstop
T100   14.748   -1.200   13.548
T90    13.424   -0.548   12.876
T50     7.900    1.220    9.120
Peak    1.000    0.184    1.184


====== Spectral Analysis Summary =====================================

Model      : spectral model: simple power-law (PL) and cutoff power-law (CPL)
Ph_index   : photon index: E^{Ph_index}
Ph_90err   : 90% error of the photon index
Epeak      : Epeak in keV
Epeak_90err: 90% error of Epeak
Norm       : normalization at 50 keV in both the PL model and CPL model
Nomr_90err : 90% error of the normalization
chi2       : Chi-Squared
dof        : degree of freedo

=== Time-averaged spectral analysis ===
(Best model with acceptable fit: PL)

Model Ph_index Ph_90err_low Ph_90err_hi  Epeak  Epeak_90err_low  Epeak_90err_hi  Norm       Nomr_90err_low    Norm_90err_hi    chi2    dof
PL      -1.814    -0.183      0.177       -           -               -         3.43e-03     -3.88e-04          3.81e-04      41.150   57
CPL     -1.737    -0.638      0.776      148.485    -148.473      -148.485      3.79e-03     -2.02e-03          6.59e-03      41.120   56


=== 1-s peak spectral analysis ===
(Best model with acceptable fit: PL)

Model Ph_index Ph_90err_low Ph_90err_hi  Epeak  Epeak_90err_low  Epeak_90err_hi  Norm       Nomr_90err_low    Norm_90err_hi    chi2    dof
PL      -1.577     -0.358     0.344       -           -               -         6.75e-03     -1.48e-03          1.45e-03      44.240   57
CPL     -0.978     -0.908     1.027       79.328      N/A           N/A         1.42e-02        N/A               N/A         43.620   56


=== Fluence/Peak Flux Summary ===

              Model    Band1     Band2     Band3     Band4     Band5     Total
                       15-25     25-50    50-100    100-350    15-150    15-350    keV
Fluence         PL   8.67e-08  1.32e-07  1.50e-07  3.25e-07  4.65e-07  6.93e-07   erg/cm2
      90%_error_low -1.26e-08 -1.27e-08 -2.30e-08 -9.16e-08 -5.30e-08 -1.16e-07   erg/cm2
      90%_error_hi   1.29e-08  1.26e-08  2.32e-08  1.13e-07  5.38e-08  1.33e-07   erg/cm2
Peak flux       PL   2.99e-01  2.88e-01  1.93e-01  2.02e-01  8.61e-01  9.81e-01   ph/cm2/s
      90%_error_low -9.30e-02 -6.03e-02 -5.32e-02 -9.24e-02 -1.76e-01 -2.03e-01   ph/cm2/s
      90%_error_hi   1.00e-01  5.98e-02  5.30e-02  1.30e-01  1.76e-01  2.05e-01   ph/cm2/s

Fluence        CPL   8.61e-08  1.33e-07  1.50e-07  2.81e-07  4.61e-07  6.49e-07   erg/cm2
      90%_error_low -1.38e-08 -1.38e-08 -2.39e-08 -1.96e-07 -6.49e-08 -2.17e-07   erg/cm2
      90%_error_hi   1.33e-08  1.74e-08  2.35e-08  6.39e-08  5.70e-08  2.38e-07   erg/cm2
Peak flux      CPL   2.76e-01  3.08e-01  1.99e-01  9.86e-02  8.43e-01  8.81e-01   ph/cm2/s
      90%_error_low -1.07e-01 -7.18e-02     N/A   -9.86e-02 -1.80e-01 -2.08e-01   ph/cm2/s
      90%_error_hi   1.11e-01  7.94e-02     N/A    1.40e-01  1.80e-01  2.35e-01   ph/cm2/s

======================================================================
Image
Pre-slew 15.0-350.0 keV image (Event data)
#   RAcent    DECcent   POSerr    Theta     Phi              Peak Cts       SNR   Name
   77.1049    69.7250   0.0135    37.8139  -158.2628         0.8451603     14.125 TRIG_00178750

Foreground time interval of the image:
 -1.200  13.548 (delta_t =  14.748 [sec])
Background time interval of the image:
-27.899  -1.200 (delta_t =  26.699 [sec])
Light Curves
Note: The mask-weighted lightcurves have units of either count/det or counts/sec/det, where a det is 0.4 x 0.4 = 0.16 sq cm.
Full-time range; 1 s binning
Other quick-look light curves:
- 64 ms binning (zoomed)
- 16 ms binning (zoomed)
- 8 ms binning (zoomed)
- 2 ms binning (zoomed)
- SN=5 or 10 s binning (full-time range)
- Raw light curve
Spectra
- 64 ms binning (zoomed)
- 16 ms binning (zoomed)
- 8 ms binning (zoomed)
- 2 ms binning (zoomed)
- SN=5 or 10 s binning (full-time range)
- Raw light curve
Spectra
Notes:
- 1) The fitting includes the systematic errors.
- 2) When the burst includes telescope slew time periods, the fitting uses an average response file made from multiple 5-s response files through out the slew time plus single time preiod for the non-slew times, and weighted by the total counts in the corresponding time period using addrmf. An average response file is needed becuase a spectral fit using the pre-slew DRM will introduce some errors in both a spectral shape and a normalization if the PHA file contains a lot of the slew/post-slew time interval.
- 3) For fits to more complicated models (e.g. a power-law over a cutoff power-law), the BAT team has decided to require a chi-square improvement of more than 6 for each extra dof.
Time averaged spectrum fit using the average DRM
Power-law model
Time interval is from   -1.200 sec. to   13.548 sec.

Spectral model in power-law:
------------------------------------------------------------
Parameters  : value       lower 90%   higher 90%
Photon index: -1.8137     ( -0.18285   0.176925 )
Norm@50keV  : 3.42799E-03    ( -0.000388214   0.000380674 )
------------------------------------------------------------
#Fit statistic : Chi-Squared =          41.15 using 59 PHA bins.
# Reduced chi-squared =         0.7220 for     57 degrees of freedom
# Null hypothesis probability =   9.435459e-01

Photon flux (15-150 keV)    in 14.75 sec: 0.474927 ( -0.045967  0.04599 ) ph/cm2/s
Energy fluence (15-150 keV)             : 4.65352e-07 ( -5.29774e-08  5.38446e-08 ) ergs/cm2
Cutoff power-law model

Time interval is from   -1.200 sec. to   13.548 sec.
Spectral model in the cutoff power-law:
------------------------------------------------------------
Parameters  : value       lower 90%   higher 90%
Photon index: -1.73731     ( -0.63565   0.778326 )
Epeak [keV] : 148.485      ( -153.305 -153.317 )
Norm@50keV  : 3.78739E-03    ( -0.00200988   0.0066049 )
------------------------------------------------------------
#Fit statistic : Chi-Squared =          41.12 using 59 PHA bins.
# Reduced chi-squared =         0.7343 for     56 degrees of freedom
# Null hypothesis probability =   9.318330e-01

Photon flux (15-150 keV)    in 14.75 sec: 0.473461 ( -0.047963  0.047057 ) ph/cm2/s
Energy fluence (15-150 keV)             : 4.61405e-07 ( -6.48696e-08  5.69794e-08 ) ergs/cm2
1-s peak spectrum fit
Power-law model
Time interval is from    0.184 sec. to    1.184 sec.

Spectral model in power-law:
------------------------------------------------------------
Parameters  : value       lower 90%   higher 90%
Photon index: -1.57664     ( -0.357902   0.344453 )
Norm@50keV  : 6.75070E-03    ( -0.00147938   0.00144931 )
------------------------------------------------------------
#Fit statistic : Chi-Squared =          44.24 using 59 PHA bins.
# Reduced chi-squared =         0.7761 for     57 degrees of freedom
# Null hypothesis probability =   8.915194e-01

Photon flux (15-150 keV)    in 1 sec: 0.861364 ( -0.17563  0.175826 ) ph/cm2/s
Energy fluence (15-150 keV)             : 6.33286e-08 ( -1.47327e-08  1.51082e-08 ) ergs/cm2
Cutoff power-law model
Time interval is from    0.184 sec. to    1.184 sec.
Spectral model in the cutoff power-law:
------------------------------------------------------------
Parameters  : value       lower 90%   higher 90%
Photon index: -0.978177     ( -0.907957   1.02667 )
Epeak [keV] : 79.3276      (   )
Norm@50keV  : 1.41796E-02    (     )
------------------------------------------------------------
#Fit statistic : Chi-Squared =          43.62 using 59 PHA bins.
# Reduced chi-squared =         0.7790 for     56 degrees of freedom
# Null hypothesis probability =   8.857956e-01

Photon flux (15-150 keV)    in 1 sec: 0.843040 ( -0.180359  0.18023 ) ph/cm2/s
Energy fluence (15-150 keV)             : 6.00095e-08 ( -1.63388e-08  1.66931e-08 ) ergs/cm2
Time-resolved spectra

Distribution
T90 vs. Hardness ratio plot
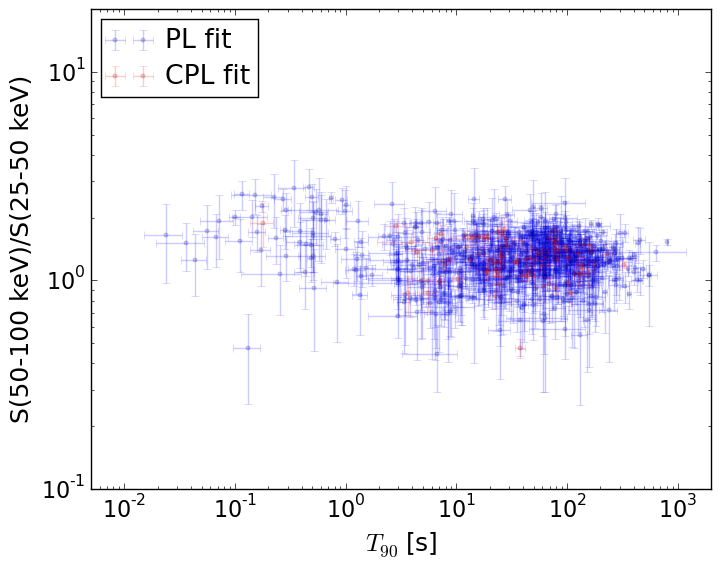
T90                                   = N/A sec.
Hardness ratio (energy fluence ratio) = N/A
S(15-50 keV) vs. S(50-150 keV) plot
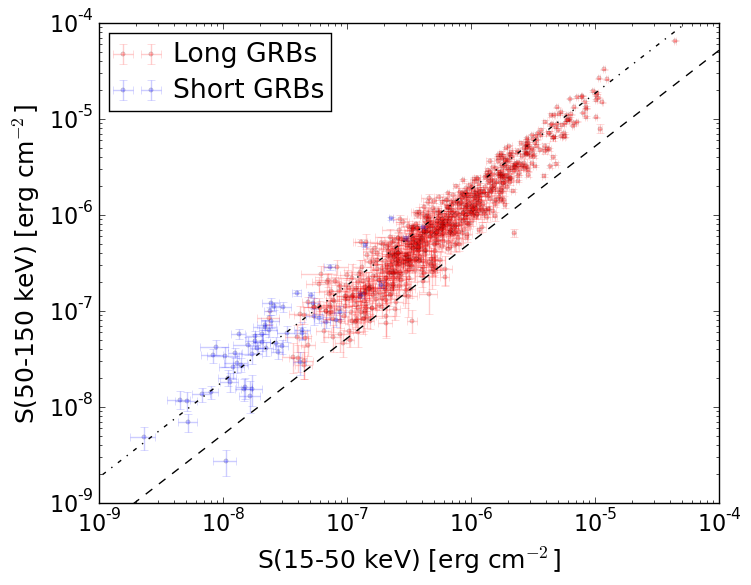
S(15-50 keV)  = N/A
S(50-150 keV) = N/A
The dash-dotted line and the dashed line traces the fluences calculated from the Band function with Epeak = 15 and 150 keV, respectively. Both lines assume a canonical values of alpha = -1 and beta = -2.5.
Mask shadow pattern
IMX = -7.208831570264456E-01, IMY = 2.874164623184512E-01
Spacecraft aspect plot
Bright source in the pre-burst/pre-slew/post-slew images
Pre-burst image of 15-350 keV band
Time interval of the image:
-27.899400 -1.200000

# RAcent  DECcent POSerr Theta    Phi  PeakCts   SNR AngSep     Name
#  [deg]    [deg]    ['] [deg]  [deg]                   [']
153.2197  -2.4514    2.2  50.0   30.6   1.1404   5.3 ------	UNKNOWN
125.5825  17.7411    2.0  29.6   74.7   0.4329   5.7 ------	UNKNOWN
 97.5377  39.4994    2.1  29.8  143.8   0.3538   5.5 ------	UNKNOWN
126.4748  29.0488    2.5  18.7   82.7   0.2397   4.6 ------	UNKNOWN
151.8331  17.2636    2.2  30.8   23.8   0.3154   5.3 ------	UNKNOWN
205.8990  65.8294    3.0  40.7  -93.1   0.7221   3.8 ------	UNKNOWN
Pre-slew background subtracted image of 15-350 keV band
Time interval of the image:
-1.200000 13.548000

# RAcent  DECcent POSerr Theta    Phi  PeakCts   SNR AngSep     Name
#  [deg]    [deg]    ['] [deg]  [deg]                   [']
138.8304   0.0306    2.1  45.6   49.4   1.0380   5.5 ------	UNKNOWN
 71.0440  39.3607    3.3  48.0  158.7   0.4352   3.5 ------	UNKNOWN
150.5175  18.5246    2.6  29.2   25.3   0.2588   4.5 ------	UNKNOWN
 77.1049  69.7250    0.8  37.8 -158.3   0.8451  14.1 ------	UNKNOWN
181.3243  64.6652    2.4  30.4  -93.1   0.3429   4.7 ------	UNKNOWN
Post-slew image of 15-350 keV band
Time interval of the image:
89.300590 302.276800

# RAcent  DECcent POSerr Theta    Phi  PeakCts   SNR AngSep     Name
#  [deg]    [deg]    ['] [deg]  [deg]                   [']
 83.6282  22.0211    0.9  47.9  139.3   9.4691  12.6    0.5	Crab
117.8743  37.1133    2.1  39.2   92.0   3.4304   5.4 ------	UNKNOWN
158.2590  49.1733    2.8  41.9   43.0   1.7101   4.1 ------	UNKNOWN
171.6323  67.4856    3.0  31.2   15.2   0.7157   3.9 ------	UNKNOWN
 72.4904  54.6961    2.7  15.2  157.6   0.6567   4.3 ------	UNKNOWN
307.2821  61.8627    3.3  43.7  -64.0   2.6007   3.5 ------	UNKNOWN