Analysis Summary
Notes:
- 1) No attempt has been made to eliminate the non-significant decimal places.
- 2) This batgrbproduct analysis is done using the HEASARC data.
- 3) This batgrbproduct analysis is using the flight position for the mask-weighting calculation.
======================================================================
                  BAT GRB EVENT DATA PROCESSING REPORT
    Process Script Ver: batgrbproduct v2.46
    Process Start Time: Wed Jan 22 18:36:24 EST 2014
             Host Name: batevent1
   Current Working Dir: /local/data/batevent/batevent_reproc/trigger180455
======================================================================

  Trigger: 00180455      Segment: 000

  BAT Trigger Time: 160894014.272   [s; MET]
      Trigger Stop: 160894014.784   [s; MET]
               UTC: 2006-02-06T04:46:53.272980    [includes UTCF correction]
       Where From?: TDRSS position message

  BAT
    RA: 202.945915510309   Dec: 35.0746795454092  [deg; J2000]

     Catalogged Source?: NO
     Point Source?:      YES
     GRB Indicated?:     YES    [ by BAT flight software ]
     Image S/N Ratio:    10.17
     Image Trigger?:     NO
     Rate S/N Ratio:     21.6101827849743  [ if not an image trigger ]
     Image S/N Ratio:    10.17

  Analysis Position:   [ source = BAT ]
    RA: 202.945915510309   Dec: 35.0746795454092  [deg; J2000]

  Refined Position:   [ source = BAT pre-slew burst ]
    RA: 202.926266819124   Dec: 35.0487009607381  [deg; J2000]
        { 13h 31m 42.3s , +35d 02' 55.3" }
         +/- 0.740087339634266 [arcmin] (estimated 90% radius based on SNR)
         +/- 0.266910144013129 [arcmin] (formal 1-sigma fit error)
    SNR: 46.7581141821739

  Angular difference between the analysis and refined position is 1.833247 arcmin

  Partial Coding Fraction: 0.984375    [ including projection effects ]

  Duration
     T90: 7.55199998617172 +/- 2.19293410472785
        Measured from: 0.151999980211258
                   to: 7.70399996638298     [s; relative to TRIGTIME]
     T50: 2.31999996304512 +/- 0.217623546282162
        Measured from: 1.60799998044968
                   to: 3.9279999434948     [s; relative to TRIGTIME]


  Fluence
     Peak Flux  (peak 1 second)
        Measured from: 2.1879999935627
                   to: 3.1879999935627     [s; relative to TRIGTIME]
     Total Fluence
        Measured from: -0.552000015974045
                   to: 13.7039999961853     [s; relative to TRIGTIME]

             Band 1     Band 2     Band 3     Band 4
              15-25      25-50     50-100    100-350     keV
 Total     0.478100   0.608008   0.397488   0.075180
           0.018764   0.019797   0.016876   0.013300 [error]
 Peak      0.109125   0.140524   0.099633   0.020325
           0.006034   0.006597   0.005567   0.003854 [error]

     [ fluence units of on-axis counts / fully illuminated detector ]

======================================================================


====== Table of the duration information =============================

        Value   tstart    tstop
T100   14.256   -0.552   13.704
T90     7.552    0.152    7.704
T50     2.320    1.608    3.928
Peak    1.000    2.188    3.188


====== Spectral Analysis Summary =====================================

Model      : spectral model: simple power-law (PL) and cutoff power-law (CPL)
Ph_index   : photon index: E^{Ph_index}
Ph_90err   : 90% error of the photon index
Epeak      : Epeak in keV
Epeak_90err: 90% error of Epeak
Norm       : normalization at 50 keV in both the PL model and CPL model
Nomr_90err : 90% error of the normalization
chi2       : Chi-Squared
dof        : degree of freedo

=== Time-averaged spectral analysis ===
(Best model with acceptable fit: CPL)

Model Ph_index Ph_90err_low Ph_90err_hi  Epeak  Epeak_90err_low  Epeak_90err_hi  Norm       Nomr_90err_low    Norm_90err_hi    chi2    dof
PL      -1.656    -0.074      0.073       -           -               -         6.65e-03     -2.77e-04          2.76e-04      68.380   57
CPL     -1.120    -0.296      0.317       80.744     -13.989        38.830      1.24e-02     -3.54e-03          5.41e-03      58.210   56


=== 1-s peak spectral analysis ===
(Best model with acceptable fit: CPL)

Model Ph_index Ph_90err_low Ph_90err_hi  Epeak  Epeak_90err_low  Epeak_90err_hi  Norm       Nomr_90err_low    Norm_90err_hi    chi2    dof
PL      -1.575     -0.092     0.091       -           -               -         2.24e-02     -1.25e-03          1.24e-03      67.030   57
CPL     -0.909     -0.369     0.404       81.764     -14.661        39.982      4.87e-02     -1.66e-02          2.83e-02      56.810   56


=== Fluence/Peak Flux Summary ===

              Model    Band1     Band2     Band3     Band4     Band5     Total
                       15-25     25-50    50-100    100-350    15-150    15-350    keV
Fluence         PL   1.40e-07  2.34e-07  2.97e-07  7.54e-07  8.81e-07  1.43e-06   erg/cm2
      90%_error_low -9.60e-09 -9.76e-09 -1.65e-08 -8.62e-08 -3.89e-08 -9.97e-08   erg/cm2
      90%_error_hi   9.82e-09  9.74e-09  1.65e-08  9.34e-08  3.91e-08  1.05e-07   erg/cm2
Peak flux       PL   9.91e-01  9.54e-01  6.41e-01  6.72e-01  2.86e+00  3.26e+00   ph/cm2/s
      90%_error_low -8.77e-02 -5.38e-02 -4.48e-02 -9.01e-02 -1.56e-01 -1.75e-01   ph/cm2/s
      90%_error_hi   9.00e-02  5.36e-02  4.46e-02  9.80e-02  1.56e-01  1.76e-01   ph/cm2/s

Fluence        CPL   1.28e-07  2.46e-07  3.04e-07  3.55e-07  8.42e-07  1.03e-06   erg/cm2
      90%_error_low -1.16e-08 -1.17e-08 -1.79e-08 -1.10e-07 -4.41e-08 -1.19e-07   erg/cm2
      90%_error_hi   1.18e-08  1.18e-08  1.80e-08  1.71e-07  4.42e-08  1.74e-07   erg/cm2
Peak flux      CPL   8.79e-01  1.01e+00  6.75e-01  3.40e-01  2.78e+00  2.91e+00   ph/cm2/s
      90%_error_low -1.06e-01 -6.38e-02 -5.09e-02 -1.03e-01 -1.62e-01 -1.97e-01   ph/cm2/s
      90%_error_hi   1.07e-01  6.48e-02  5.16e-02  1.50e-01  1.62e-01  2.16e-01   ph/cm2/s

======================================================================
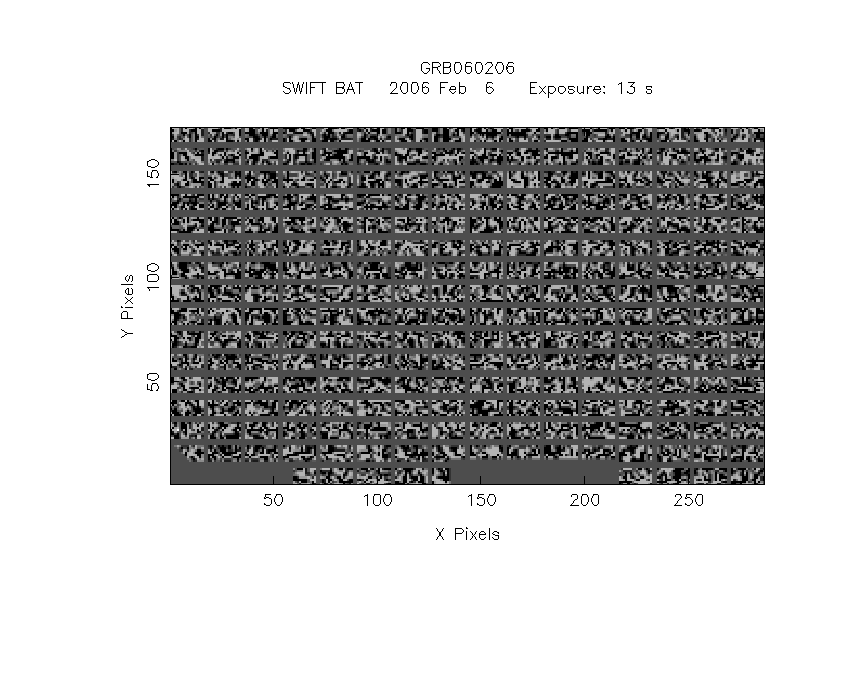
Image
Pre-slew 15.0-350.0 keV image (Event data)
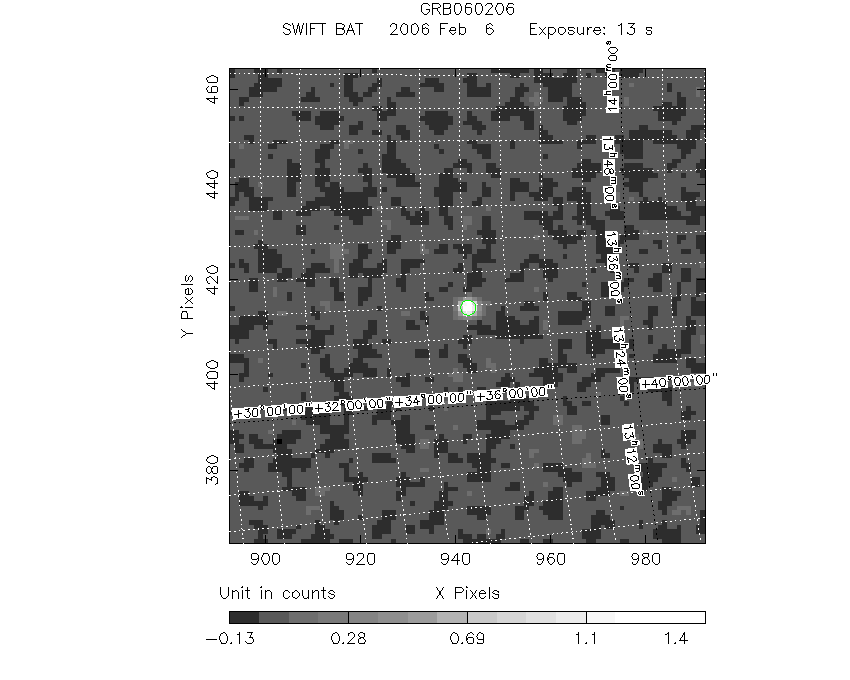
#   RAcent    DECcent   POSerr    Theta     Phi              Peak Cts       SNR   Name
  202.9263    35.0487   0.0041    10.5637   135.2489         1.5969903     46.758 TRIG_00180455

Foreground time interval of the image:
 -0.552  12.029 (delta_t =  12.581 [sec])
Background time interval of the image:
-299.272  -0.552 (delta_t = 298.720 [sec])
Light Curves
Note: The mask-weighted lightcurves have units of either count/det or counts/sec/det, where a det is 0.4 x 0.4 = 0.16 sq cm.
Full-time range; 1 s binning
Other quick-look light curves:
- 64 ms binning (zoomed)
- 16 ms binning (zoomed)
- 8 ms binning (zoomed)
- 2 ms binning (zoomed)
- SN=5 or 10 s binning (full-time range)
- Raw light curve
Spectra
- 64 ms binning (zoomed)
- 16 ms binning (zoomed)
- 8 ms binning (zoomed)
- 2 ms binning (zoomed)
- SN=5 or 10 s binning (full-time range)
- Raw light curve
Spectra
Notes:
- 1) The fitting includes the systematic errors.
- 2) When the burst includes telescope slew time periods, the fitting uses an average response file made from multiple 5-s response files through out the slew time plus single time preiod for the non-slew times, and weighted by the total counts in the corresponding time period using addrmf. An average response file is needed becuase a spectral fit using the pre-slew DRM will introduce some errors in both a spectral shape and a normalization if the PHA file contains a lot of the slew/post-slew time interval.
- 3) For fits to more complicated models (e.g. a power-law over a cutoff power-law), the BAT team has decided to require a chi-square improvement of more than 6 for each extra dof.
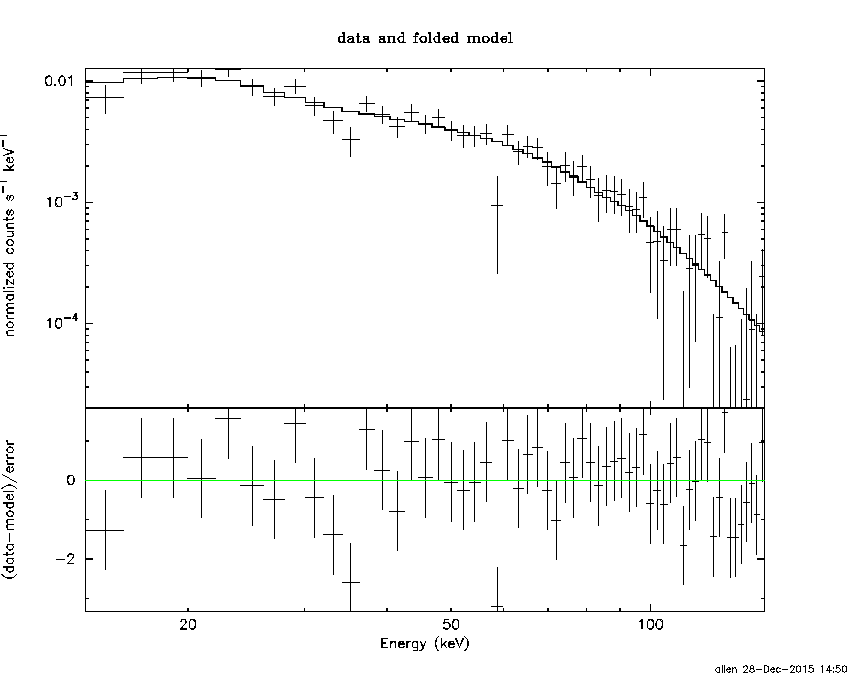
Time averaged spectrum fit using the average DRM
Power-law model
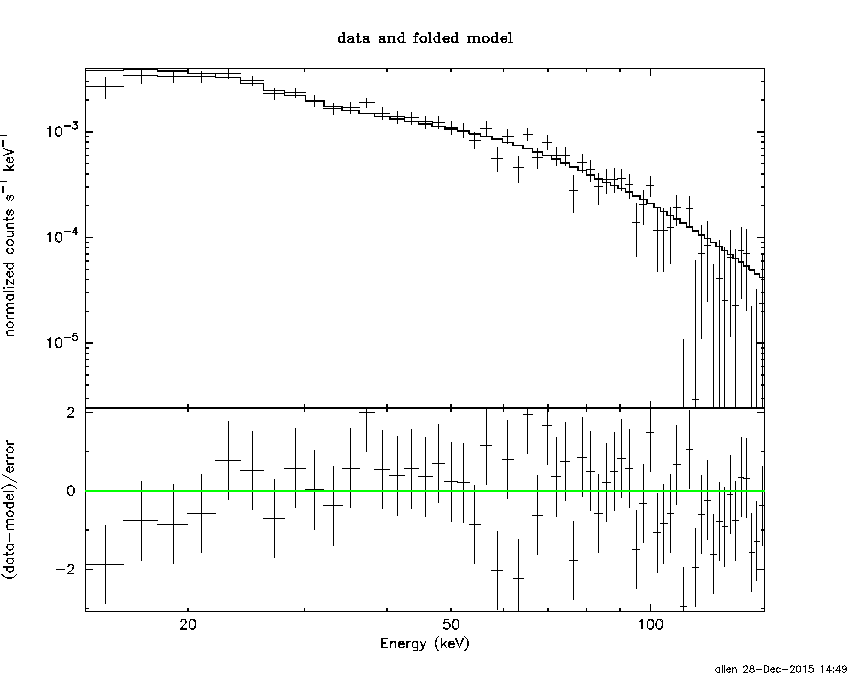
Time interval is from   -0.552 sec. to   13.704 sec.

Spectral model in power-law:
------------------------------------------------------------
Parameters  : value       lower 90%   higher 90%
Photon index: -1.65649     ( -0.0735936   0.0730523 )
Norm@50keV  : 6.64726E-03    ( -0.000277337   0.00027649 )
------------------------------------------------------------
#Fit statistic : Chi-Squared =          68.38 using 59 PHA bins.
# Reduced chi-squared =          1.200 for     57 degrees of freedom
# Null hypothesis probability =   1.437842e-01

Photon flux (15-150 keV)    in 14.26 sec: 0.869868 ( -0.036168  0.036229 ) ph/cm2/s
Energy fluence (15-150 keV)             : 8.8115e-07 ( -3.8922e-08  3.90869e-08 ) ergs/cm2
Cutoff power-law model
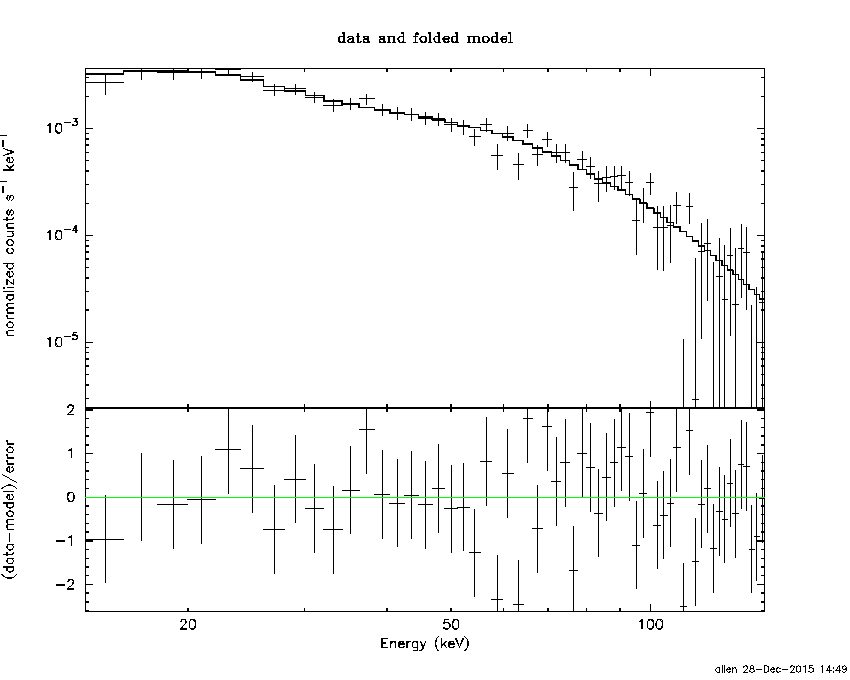
Time interval is from   -0.552 sec. to   13.704 sec.
Spectral model in the cutoff power-law:
------------------------------------------------------------
Parameters  : value       lower 90%   higher 90%
Photon index: -1.1196     ( -0.295842   0.317429 )
Epeak [keV] : 80.7440      ( -13.9887 38.8297 )
Norm@50keV  : 1.24180E-02    ( -0.00353821   0.00541264 )
------------------------------------------------------------
#Fit statistic : Chi-Squared =          58.21 using 59 PHA bins.
# Reduced chi-squared =          1.039 for     56 degrees of freedom
# Null hypothesis probability =   3.940565e-01

Photon flux (15-150 keV)    in 14.26 sec: 0.842503 ( -0.038872  0.038925 ) ph/cm2/s
Energy fluence (15-150 keV)             : 8.42344e-07 ( -4.40928e-08  4.4219e-08 ) ergs/cm2
1-s peak spectrum fit
Power-law model
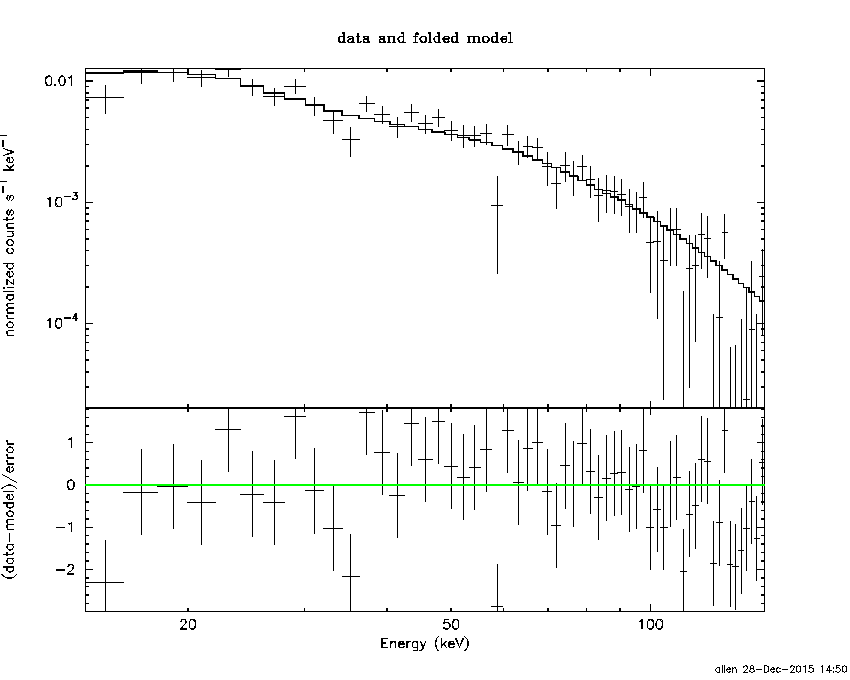
Time interval is from    2.188 sec. to    3.188 sec.

Spectral model in power-law:
------------------------------------------------------------
Parameters  : value       lower 90%   higher 90%
Photon index: -1.57464     ( -0.0919445   0.0910211 )
Norm@50keV  : 2.24099E-02    ( -0.00124625   0.00124175 )
------------------------------------------------------------
#Fit statistic : Chi-Squared =          67.03 using 59 PHA bins.
# Reduced chi-squared =          1.176 for     57 degrees of freedom
# Null hypothesis probability =   1.707433e-01

Photon flux (15-150 keV)    in 1 sec: 2.85771 ( -0.15583  0.15597 ) ph/cm2/s
Energy fluence (15-150 keV)             : 2.10286e-07 ( -1.25799e-08  1.26499e-08 ) ergs/cm2
Cutoff power-law model
Time interval is from    2.188 sec. to    3.188 sec.
Spectral model in the cutoff power-law:
------------------------------------------------------------
Parameters  : value       lower 90%   higher 90%
Photon index: -0.908684     ( -0.368718   0.403667 )
Epeak [keV] : 81.7643      ( -14.661 39.9821 )
Norm@50keV  : 4.87048E-02    ( -0.016647   0.0282783 )
------------------------------------------------------------
#Fit statistic : Chi-Squared =          56.81 using 59 PHA bins.
# Reduced chi-squared =          1.014 for     56 degrees of freedom
# Null hypothesis probability =   4.446123e-01

Photon flux (15-150 keV)    in 1 sec: 2.77740 ( -0.16188  0.16186 ) ph/cm2/s
Energy fluence (15-150 keV)             : 2.01164e-07 ( -1.35868e-08  1.36339e-08 ) ergs/cm2
Time-resolved spectra
Distribution
T90 vs. Hardness ratio plot
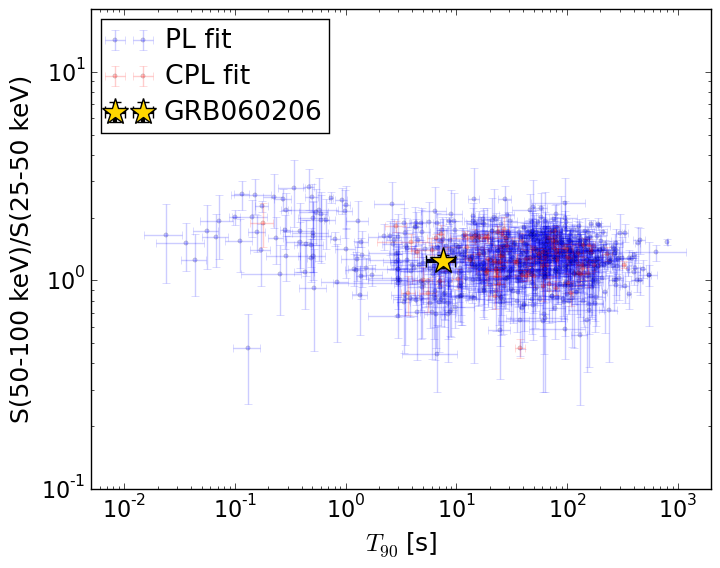
T90                                   = 7.552 sec.
Hardness ratio (energy fluence ratio) = 1.23677312851
S(15-50 keV) vs. S(50-150 keV) plot
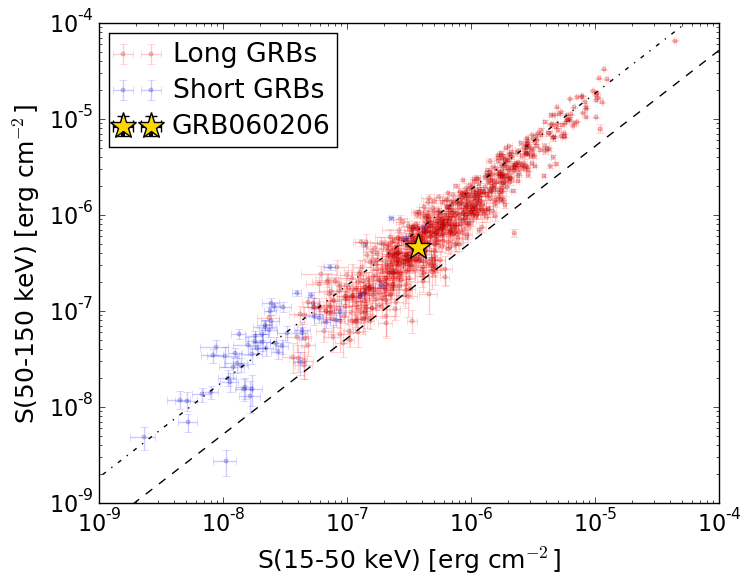
S(15-50 keV)  = 3.732847e-07
S(50-150 keV) = 4.690596e-07
The dash-dotted line and the dashed line traces the fluences calculated from the Band function with Epeak = 15 and 150 keV, respectively. Both lines assume a canonical values of alpha = -1 and beta = -2.5.
Mask shadow pattern
IMX = -1.324393011074071E-01, IMY = -1.312938220606079E-01
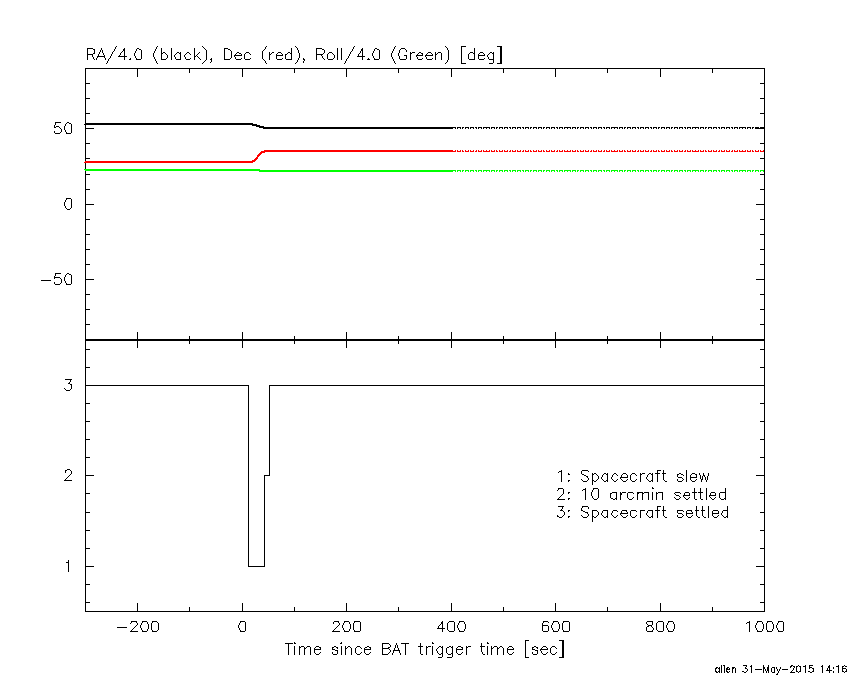
Spacecraft aspect plot
Bright source in the pre-burst/pre-slew/post-slew images
Pre-burst image of 15-350 keV band
Time interval of the image:
-299.272000 -0.552000

# RAcent  DECcent POSerr Theta    Phi  PeakCts   SNR AngSep     Name
#  [deg]    [deg]    ['] [deg]  [deg]                   [']
254.4658  35.4832    6.0  36.9 -114.5   0.7247   1.9    8.5	Her X-1
184.3975  21.9940    2.2  25.4   81.9   1.2385   5.3 ------	UNKNOWN
168.1591  66.2678    2.5  46.9  156.3   2.3262   4.6 ------	UNKNOWN
195.4492  61.4398    2.1  35.5  165.3   1.3211   5.5 ------	UNKNOWN
266.9563  76.9512    2.5  55.5 -168.4   3.0460   4.6 ------	UNKNOWN
Pre-slew background subtracted image of 15-350 keV band
Time interval of the image:
-0.552000 12.028590

# RAcent  DECcent POSerr Theta    Phi  PeakCts   SNR AngSep     Name
#  [deg]    [deg]    ['] [deg]  [deg]                   [']
254.5612  35.1501    0.0  37.0 -114.0  -0.0959  -1.3   12.6	Her X-1
202.9263  35.0487    0.2  10.6  135.2   1.5970  46.8 ------	UNKNOWN
257.5195  25.0380    2.1  40.8  -98.5   0.8224   5.4 ------	UNKNOWN
Post-slew image of 15-350 keV band
Time interval of the image:
42.028590 302.768000

# RAcent  DECcent POSerr Theta    Phi  PeakCts   SNR AngSep     Name
#  [deg]    [deg]    ['] [deg]  [deg]                   [']
254.3311  35.2731   16.1  41.5 -103.9  -2.8887  -0.7    7.5	Her X-1
173.8383   6.3951    2.2  39.2   51.8  10.7148   5.2 ------	UNKNOWN
214.2829 -21.7469    2.4  57.8  -10.6  25.9647   4.8 ------	UNKNOWN