Analysis Summary
Notes:
- 1) No attempt has been made to eliminate the non-significant decimal places.
- 2) This batgrbproduct analysis is done using the HEASARC data.
- 3) This batgrbproduct analysis is using the flight position for the mask-weighting calculation.
======================================================================
                  BAT GRB EVENT DATA PROCESSING REPORT
    Process Script Ver: batgrbproduct v2.46
    Process Start Time: Wed Jan 22 18:27:44 EST 2014
             Host Name: batevent1
   Current Working Dir: /local/data/batevent/batevent_reproc/trigger181156
======================================================================

  Trigger: 00181156      Segment: 000

  BAT Trigger Time: 161366115.776   [s; MET]
      Trigger Stop: 161366117.824   [s; MET]
               UTC: 2006-02-11T15:55:14.766340    [includes UTCF correction]
       Where From?: TDRSS position message

  BAT
    RA: 75.0691948313119   Dec: 14.9576753746448  [deg; J2000]

     Catalogged Source?: NO
     Point Source?:      YES
     GRB Indicated?:     YES    [ by BAT flight software ]
     Image S/N Ratio:    9.03
     Image Trigger?:     NO
     Rate S/N Ratio:     12.0415945787923  [ if not an image trigger ]
     Image S/N Ratio:    9.03

  Analysis Position:   [ source = BAT ]
    RA: 75.0691948313119   Dec: 14.9576753746448  [deg; J2000]

  Refined Position:   [ source = BAT pre-slew burst ]
    RA: 75.0873722943272   Dec: 14.9565948837379  [deg; J2000]
        { 05h 00m 21.0s , +14d 57' 23.7" }
         +/- 1.90497482370044 [arcmin] (estimated 90% radius based on SNR)
         +/- 0.871899173161477 [arcmin] (formal 1-sigma fit error)
    SNR: 12.1136942543681

  Angular difference between the analysis and refined position is 1.055688 arcmin

  Partial Coding Fraction: 0.828125    [ including projection effects ]

  Duration
     T90: 27.7319999933243 +/- 7.75354601999308
        Measured from: -9.84399998188019
                   to: 17.8880000114441     [s; relative to TRIGTIME]
     T50: 7.78400000929832 +/- 5.45012000271962
        Measured from: -0.599999994039536
                   to: 7.18400001525879     [s; relative to TRIGTIME]


  Fluence
     Peak Flux  (peak 1 second)
        Measured from: 1.83599999547005
                   to: 2.83599999547005     [s; relative to TRIGTIME]
     Total Fluence
        Measured from: -10.5959999859333
                   to: 19.1599999964237     [s; relative to TRIGTIME]

             Band 1     Band 2     Band 3     Band 4
              15-25      25-50     50-100    100-350     keV
 Total     0.188488   0.282994   0.208351   0.049005
           0.028734   0.029731   0.025747   0.022034 [error]
 Peak      0.020197   0.037809   0.028139   0.009027
           0.005402   0.005646   0.004889   0.003960 [error]

     [ fluence units of on-axis counts / fully illuminated detector ]

======================================================================


====== Table of the duration information =============================

        Value   tstart    tstop
T100   29.756  -10.596   19.160
T90    27.732   -9.844   17.888
T50     7.784   -0.600    7.184
Peak    1.000    1.836    2.836


====== Spectral Analysis Summary =====================================

Model      : spectral model: simple power-law (PL) and cutoff power-law (CPL)
Ph_index   : photon index: E^{Ph_index}
Ph_90err   : 90% error of the photon index
Epeak      : Epeak in keV
Epeak_90err: 90% error of Epeak
Norm       : normalization at 50 keV in both the PL model and CPL model
Nomr_90err : 90% error of the normalization
chi2       : Chi-Squared
dof        : degree of freedo

=== Time-averaged spectral analysis ===
(Best model with acceptable fit: PL)

Model Ph_index Ph_90err_low Ph_90err_hi  Epeak  Epeak_90err_low  Epeak_90err_hi  Norm       Nomr_90err_low    Norm_90err_hi    chi2    dof
PL      -1.529    -0.207      0.204       -           -               -         1.58e-03     -1.94e-04          1.92e-04      44.270   57
CPL     -1.194    -0.509      0.848      116.965    -116.965      -116.965      2.36e-03        N/A               N/A         43.660   56


=== 1-s peak spectral analysis ===
(Best model with acceptable fit: PL)

Model Ph_index Ph_90err_low Ph_90err_hi  Epeak  Epeak_90err_low  Epeak_90err_hi  Norm       Nomr_90err_low    Norm_90err_hi    chi2    dof
PL      -1.406     -0.281     0.280       -           -               -         6.06e-03     -1.05e-03          1.04e-03      42.410   57
CPL     -0.606     -0.930     1.392       84.421     -30.737       -84.421      1.58e-02     -1.58e-02          6.59e-02      40.840   56


=== Fluence/Peak Flux Summary ===

              Model    Band1     Band2     Band3     Band4     Band5     Total
                       15-25     25-50    50-100    100-350    15-150    15-350    keV
Fluence         PL   6.18e-08  1.12e-07  1.55e-07  4.46e-07  4.45e-07  7.74e-07   erg/cm2
      90%_error_low -1.14e-08 -1.32e-08 -2.51e-08 -1.36e-07 -5.96e-08 -1.60e-07   erg/cm2
      90%_error_hi   1.19e-08  1.31e-08  2.51e-08  1.72e-07  6.06e-08  1.89e-07   erg/cm2
Peak flux       PL   2.28e-01  2.43e-01  1.83e-01  2.25e-01  7.39e-01  8.78e-01   ph/cm2/s
      90%_error_low -6.20e-02 -4.39e-02 -3.90e-02 -8.29e-02 -1.26e-01 -1.53e-01   ph/cm2/s
      90%_error_hi   6.65e-02  4.34e-02  3.86e-02  1.09e-01  1.26e-01  1.56e-01   ph/cm2/s

Fluence        CPL   5.88e-08  1.16e-07  1.57e-07  2.63e-07  4.32e-07  5.95e-07   erg/cm2
      90%_error_low -1.34e-08 -1.56e-08 -2.65e-08 -1.72e-07 -6.54e-08 -1.86e-07   erg/cm2
      90%_error_hi   1.34e-08  1.65e-08  2.71e-08  3.35e-07  6.61e-08  2.44e-07   erg/cm2
Peak flux      CPL   2.01e-01  2.64e-01  1.93e-01  9.46e-02  7.19e-01  7.53e-01   ph/cm2/s
      90%_error_low -7.22e-02 -5.30e-02 -4.41e-02 -9.46e-02 -1.29e-01 -1.50e-01   ph/cm2/s
      90%_error_hi   7.55e-02  5.62e-02  4.52e-02  1.68e-01  1.29e-01  2.19e-01   ph/cm2/s

======================================================================
Image
Pre-slew 15.0-350.0 keV image (Event data)
#   RAcent    DECcent   POSerr    Theta     Phi              Peak Cts       SNR   Name
   75.0874    14.9566   0.0158    17.1565   121.5554         0.7351997     12.114 TRIG_00181156

Foreground time interval of the image:
-10.596  19.160 (delta_t =  29.756 [sec])
Background time interval of the image:
-299.776 -10.596 (delta_t = 289.180 [sec])
Light Curves
Note: The mask-weighted lightcurves have units of either count/det or counts/sec/det, where a det is 0.4 x 0.4 = 0.16 sq cm.
Full-time range; 1 s binning
Other quick-look light curves:
- 64 ms binning (zoomed)
- 16 ms binning (zoomed)
- 8 ms binning (zoomed)
- 2 ms binning (zoomed)
- SN=5 or 10 s binning (full-time range)
- Raw light curve
Spectra
- 64 ms binning (zoomed)
- 16 ms binning (zoomed)
- 8 ms binning (zoomed)
- 2 ms binning (zoomed)
- SN=5 or 10 s binning (full-time range)
- Raw light curve
Spectra
Notes:
- 1) The fitting includes the systematic errors.
- 2) When the burst includes telescope slew time periods, the fitting uses an average response file made from multiple 5-s response files through out the slew time plus single time preiod for the non-slew times, and weighted by the total counts in the corresponding time period using addrmf. An average response file is needed becuase a spectral fit using the pre-slew DRM will introduce some errors in both a spectral shape and a normalization if the PHA file contains a lot of the slew/post-slew time interval.
- 3) For fits to more complicated models (e.g. a power-law over a cutoff power-law), the BAT team has decided to require a chi-square improvement of more than 6 for each extra dof.
Time averaged spectrum fit using the average DRM
Power-law model
Time interval is from  -10.596 sec. to   19.160 sec.

Spectral model in power-law:
------------------------------------------------------------
Parameters  : value       lower 90%   higher 90%
Photon index: -1.52947     ( -0.207509   0.203657 )
Norm@50keV  : 1.58174E-03    ( -0.000193943   0.00019165 )
------------------------------------------------------------
#Fit statistic : Chi-Squared =          44.27 using 59 PHA bins.
# Reduced chi-squared =         0.7766 for     57 degrees of freedom
# Null hypothesis probability =   8.909251e-01

Photon flux (15-150 keV)    in 29.76 sec: 0.199074 ( -0.023071  0.023089 ) ph/cm2/s
Energy fluence (15-150 keV)             : 4.44543e-07 ( -5.96209e-08  6.05634e-08 ) ergs/cm2
Cutoff power-law model
Time interval is from  -10.596 sec. to   19.160 sec.
Spectral model in the cutoff power-law:
------------------------------------------------------------
Parameters  : value       lower 90%   higher 90%
Photon index: -1.19403     ( -0.508552   0.84836 )
Epeak [keV] : 116.965      ( -116.965 -116.965 )
Norm@50keV  : 2.36018E-03    (     )
------------------------------------------------------------
#Fit statistic : Chi-Squared =          43.66 using 59 PHA bins.
# Reduced chi-squared =         0.7797 for     56 degrees of freedom
# Null hypothesis probability =   8.849915e-01

Photon flux (15-150 keV)    in 29.76 sec: 0.196168 ( -0.023966  0.023917 ) ph/cm2/s
Energy fluence (15-150 keV)             : 4.3205e-07 ( -6.53565e-08  6.61148e-08 ) ergs/cm2
1-s peak spectrum fit
Power-law model
Time interval is from    1.836 sec. to    2.836 sec.

Spectral model in power-law:
------------------------------------------------------------
Parameters  : value       lower 90%   higher 90%
Photon index: -1.40603     ( -0.281171   0.279816 )
Norm@50keV  : 6.06050E-03    ( -0.00105046   0.00104335 )
------------------------------------------------------------
#Fit statistic : Chi-Squared =          42.41 using 59 PHA bins.
# Reduced chi-squared =         0.7440 for     57 degrees of freedom
# Null hypothesis probability =   9.251758e-01

Photon flux (15-150 keV)    in 1 sec: 0.739082 ( -0.125908  0.126065 ) ph/cm2/s
Energy fluence (15-150 keV)             : 5.84965e-08 ( -1.11509e-08  1.1346e-08 ) ergs/cm2
Cutoff power-law model
Time interval is from    1.836 sec. to    2.836 sec.
Spectral model in the cutoff power-law:
------------------------------------------------------------
Parameters  : value       lower 90%   higher 90%
Photon index: -0.606056     ( -0.929722   1.39214 )
Epeak [keV] : 84.4210      ( -30.7367 -84.421 )
Norm@50keV  : 1.58189E-02    ( -0.0158189   0.0658649 )
------------------------------------------------------------
#Fit statistic : Chi-Squared =          40.84 using 59 PHA bins.
# Reduced chi-squared =         0.7292 for     56 degrees of freedom
# Null hypothesis probability =   9.360799e-01

Photon flux (15-150 keV)    in 1 sec: 0.719138 ( -0.129062  0.12908 ) ph/cm2/s
Energy fluence (15-150 keV)             : 5.48302e-08 ( -1.21034e-08  1.2421e-08 ) ergs/cm2
Time-resolved spectra
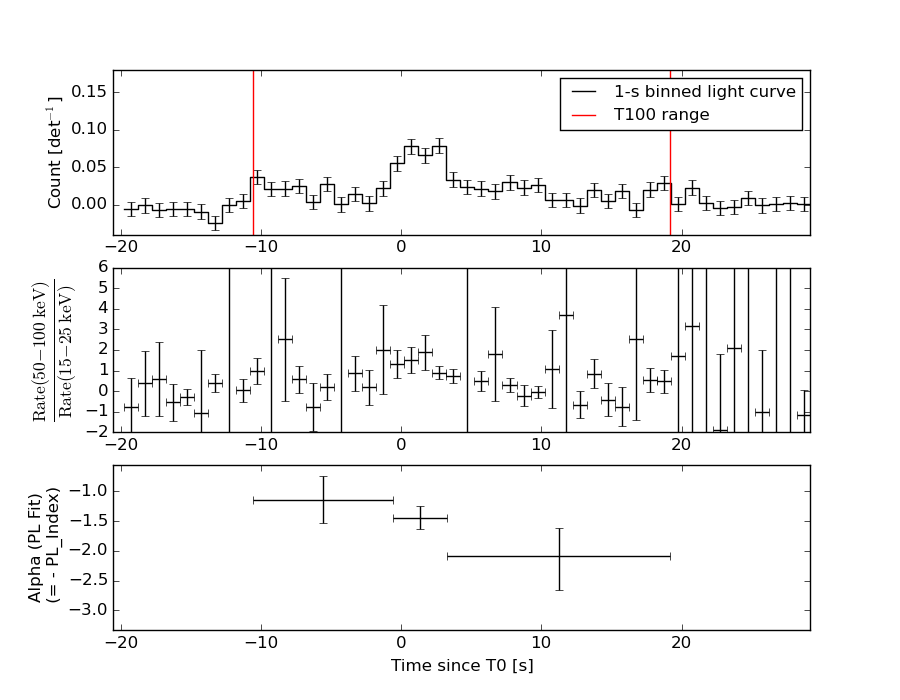
Distribution
T90 vs. Hardness ratio plot
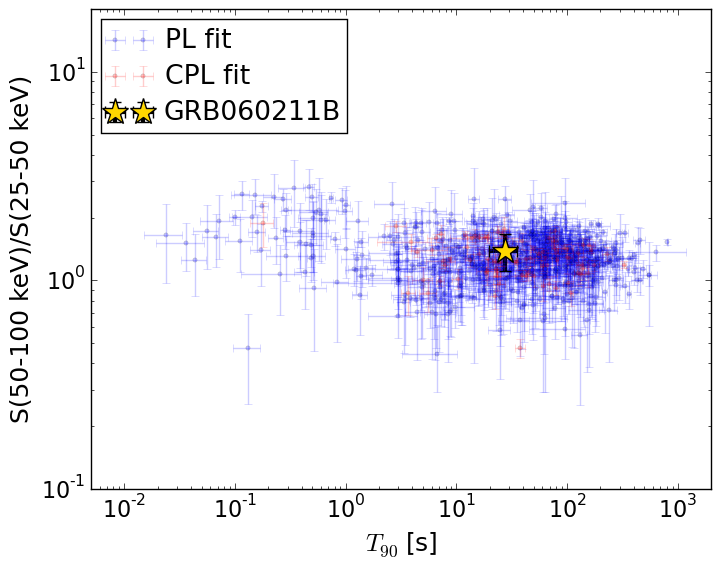
T90                                   = 27.732 sec.
Hardness ratio (energy fluence ratio) = 1.38567041047
S(15-50 keV) vs. S(50-150 keV) plot

S(15-50 keV)  = 1.7330959e-07
S(50-150 keV) = 2.712351e-07
The dash-dotted line and the dashed line traces the fluences calculated from the Band function with Epeak = 15 and 150 keV, respectively. Both lines assume a canonical values of alpha = -1 and beta = -2.5.
Mask shadow pattern
IMX = -1.615595728491372E-01, IMY = -2.630701998202375E-01
Spacecraft aspect plot
Bright source in the pre-burst/pre-slew/post-slew images
Pre-burst image of 15-350 keV band
Time interval of the image:
-299.776000 -10.596000

# RAcent  DECcent POSerr Theta    Phi  PeakCts   SNR AngSep     Name
#  [deg]    [deg]    ['] [deg]  [deg]                   [']
 83.6433  22.0222    0.3  23.4   95.9  11.9561  44.8    0.7	Crab
 99.6132  57.8483    2.8  46.9   40.6   3.7603   4.2 ------	UNKNOWN
 56.3156 -37.4762    3.2  59.0 -166.2   4.6126   3.6 ------	UNKNOWN
  2.2546  39.0918    4.3  50.7  -44.5   3.2389   2.7 ------	UNKNOWN
 29.4724 -17.6625    2.7  48.3 -130.0   4.1272   4.2 ------	UNKNOWN
 18.8851   6.7559    3.3  40.9  -93.3   4.0025   3.5 ------	UNKNOWN
Pre-slew background subtracted image of 15-350 keV band
Time interval of the image:
-10.596000 19.160000

# RAcent  DECcent POSerr Theta    Phi  PeakCts   SNR AngSep     Name
#  [deg]    [deg]    ['] [deg]  [deg]                   [']
 83.4775  22.1363    6.2  23.3   95.7  -0.1300  -1.9   11.3	Crab
 83.7271  52.2945    2.2  36.5   38.1   0.5393   5.3 ------	UNKNOWN
 75.0874  14.9566    0.9  17.2  121.6   0.7353  12.1 ------	UNKNOWN
 54.1638  66.2189    2.0  44.8    9.5   0.6111   5.7 ------	UNKNOWN
 52.3324  27.4198    2.3   8.1  -29.8   0.2589   5.1 ------	UNKNOWN
 44.7379 -21.4179    2.8  44.9 -150.0   0.3737   4.1 ------	UNKNOWN
Post-slew image of 15-350 keV band
Time interval of the image:
67.324600 302.269900

# RAcent  DECcent POSerr Theta    Phi  PeakCts   SNR AngSep     Name
#  [deg]    [deg]    ['] [deg]  [deg]                   [']
 83.6348  22.0211    0.2  10.8   57.0  10.2718  60.9    0.4	Crab
 65.4606  42.5598    4.4  28.8   -5.6   0.5004   2.6 ------	UNKNOWN
 73.2125 -41.8642    2.8  56.9 -169.2   3.1058   4.2 ------	UNKNOWN
 28.1410  60.2034    2.6  56.5  -16.6   3.4306   4.4 ------	UNKNOWN
 34.3163  49.6594    2.8  47.9  -25.5   1.6742   4.1 ------	UNKNOWN
 23.4614  37.2391    3.1  50.6  -44.6   3.7556   4.2 ------	UNKNOWN
 23.2795  37.4221    3.9  50.8  -44.4   3.5611   4.0 ------	UNKNOWN