Analysis Summary
Notes:
- 1) No attempt has been made to eliminate the non-significant decimal places.
- 2) This batgrbproduct analysis is done using the HEASARC data.
- 3) This batgrbproduct analysis is using the flight position for the mask-weighting calculation.
======================================================================
                  BAT GRB EVENT DATA PROCESSING REPORT
    Process Script Ver: batgrbproduct v2.46
    Process Start Time: Wed Jan 22 18:22:38 EST 2014
             Host Name: batevent1
   Current Working Dir: /local/data/batevent/batevent_reproc/trigger191157
======================================================================

  Trigger: 00191157      Segment: 000

  BAT Trigger Time: 161926472   [s; MET]
      Trigger Stop: 161926552   [s; MET]
               UTC: 2006-02-18T03:34:30.977720    [includes UTCF correction]
       Where From?: TDRSS position message

  BAT
    RA: 50.4036197387777   Dec: 16.8660799646394  [deg; J2000]

     Catalogged Source?: NO
     Point Source?:      YES
     GRB Indicated?:     YES    [ by BAT flight software ]
     Image S/N Ratio:    7.84
     Image Trigger?:     YES
     Rate S/N Ratio:     0  [ if not an image trigger ]
     Image S/N Ratio:    7.84

  Analysis Position:   [ source = BAT ]
    RA: 50.4036197387777   Dec: 16.8660799646394  [deg; J2000]

  Refined Position:   [ source = BAT pre-slew burst ]
    RA: 50.3837678142484   Dec: 16.910773911215  [deg; J2000]
        { 03h 21m 32.1s , +16d 54' 38.8" }
         +/- 2.59439650263142 [arcmin] (estimated 90% radius based on SNR)
         +/- 1.23793325682839 [arcmin] (formal 1-sigma fit error)
    SNR: 7.79180149163257

  Angular difference between the analysis and refined position is 2.913794 arcmin

  Partial Coding Fraction: 0.8828125    [ including projection effects ]

  Duration
     T90: N/A +/- N/A
        Measured from: N/A
                   to: N/A    [s; relative to TRIGTIME]
     T50: N/A +/- N/A
        Measured from: N/A
                   to: N/A    [s; relative to TRIGTIME]

    WARNING: battblocks failed.  Used TDRSS fore/background intervals

======================================================================


====== Table of the duration information =============================

        Value   tstart    tstop
T100     N/A      N/A      N/A
T90      N/A      N/A      N/A
T50      N/A      N/A      N/A
Peak     N/A      N/A      N/A


====== Spectral Analysis Summary =====================================

Model      : spectral model: simple power-law (PL) and cutoff power-law (CPL)
Ph_index   : photon index: E^{Ph_index}
Ph_90err   : 90% error of the photon index
Epeak      : Epeak in keV
Epeak_90err: 90% error of Epeak
Norm       : normalization at 50 keV in both the PL model and CPL model
Nomr_90err : 90% error of the normalization
chi2       : Chi-Squared
dof        : degree of freedo

=== Time-averaged spectral analysis ===
(Best model with acceptable fit: PL)

Model Ph_index Ph_90err_low Ph_90err_hi  Epeak  Epeak_90err_low  Epeak_90err_hi  Norm       Nomr_90err_low    Norm_90err_hi    chi2    dof
PL      -2.184    -0.197      0.185       -           -               -         5.12e-04     -6.89e-05          6.76e-05      66.240   57
CPL     -1.654    -0.359      0.963       25.298     -24.825        15.489      1.07e-03     -6.79e-04          3.02e-03      65.010   56


=== 1-s peak spectral analysis ===
(Best model with acceptable fit: N/A)

Model Ph_index Ph_90err_low Ph_90err_hi  Epeak  Epeak_90err_low  Epeak_90err_hi  Norm       Nomr_90err_low    Norm_90err_hi    chi2    dof
PL      N/A         N/A       N/A          -           -               -           N/A           N/A               N/A         N/A        N/A
CPL     N/A         N/A       N/A          N/A         N/A           N/A           N/A           N/A               N/A         N/A        N/A


=== Fluence/Peak Flux Summary ===

              Model    Band1     Band2     Band3     Band4     Band5     Total
                       15-25     25-50    50-100    100-350    15-150    15-350    keV
Fluence         PL   4.49e-07  5.45e-07  4.80e-07  7.26e-07  1.73e-06  2.20e-06   erg/cm2
      90%_error_low -5.52e-08 -5.25e-08 -8.74e-08 -2.29e-07 -1.97e-07 -3.43e-07   erg/cm2
      90%_error_hi   5.62e-08  5.21e-08  9.07e-08  2.92e-07  2.03e-07  3.92e-07   erg/cm2
Peak flux       PL     N/A      N/A      N/A      N/A      N/A      N/A     ph/cm2/s
Image
Pre-slew 15.0-350.0 keV image (Event data)
#   RAcent    DECcent   POSerr    Theta     Phi              Peak Cts       SNR   Name
   50.3838    16.9108   0.0245    24.9852   178.4255         0.7140213      7.792 TRIG_00191157

Foreground time interval of the image:
  0.000  80.000 (delta_t =  80.000 [sec])
Background time interval of the image:
Light Curves
Note: The mask-weighted lightcurves have units of either count/det or counts/sec/det, where a det is 0.4 x 0.4 = 0.16 sq cm.
Full-time range; 1 s binning
Other quick-look light curves:
- 64 ms binning (zoomed)
- 16 ms binning (zoomed)
- 8 ms binning (zoomed)
- 2 ms binning (zoomed)
- SN=5 or 10 s binning (full-time range)
- Raw light curve
Spectra
- 64 ms binning (zoomed)
- 16 ms binning (zoomed)
- 8 ms binning (zoomed)
- 2 ms binning (zoomed)
- SN=5 or 10 s binning (full-time range)
- Raw light curve
Spectra
Notes:
- 1) The fitting includes the systematic errors.
- 2) When the burst includes telescope slew time periods, the fitting uses an average response file made from multiple 5-s response files through out the slew time plus single time preiod for the non-slew times, and weighted by the total counts in the corresponding time period using addrmf. An average response file is needed becuase a spectral fit using the pre-slew DRM will introduce some errors in both a spectral shape and a normalization if the PHA file contains a lot of the slew/post-slew time interval.
- 3) For fits to more complicated models (e.g. a power-law over a cutoff power-law), the BAT team has decided to require a chi-square improvement of more than 6 for each extra dof.
Time averaged spectrum fit using the average DRM
Power-law model

Time interval is from  -56.596 sec. to  303.040 sec.

Spectral model in power-law:
------------------------------------------------------------
Parameters  : value       lower 90%   higher 90%
Photon index: -2.18401     ( -0.197462   0.185484 )
Norm@50keV  : 5.11912E-04    ( -6.8945e-05   6.76089e-05 )
------------------------------------------------------------
#Fit statistic : Chi-Squared =          66.24 using 59 PHA bins.
# Reduced chi-squared =          1.162 for     57 degrees of freedom
# Null hypothesis probability =   1.882865e-01

Photon flux (15-150 keV)    in 359.6 sec: 8.40508E-02 ( -0.007665  0.0076652 ) ph/cm2/s
Energy fluence (15-150 keV)             : 1.72731e-06 ( -1.97313e-07  2.03149e-07 ) ergs/cm2
Cutoff power-law model

Time interval is from  -56.596 sec. to  303.040 sec.
Spectral model in the cutoff power-law:
------------------------------------------------------------
Parameters  : value       lower 90%   higher 90%
Photon index: -1.65352     ( -0.358545   0.962609 )
Epeak [keV] : 25.2979      ( -24.8252 15.4888 )
Norm@50keV  : 1.06935E-03    ( -0.000679132   0.00302387 )
------------------------------------------------------------
#Fit statistic : Chi-Squared =          65.01 using 59 PHA bins.
# Reduced chi-squared =          1.161 for     56 degrees of freedom
# Null hypothesis probability =   1.915926e-01

Photon flux (15-150 keV)    in 359.6 sec: 8.21955E-02 ( -0.0081085  0.0081386 ) ph/cm2/s
Energy fluence (15-150 keV)             : 1.6223e-06 ( -2.28659e-07  2.54252e-07 ) ergs/cm2
1-s peak spectrum fit
1-s peak spectrum unavailable, likely because there are no event data in the 1-s peak range.
Time-resolved spectra

Distribution
T90 vs. Hardness ratio plot
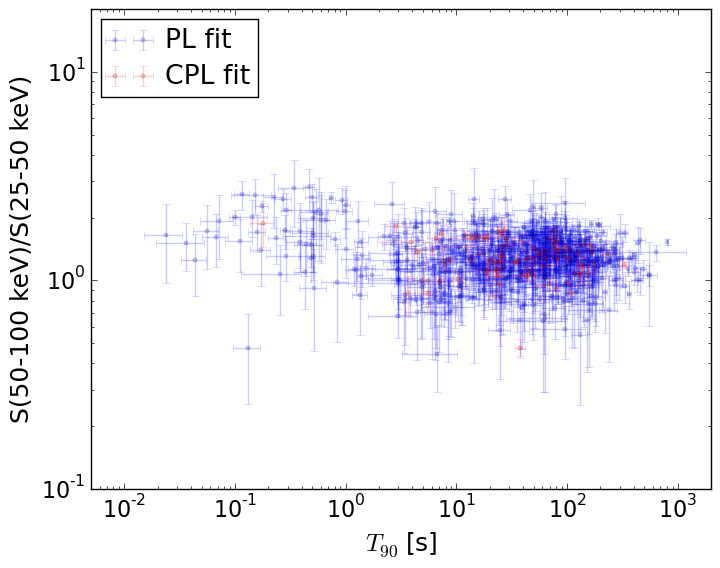
T90                                   = N/A sec.
Hardness ratio (energy fluence ratio) = N/A
S(15-50 keV) vs. S(50-150 keV) plot
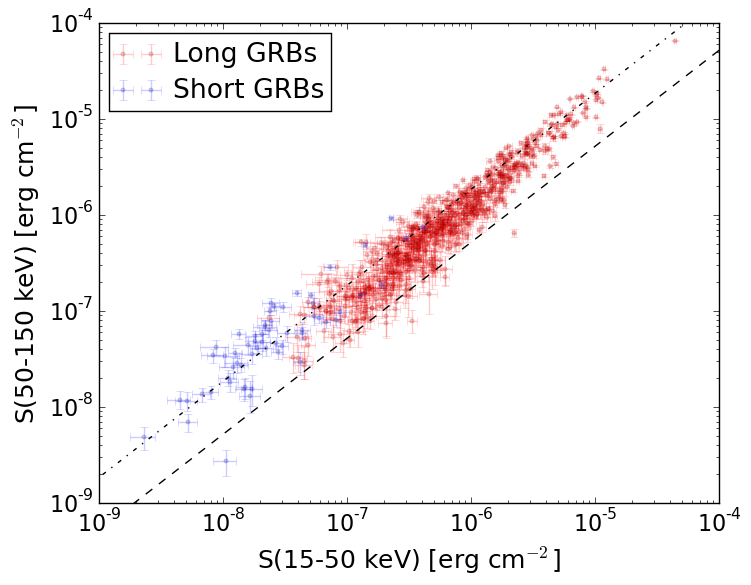
S(15-50 keV)  = N/A
S(50-150 keV) = N/A
The dash-dotted line and the dashed line traces the fluences calculated from the Band function with Epeak = 15 and 150 keV, respectively. Both lines assume a canonical values of alpha = -1 and beta = -2.5.
Mask shadow pattern
IMX = -4.658171215831947E-01, IMY = -1.280434502440065E-02
Spacecraft aspect plot
Bright source in the pre-burst/pre-slew/post-slew images
Pre-burst image of 15-350 keV band
Time interval of the image:
Pre-slew background subtracted image of 15-350 keV band
Time interval of the image:
0.000000 80.000000

# RAcent  DECcent POSerr Theta    Phi  PeakCts   SNR AngSep     Name
#  [deg]    [deg]    ['] [deg]  [deg]                   [']
 83.6470  21.9770    4.2  43.9  130.9   0.8768   2.7    2.4	Crab
326.0351  38.4842    6.0  53.2  -33.3  -0.7650  -1.9   11.7	Cyg X-2
 63.0813  54.8117    2.4  24.6   72.5   0.5134   4.8 ------	UNKNOWN
 50.3837  16.9108    1.5  25.0  178.4   0.7141   7.8 ------	UNKNOWN
311.7105  60.8267    2.1  54.4   -3.4   1.4924   5.5 ------	UNKNOWN
332.0291  58.3877    2.7  44.7   -8.7   0.5925   4.2 ------	UNKNOWN
 51.4677  -1.6407    2.3  42.6 -170.3   0.6322   4.9 ------	UNKNOWN
Post-slew image of 15-350 keV band
Time interval of the image:
137.100600 303.040000

# RAcent  DECcent POSerr Theta    Phi  PeakCts   SNR AngSep     Name
#  [deg]    [deg]    ['] [deg]  [deg]                   [']
 83.6415  22.0206    0.5  31.7   89.8   6.5229  23.4    0.6	Crab
 51.3826  64.0440    2.5  47.2   15.1   1.6336   4.6 ------	UNKNOWN
 50.4194  16.8297    0.8   0.1  168.6   1.9274  14.3 ------	UNKNOWN
 48.5057  10.5720    2.7   6.6 -149.0   0.5423   4.3 ------	UNKNOWN
 30.9516  -4.1498    2.6  28.5 -121.3   0.7760   4.4 ------	UNKNOWN
  0.6588  27.5529    3.0  46.9  -53.2   2.4632   3.8 ------	UNKNOWN