Analysis Summary
Notes:
- 1) No attempt has been made to eliminate the non-significant decimal places.
- 2) This batgrbproduct analysis is done using the HEASARC data.
- 3) This batgrbproduct analysis is using the flight position for the mask-weighting calculation.
======================================================================
BAT GRB EVENT DATA PROCESSING REPORT
Process Script Ver: batgrbproduct v2.46
Process Start Time: Wed Jan 22 18:17:12 EST 2014
Host Name: batevent1
Current Working Dir: /local/data/batevent/batevent_reproc/trigger192059
======================================================================
Trigger: 00192059 Segment: 000
BAT Trigger Time: 162367464.96 [s; MET]
Trigger Stop: 162367465.984 [s; MET]
UTC: 2006-02-23T06:04:23.927580 [includes UTCF correction]
Where From?: TDRSS position message
BAT
RA: 55.2160197959957 Dec: -17.1390558972725 [deg; J2000]
Catalogged Source?: NO
Point Source?: YES
GRB Indicated?: YES [ by BAT flight software ]
Image S/N Ratio: 9.99
Image Trigger?: NO
Rate S/N Ratio: 17.8605710994918 [ if not an image trigger ]
Image S/N Ratio: 9.99
Analysis Position: [ source = BAT ]
RA: 55.2160197959957 Dec: -17.1390558972725 [deg; J2000]
Refined Position: [ source = BAT pre-slew burst ]
RA: 55.1955017215853 Dec: -17.1350305460266 [deg; J2000]
{ 03h 40m 46.9s , -17d 08' 06.1" }
+/- 1.18503486532795 [arcmin] (estimated 90% radius based on SNR)
+/- 0.389361545606414 [arcmin] (formal 1-sigma fit error)
SNR: 23.8664704477087
Angular difference between the analysis and refined position is 1.200964 arcmin
Partial Coding Fraction: 0.6953125 [ including projection effects ]
Duration
T90: 11.3200000226498 +/- 1.07260432986126
Measured from: -2.08000001311302
to: 9.24000000953674 [s; relative to TRIGTIME]
T50: 5.08000001311302 +/- 0.723071239532377
Measured from: -0.372000008821487
to: 4.70800000429153 [s; relative to TRIGTIME]
Fluence
Peak Flux (peak 1 second)
Measured from: 0.0760000050067902
to: 1.07600000500679 [s; relative to TRIGTIME]
Total Fluence
Measured from: -2.92399999499321
to: 10.0320000052452 [s; relative to TRIGTIME]
Band 1 Band 2 Band 3 Band 4
15-25 25-50 50-100 100-350 keV
Total 0.322855 0.444151 0.283478 0.048218
0.022906 0.024196 0.021339 0.018491 [error]
Peak 0.042662 0.061620 0.041585 0.020490
0.006587 0.006999 0.006416 0.005421 [error]
[ fluence units of on-axis counts / fully illuminated detector ]
======================================================================
====== Table of the duration information =============================
Value tstart tstop
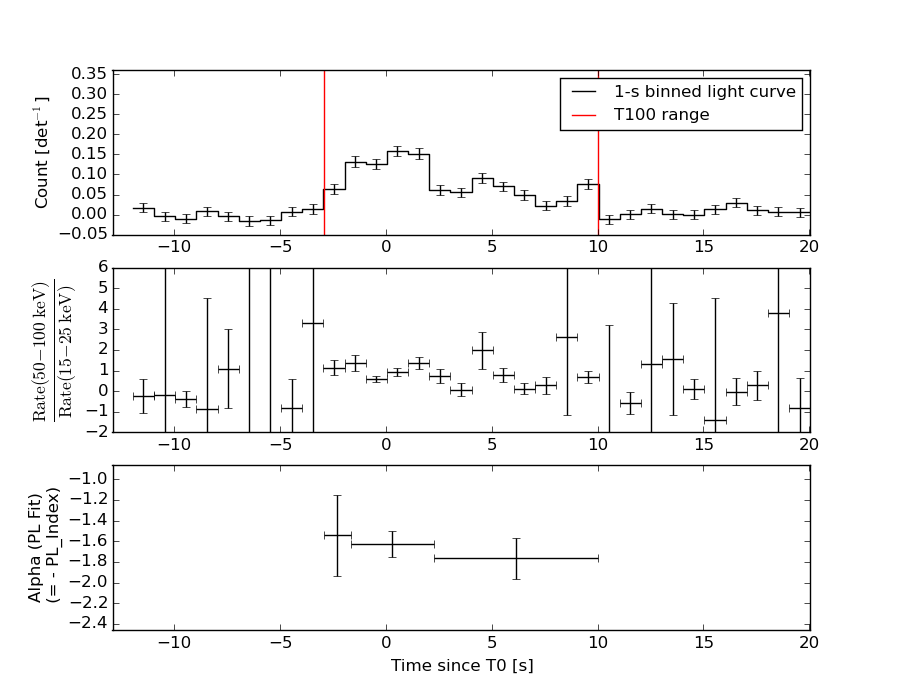
T100 12.956 -2.924 10.032
T90 11.320 -2.080 9.240
T50 5.080 -0.372 4.708
Peak 1.000 0.076 1.076
====== Spectral Analysis Summary =====================================
Model : spectral model: simple power-law (PL) and cutoff power-law (CPL)
Ph_index : photon index: E^{Ph_index}
Ph_90err : 90% error of the photon index
Epeak : Epeak in keV
Epeak_90err: 90% error of Epeak
Norm : normalization at 50 keV in both the PL model and CPL model
Nomr_90err : 90% error of the normalization
chi2 : Chi-Squared
dof : degree of freedo
=== Time-averaged spectral analysis ===
(Best model with acceptable fit: PL)
Model Ph_index Ph_90err_low Ph_90err_hi Epeak Epeak_90err_low Epeak_90err_hi Norm Nomr_90err_low Norm_90err_hi chi2 dof
PL -1.689 -0.113 0.111 - - - 5.61e-03 -3.86e-04 3.84e-04 59.810 57
CPL -1.053 -0.463 0.523 69.870 -14.045 60.337 1.22e-02 -5.18e-03 1.07e-02 54.090 56
=== 1-s peak spectral analysis ===
(Best model with acceptable fit: PL)
Model Ph_index Ph_90err_low Ph_90err_hi Epeak Epeak_90err_low Epeak_90err_hi Norm Nomr_90err_low Norm_90err_hi chi2 dof
PL -1.579 -0.220 0.215 - - - 1.06e-02 -1.42e-03 1.40e-03 58.630 57
CPL -1.251 -0.528 0.994 108.587 -82.683 -108.587 1.58e-02 N/A N/A 58.180 56
=== Fluence/Peak Flux Summary ===
Model Band1 Band2 Band3 Band4 Band5 Total
15-25 25-50 50-100 100-350 15-150 15-350 keV
Fluence PL 1.11e-07 1.82e-07 2.25e-07 5.54e-07 6.74e-07 1.07e-06 erg/cm2
90%_error_low -1.13e-08 -1.19e-08 -2.04e-08 -9.76e-08 -4.86e-08 -1.17e-07 erg/cm2
90%_error_hi 1.16e-08 1.19e-08 2.05e-08 1.11e-07 4.90e-08 1.27e-07 erg/cm2
Peak flux PL 4.70e-01 4.52e-01 3.03e-01 3.16e-01 1.35e+00 1.54e+00 ph/cm2/s
90%_error_low -9.40e-02 -5.91e-02 -5.16e-02 -9.60e-02 -1.72e-01 -1.97e-01 ph/cm2/s
90%_error_hi 9.87e-02 5.87e-02 5.11e-02 1.18e-01 1.72e-01 1.98e-01 ph/cm2/s
Fluence CPL 1.02e-07 1.95e-07 2.29e-07 2.19e-07 6.39e-07 7.45e-07 erg/cm2
90%_error_low -1.32e-08 -1.52e-08 -2.26e-08 -1.00e-07 -5.46e-08 -1.14e-07 erg/cm2
90%_error_hi 1.34e-08 1.56e-08 2.25e-08 2.00e-07 5.50e-08 2.02e-07 erg/cm2
Peak flux CPL 4.49e-01 4.69e-01 3.09e-01 2.10e-01 1.34e+00 1.44e+00 ph/cm2/s
90%_error_low -1.09e-01 -7.09e-02 -5.49e-02 -1.36e-01 -1.77e-01 -2.34e-01 ph/cm2/s
90%_error_hi 1.10e-01 7.60e-02 5.67e-02 1.38e-01 1.76e-01 2.80e-01 ph/cm2/s
======================================================================
Image
Pre-slew 15.0-350.0 keV image (Event data)
#   RAcent    DECcent   POSerr    Theta     Phi              Peak Cts       SNR   Name
   55.1955   -17.1350   0.0080    34.3504   178.6801         1.0874325     23.866 TRIG_00192059

Foreground time interval of the image:
 -2.924  10.032 (delta_t =  12.956 [sec])
Background time interval of the image:
-299.960  -2.924 (delta_t = 297.036 [sec])
Light Curves
Note: The mask-weighted lightcurves have units of either count/det or counts/sec/det, where a det is 0.4 x 0.4 = 0.16 sq cm.
Full-time range; 1 s binning
Other quick-look light curves:
- 64 ms binning (zoomed)
- 16 ms binning (zoomed)
- 8 ms binning (zoomed)
- 2 ms binning (zoomed)
- SN=5 or 10 s binning (full-time range)
- Raw light curve
Spectra
- 64 ms binning (zoomed)
- 16 ms binning (zoomed)
- 8 ms binning (zoomed)
- 2 ms binning (zoomed)
- SN=5 or 10 s binning (full-time range)
- Raw light curve
Spectra
Notes:
- 1) The fitting includes the systematic errors.
- 2) When the burst includes telescope slew time periods, the fitting uses an average response file made from multiple 5-s response files through out the slew time plus single time preiod for the non-slew times, and weighted by the total counts in the corresponding time period using addrmf. An average response file is needed becuase a spectral fit using the pre-slew DRM will introduce some errors in both a spectral shape and a normalization if the PHA file contains a lot of the slew/post-slew time interval.
- 3) For fits to more complicated models (e.g. a power-law over a cutoff power-law), the BAT team has decided to require a chi-square improvement of more than 6 for each extra dof.
Time averaged spectrum fit using the average DRM
Power-law model

Time interval is from   -2.924 sec. to   10.032 sec.

Spectral model in power-law:
------------------------------------------------------------
Parameters  : value       lower 90%   higher 90%
Photon index: -1.68877     ( -0.112703   0.11121 )
Norm@50keV  : 5.61429E-03    ( -0.000386295   0.000383814 )
------------------------------------------------------------
#Fit statistic : Chi-Squared =          59.81 using 59 PHA bins.
# Reduced chi-squared =          1.049 for     57 degrees of freedom
# Null hypothesis probability =   3.741043e-01

Photon flux (15-150 keV)    in 12.96 sec: 0.742770 ( -0.048793  0.048847 ) ph/cm2/s
Energy fluence (15-150 keV)             : 6.74396e-07 ( -4.85964e-08  4.89819e-08 ) ergs/cm2
Cutoff power-law model
Time interval is from   -2.924 sec. to   10.032 sec.
Spectral model in the cutoff power-law:
------------------------------------------------------------
Parameters  : value       lower 90%   higher 90%
Photon index: -1.05341     ( -0.462967   0.522722 )
Epeak [keV] : 69.8697      ( -14.0446 60.3371 )
Norm@50keV  : 1.22065E-02    ( -0.00517865   0.0106882 )
------------------------------------------------------------
#Fit statistic : Chi-Squared =          54.09 using 59 PHA bins.
# Reduced chi-squared =         0.9659 for     56 degrees of freedom
# Null hypothesis probability =   5.475183e-01

Photon flux (15-150 keV)    in 12.96 sec: 0.722547 ( -0.051012  0.050976 ) ph/cm2/s
Energy fluence (15-150 keV)             : 6.39316e-07 ( -5.4586e-08  5.5013e-08 ) ergs/cm2
1-s peak spectrum fit
Power-law model
Time interval is from    0.076 sec. to    1.076 sec.

Spectral model in power-law:
------------------------------------------------------------
Parameters  : value       lower 90%   higher 90%
Photon index: -1.57879     ( -0.219988   0.214823 )
Norm@50keV  : 1.05963E-02    ( -0.00142255   0.00140453 )
------------------------------------------------------------
#Fit statistic : Chi-Squared =          58.63 using 59 PHA bins.
# Reduced chi-squared =          1.029 for     57 degrees of freedom
# Null hypothesis probability =   4.153679e-01

Photon flux (15-150 keV)    in 1 sec: 1.35292 ( -0.17186  0.17201 ) ph/cm2/s
Energy fluence (15-150 keV)             : 9.93779e-08 ( -1.4319e-08  1.45054e-08 ) ergs/cm2
Cutoff power-law model

Time interval is from    0.076 sec. to    1.076 sec.
Spectral model in the cutoff power-law:
------------------------------------------------------------
Parameters  : value       lower 90%   higher 90%
Photon index: -1.25054     ( -0.527486   0.993805 )
Epeak [keV] : 108.587      ( -82.745 -108.649 )
Norm@50keV  : 1.58383E-02    (     )
------------------------------------------------------------
#Fit statistic : Chi-Squared =          58.18 using 59 PHA bins.
# Reduced chi-squared =          1.039 for     56 degrees of freedom
# Null hypothesis probability =   3.950229e-01

Photon flux (15-150 keV)    in 1 sec: 1.33769 ( -0.17672  0.17592 ) ph/cm2/s
Energy fluence (15-150 keV)             : 9.6732e-08 ( -1.60717e-08  1.58814e-08 ) ergs/cm2
Time-resolved spectra
Distribution
T90 vs. Hardness ratio plot
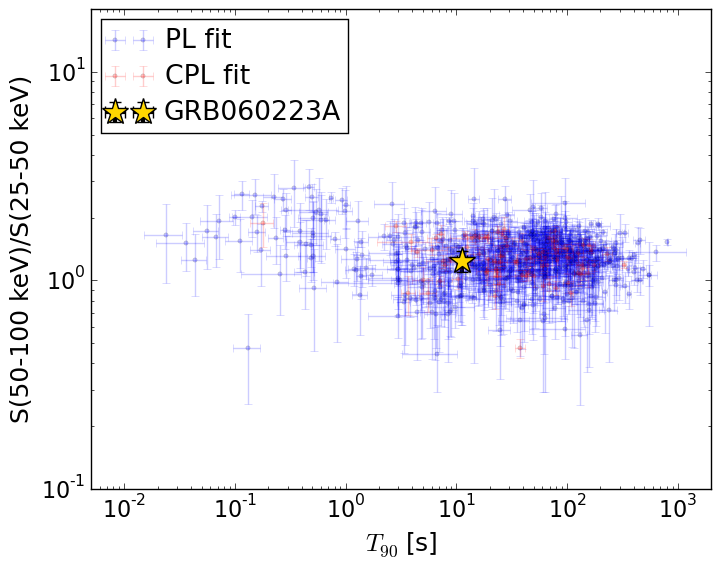
T90                                   = 11.32 sec.
Hardness ratio (energy fluence ratio) = 1.24079576254
S(15-50 keV) vs. S(50-150 keV) plot
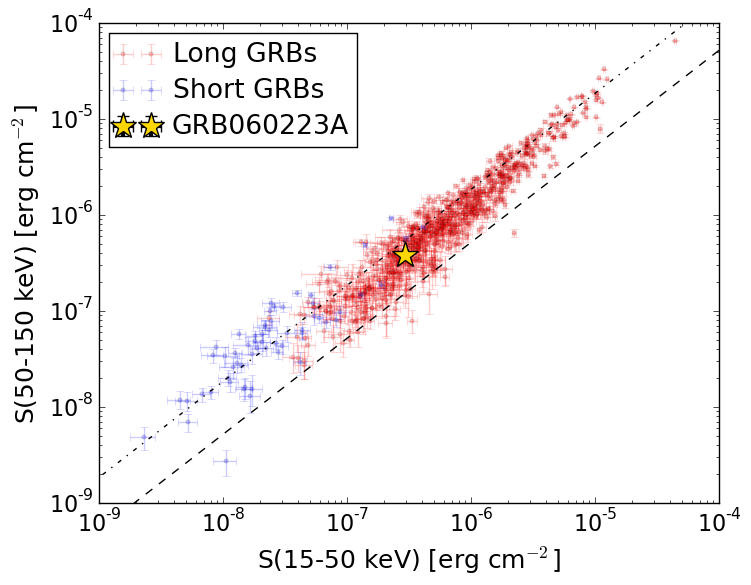
S(15-50 keV)  = 2.926568e-07
S(50-150 keV) = 3.817451e-07
The dash-dotted line and the dashed line traces the fluences calculated from the Band function with Epeak = 15 and 150 keV, respectively. Both lines assume a canonical values of alpha = -1 and beta = -2.5.
Mask shadow pattern
IMX = -6.832624245448796E-01, IMY = -1.574307026352405E-02
Spacecraft aspect plot
Bright source in the pre-burst/pre-slew/post-slew images
Pre-burst image of 15-350 keV band
Time interval of the image:
-299.960000 -2.924000

# RAcent  DECcent POSerr Theta    Phi  PeakCts   SNR AngSep     Name
#  [deg]    [deg]    ['] [deg]  [deg]                   [']
 83.6193  22.0333    0.6  31.7   82.1  11.4833  19.5    1.4	Crab
 83.4875 -15.5563    2.4  46.0  139.9   4.5135   4.7 ------	UNKNOWN
 49.0711   5.7897    2.5  11.2 -166.4   1.2923   4.6 ------	UNKNOWN
 45.9057 -41.6784    3.1  58.7 -169.2   5.2801   3.7 ------	UNKNOWN
 32.7019 -28.8093    2.3  48.8 -152.4   2.8944   4.9 ------	UNKNOWN
  0.6228  54.9827    2.4  53.7  -26.1   3.8616   4.7 ------	UNKNOWN
  5.3909  22.2703    2.8  42.6  -68.4   3.8843   4.1 ------	UNKNOWN
Pre-slew background subtracted image of 15-350 keV band
Time interval of the image:
-2.924000 10.032000

# RAcent  DECcent POSerr Theta    Phi  PeakCts   SNR AngSep     Name
#  [deg]    [deg]    ['] [deg]  [deg]                   [']
 83.6345  22.1216    6.2  31.7   81.9   0.1233   1.9    6.4	Crab
 55.1947 -17.1353    0.5  34.4  178.7   1.0982  24.1 ------	UNKNOWN
 10.4409  68.0626    2.6  57.1   -9.8   0.7382   4.5 ------	UNKNOWN
359.7046  61.5769    2.4  57.0  -19.2   0.6855   4.9 ------	UNKNOWN
Post-slew image of 15-350 keV band
Time interval of the image:
69.940600 302.111700

# RAcent  DECcent POSerr Theta    Phi  PeakCts   SNR AngSep     Name
#  [deg]    [deg]    ['] [deg]  [deg]                   [']
 87.8213  11.2216    2.8  42.9   57.3   4.2017   4.1 ------	UNKNOWN
 88.3087 -36.3918    2.3  35.0  136.3   1.9747   5.1 ------	UNKNOWN
 67.1089 -44.5274    3.0  29.2  168.8   0.9823   3.9 ------	UNKNOWN
 61.7247 -75.2178    2.9  58.2 -175.6   4.9000   4.0 ------	UNKNOWN
 31.1880 -42.1362    2.6  32.3 -139.3   1.1396   4.4 ------	UNKNOWN
 26.2761 -74.1190    2.3  59.2 -164.8   6.0172   5.0 ------	UNKNOWN
 20.1637 -56.9049    2.6  47.6 -148.5   2.0806   4.4 ------	UNKNOWN