Analysis Summary
Notes:
- 1) No attempt has been made to eliminate the non-significant decimal places.
- 2) This batgrbproduct analysis is done using the HEASARC data.
- 3) This batgrbproduct analysis is using the flight position for the mask-weighting calculation.
======================================================================
BAT GRB EVENT DATA PROCESSING REPORT
Process Script Ver: batgrbproduct v2.46
Process Start Time: Wed Jan 22 18:13:34 EST 2014
Host Name: batevent1
Current Working Dir: /local/data/batevent/batevent_reproc/trigger192152
======================================================================
Trigger: 00192152 Segment: 000
BAT Trigger Time: 162416465.92 [s; MET]
Trigger Stop: 162416466.944 [s; MET]
UTC: 2006-02-23T19:41:04.886460 [includes UTCF correction]
Where From?: TDRSS position message
BAT
RA: 254.241178315544 Dec: -30.8069451092458 [deg; J2000]
Catalogged Source?: NO
Point Source?: YES
GRB Indicated?: YES [ by BAT flight software ]
Image S/N Ratio: 16.42
Image Trigger?: NO
Rate S/N Ratio: 40.7062648740952 [ if not an image trigger ]
Image S/N Ratio: 16.42
Analysis Position: [ source = BAT ]
RA: 254.241178315544 Dec: -30.8069451092458 [deg; J2000]
Refined Position: [ source = BAT pre-slew burst ]
RA: 254.241969024417 Dec: -30.8130559697583 [deg; J2000]
{ 16h 56m 58.1s , -30d 48' 47.0" }
+/- 0.733472155975042 [arcmin] (estimated 90% radius based on SNR)
+/- 0.241746008142274 [arcmin] (formal 1-sigma fit error)
SNR: 47.3617212456409
Angular difference between the analysis and refined position is 0.368909 arcmin
Partial Coding Fraction: 0.6796875 [ including projection effects ]
Duration
T90: 10.3600000143051 +/- 0.750948756400525
Measured from: -5.72799998521805
to: 4.63200002908707 [s; relative to TRIGTIME]
T50: 5.63600000739098 +/- 0.377973569811353
Measured from: -2.55999997258186
to: 3.07600003480911 [s; relative to TRIGTIME]
Fluence
Peak Flux (peak 1 second)
Measured from: 3.00800001621246
to: 4.00800001621246 [s; relative to TRIGTIME]
Total Fluence
Measured from: -7
to: 5.52400001883507 [s; relative to TRIGTIME]
Band 1 Band 2 Band 3 Band 4
15-25 25-50 50-100 100-350 keV
Total 0.693958 0.916331 0.722478 0.196521
0.027358 0.026177 0.022318 0.016439 [error]
Peak 0.065923 0.117291 0.143322 0.039958
0.007829 0.008136 0.007971 0.005619 [error]
[ fluence units of on-axis counts / fully illuminated detector ]
======================================================================
====== Table of the duration information =============================
Value tstart tstop
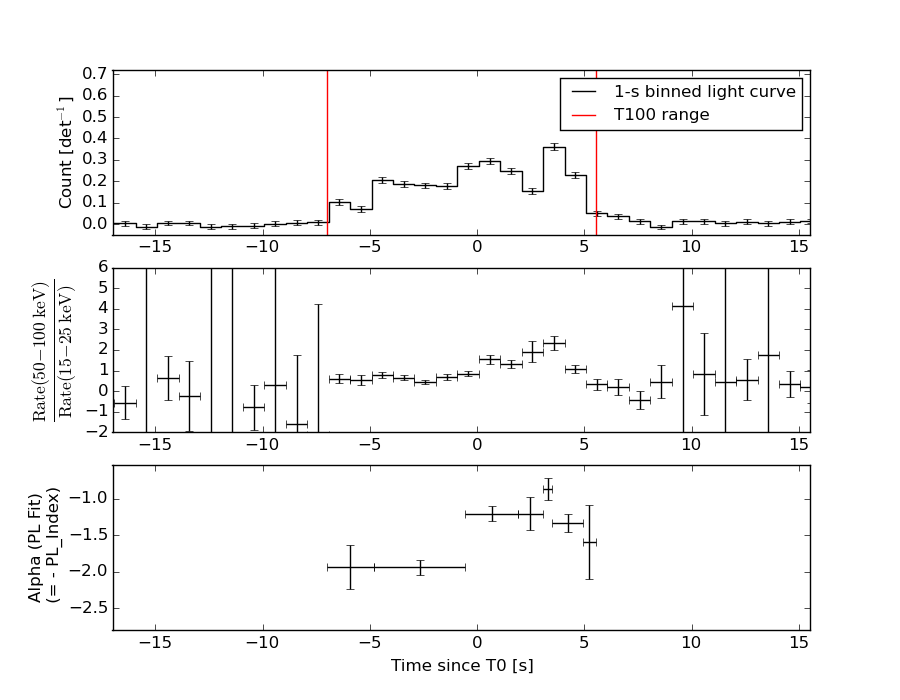
T100 12.524 -7.000 5.524
T90 10.360 -5.728 4.632
T50 5.636 -2.560 3.076
Peak 1.000 3.008 4.008
====== Spectral Analysis Summary =====================================
Model : spectral model: simple power-law (PL) and cutoff power-law (CPL)
Ph_index : photon index: E^{Ph_index}
Ph_90err : 90% error of the photon index
Epeak : Epeak in keV
Epeak_90err: 90% error of Epeak
Norm : normalization at 50 keV in both the PL model and CPL model
Nomr_90err : 90% error of the normalization
chi2 : Chi-Squared
dof : degree of freedo
=== Time-averaged spectral analysis ===
(Best model with acceptable fit: PL)
Model Ph_index Ph_90err_low Ph_90err_hi Epeak Epeak_90err_low Epeak_90err_hi Norm Nomr_90err_low Norm_90err_hi chi2 dof
PL -1.475 -0.064 0.064 - - - 1.34e-02 -4.40e-04 4.40e-04 39.520 57
CPL -1.443 -0.094 0.119 995.684 -995.684 -995.684 1.39e-02 -8.61e-04 7.17e-04 40.090 56
=== 1-s peak spectral analysis ===
(Best model with acceptable fit: PL)
Model Ph_index Ph_90err_low Ph_90err_hi Epeak Epeak_90err_low Epeak_90err_hi Norm Nomr_90err_low Norm_90err_hi chi2 dof
PL -0.953 -0.117 0.119 - - - 2.50e-02 -1.70e-03 1.69e-03 56.060 57
CPL -0.560 -0.433 0.513 223.427 -92.253 -223.427 3.65e-02 -1.21e-02 2.18e-02 53.910 56
=== Fluence/Peak Flux Summary ===
Model Band1 Band2 Band3 Band4 Band5 Total
15-25 25-50 50-100 100-350 15-150 15-350 keV
Fluence PL 2.10e-07 3.91e-07 5.63e-07 1.72e-06 1.60e-06 2.88e-06 erg/cm2
90%_error_low -1.41e-08 -1.52e-08 -2.28e-08 -1.57e-07 -5.55e-08 -1.69e-07 erg/cm2
90%_error_hi 1.44e-08 1.51e-08 2.27e-08 1.68e-07 5.56e-08 1.78e-07 erg/cm2
Peak flux PL 6.12e-01 8.54e-01 8.82e-01 1.67e+00 2.88e+00 4.02e+00 ph/cm2/s
90%_error_low -8.57e-02 -7.50e-02 -6.14e-02 -2.42e-01 -1.98e-01 -2.87e-01 ph/cm2/s
90%_error_hi 9.07e-02 7.44e-02 6.11e-02 2.68e-01 1.98e-01 2.93e-01 ph/cm2/s
Fluence CPL 1.96e-07 2.51e-07 2.46e-07 5.39e-07 8.43e-07 9.99e-07 erg/cm2
90%_error_low -2.14e-08 -2.64e-08 -4.22e-08 -7.05e-08 -1.10e-07 9.79e-08 erg/cm2
90%_error_hi 1.49e-08 1.75e-08 2.33e-08 8.28e-07 6.06e-08 3.88e-07 erg/cm2
Peak flux CPL 5.42e-01 8.62e-01 9.26e-01 1.18e+00 2.83e+00 3.51e+00 ph/cm2/s
90%_error_low -1.13e-01 -7.89e-02 -7.91e-02 -3.76e-01 -2.05e-01 -4.43e-01 ph/cm2/s
90%_error_hi 1.19e-01 7.88e-02 8.06e-02 4.85e-01 2.06e-01 6.27e-01 ph/cm2/s
======================================================================
Image
Pre-slew 15.0-350.0 keV image (Event data)
#   RAcent    DECcent   POSerr    Theta     Phi              Peak Cts       SNR   Name
  254.2420   -30.8131   0.0041    27.1172    27.0588         2.6306663     47.362 TRIG_00192152

Foreground time interval of the image:
 -7.000   5.524 (delta_t =  12.524 [sec])
Background time interval of the image:
-254.019  -7.000 (delta_t = 247.019 [sec])
Light Curves
Note: The mask-weighted lightcurves have units of either count/det or counts/sec/det, where a det is 0.4 x 0.4 = 0.16 sq cm.
Full-time range; 1 s binning
Other quick-look light curves:
- 64 ms binning (zoomed)
- 16 ms binning (zoomed)
- 8 ms binning (zoomed)
- 2 ms binning (zoomed)
- SN=5 or 10 s binning (full-time range)
- Raw light curve
Spectra
- 64 ms binning (zoomed)
- 16 ms binning (zoomed)
- 8 ms binning (zoomed)
- 2 ms binning (zoomed)
- SN=5 or 10 s binning (full-time range)
- Raw light curve
Spectra
Notes:
- 1) The fitting includes the systematic errors.
- 2) When the burst includes telescope slew time periods, the fitting uses an average response file made from multiple 5-s response files through out the slew time plus single time preiod for the non-slew times, and weighted by the total counts in the corresponding time period using addrmf. An average response file is needed becuase a spectral fit using the pre-slew DRM will introduce some errors in both a spectral shape and a normalization if the PHA file contains a lot of the slew/post-slew time interval.
- 3) For fits to more complicated models (e.g. a power-law over a cutoff power-law), the BAT team has decided to require a chi-square improvement of more than 6 for each extra dof.
Time averaged spectrum fit using the average DRM
Power-law model

Time interval is from   -7.000 sec. to    5.524 sec.

Spectral model in power-law:
------------------------------------------------------------
Parameters  : value       lower 90%   higher 90%
Photon index: -1.47468     ( -0.0638907   0.0639856 )
Norm@50keV  : 1.34234E-02    ( -0.000440381   0.000440381 )
------------------------------------------------------------
#Fit statistic : Chi-Squared =          39.52 using 59 PHA bins.
# Reduced chi-squared =         0.6934 for     57 degrees of freedom
# Null hypothesis probability =   9.623276e-01

Photon flux (15-150 keV)    in 12.52 sec: 1.66465 ( -0.06084  0.06106 ) ph/cm2/s
Energy fluence (15-150 keV)             : 1.60135e-06 ( -5.55419e-08  5.56232e-08 ) ergs/cm2
Cutoff power-law model
Time interval is from   -7.000 sec. to    5.524 sec.
Spectral model in the cutoff power-law:
------------------------------------------------------------
Parameters  : value       lower 90%   higher 90%
Photon index: -1.4718     ( -0.0942306   0.118551 )
Epeak [keV] : 9999.18      ( -9999.2 -9999.2 )
Norm@50keV  : 1.34653E-02    ( -0.00044185   0.00113657 )
------------------------------------------------------------
#Fit statistic : Chi-Squared =          39.57 using 59 PHA bins.
# Reduced chi-squared =         0.7066 for     56 degrees of freedom
# Null hypothesis probability =   9.527663e-01

Photon flux (15-150 keV)    in 12.52 sec: 1.66428 ( -0.06081  0.0611 ) ph/cm2/s
Energy fluence (15-150 keV)             : 8.43246e-07 ( -1.09992e-07  6.05999e-08 ) ergs/cm2
1-s peak spectrum fit
Power-law model
Time interval is from    3.008 sec. to    4.008 sec.

Spectral model in power-law:
------------------------------------------------------------
Parameters  : value       lower 90%   higher 90%
Photon index: -0.95314     ( -0.116588   0.11875 )
Norm@50keV  : 2.50310E-02    ( -0.00170011   0.00169254 )
------------------------------------------------------------
#Fit statistic : Chi-Squared =          56.06 using 59 PHA bins.
# Reduced chi-squared =         0.9835 for     57 degrees of freedom
# Null hypothesis probability =   5.102824e-01

Photon flux (15-150 keV)    in 1 sec: 2.87608 ( -0.19769  0.19817 ) ph/cm2/s
Energy fluence (15-150 keV)             : 2.7534e-07 ( -1.93282e-08  1.93938e-08 ) ergs/cm2
Cutoff power-law model
Time interval is from    3.008 sec. to    4.008 sec.
Spectral model in the cutoff power-law:
------------------------------------------------------------
Parameters  : value       lower 90%   higher 90%
Photon index: -0.559664     ( -0.432654   0.513367 )
Epeak [keV] : 223.427      ( -92.2531 -223.427 )
Norm@50keV  : 3.65100E-02    ( -0.0121395   0.0217738 )
------------------------------------------------------------
#Fit statistic : Chi-Squared =          53.91 using 59 PHA bins.
# Reduced chi-squared =         0.9626 for     56 degrees of freedom
# Null hypothesis probability =   5.545491e-01

Photon flux (15-150 keV)    in 1 sec: 2.82564 ( -0.20548  0.20634 ) ph/cm2/s
Energy fluence (15-150 keV)             : 2.71794e-07 ( -2.0119e-08  2.00226e-08 ) ergs/cm2
Time-resolved spectra
Distribution
T90 vs. Hardness ratio plot
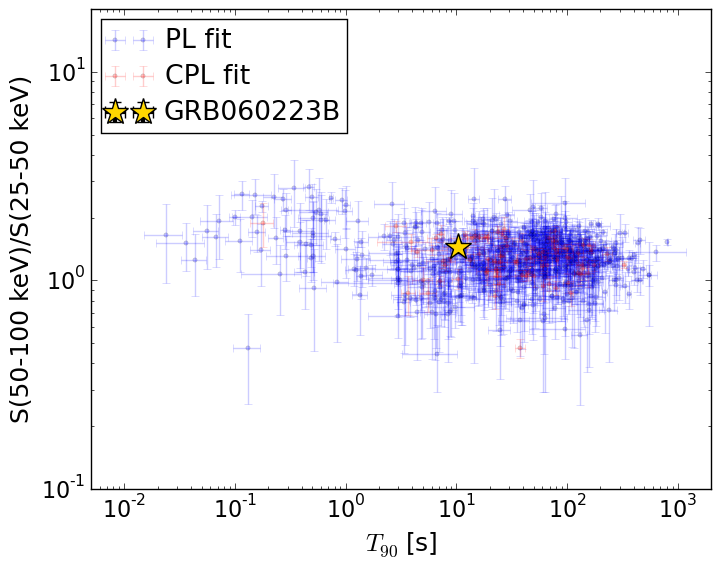
T90                                   = 10.36 sec.
Hardness ratio (energy fluence ratio) = 1.43926211985
S(15-50 keV) vs. S(50-150 keV) plot
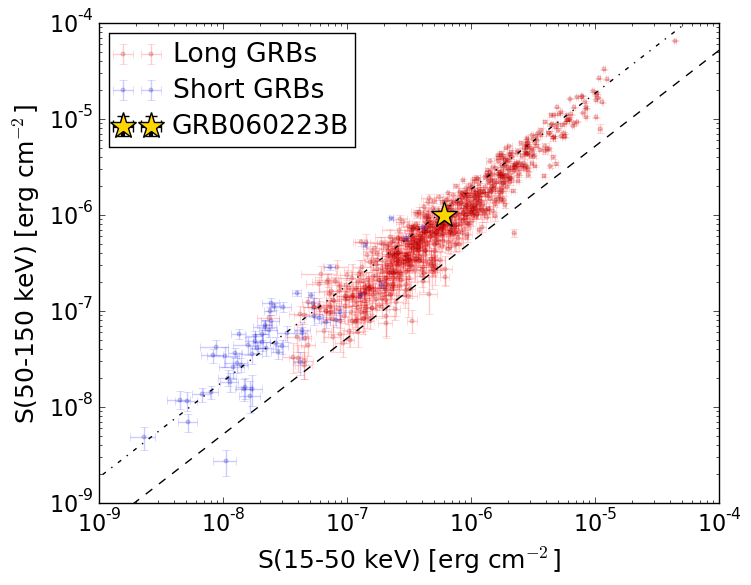
S(15-50 keV)  = 6.006508e-07
S(50-150 keV) = 1.0006766e-06
The dash-dotted line and the dashed line traces the fluences calculated from the Band function with Epeak = 15 and 150 keV, respectively. Both lines assume a canonical values of alpha = -1 and beta = -2.5.
Mask shadow pattern
IMX = 4.560496767471577E-01, IMY = -2.329586767562424E-01
Spacecraft aspect plot
Bright source in the pre-burst/pre-slew/post-slew images
Pre-burst image of 15-350 keV band
Time interval of the image:
-254.019410 -7.000000

# RAcent  DECcent POSerr Theta    Phi  PeakCts   SNR AngSep     Name
#  [deg]    [deg]    ['] [deg]  [deg]                   [']
244.9863 -15.6529    0.5  23.8   67.5   9.5413  22.3    0.9	Sco X-1
254.5214  35.3496    4.6  43.8  166.0   1.2774   2.5    3.2	Her X-1
255.9630 -37.8141    1.7  32.8   18.4   2.6669   6.8    2.1	4U 1700-377
256.5883 -36.5833    5.3  31.5   18.4   0.8236   2.2   12.1	GX 349+2
263.0277 -24.7834    6.4  18.6   14.3   0.4769   1.8    2.5	GX 1+4
264.7424 -44.4504   69.0  37.8    4.6  -0.0706  -0.2    0.0	4U 1735-44
268.5183  -1.4832    9.2   5.3 -168.0   0.3505   1.3    9.2	SW J1753.5-0127
270.3048 -25.0776    2.9  18.5   -6.5   1.0231   4.0    1.1	GX 5-1
270.2680 -25.7874    7.3  19.2   -6.1   0.4126   1.6    3.2	GRS 1758-258
274.0592 -13.8951    4.9   9.6  -39.9   0.6440   2.3    9.0	GX 17+2
275.9692 -30.2937    3.8  24.9  -16.1   0.8480   3.0    5.0	H1820-303
284.8982 -24.9693    3.4  24.7  -39.0   0.9919   3.4    8.1	HT1900.1-2455
288.8172  10.9149    1.1  27.6 -128.3   3.2875  10.2    2.1	GRS 1915+105
299.5863  35.2024    1.1  51.7 -145.1   7.8246  10.3    0.2	Cyg X-1
262.9097 -33.9827   35.2  27.6    9.7   0.1053   0.3    9.7	GX 354-0
233.8925 -23.5960    2.3  36.4   60.1   3.5379   5.0 ------	UNKNOWN
255.2011 -41.6188    2.0  36.6   16.9   2.4160   5.7 ------	UNKNOWN
259.0190  49.9164    2.0  57.1  174.9   9.2007   5.9 ------	UNKNOWN
282.0096   7.5560    2.8  20.3 -133.1   1.0690   4.2 ------	UNKNOWN
311.0056 -50.5345    2.5  56.7  -30.1   6.9023   4.5 ------	UNKNOWN
Pre-slew background subtracted image of 15-350 keV band
Time interval of the image:
-7.000000 5.524000

# RAcent  DECcent POSerr Theta    Phi  PeakCts   SNR AngSep     Name
#  [deg]    [deg]    ['] [deg]  [deg]                   [']
244.9637 -15.5448    8.6  23.8   67.7   0.0763   1.3    5.8	Sco X-1
254.4950  35.4672   80.2  43.9  166.0  -0.0116  -0.1    7.7	Her X-1
255.9342 -37.7092    3.6  32.7   18.5  -0.1776  -3.2    8.5	4U 1700-377
256.5974 -36.3804   10.5  31.3   18.5   0.0548   1.1    8.2	GX 349+2
263.0922 -24.8715    9.3  18.6   14.1   0.0542   1.2    8.8	GX 1+4
264.5748 -44.3943   16.2  37.8    4.8  -0.0479  -0.7    7.9	4U 1735-44
268.2225  -1.6061    0.0   5.2 -171.0   0.0890   2.2   12.7	SW J1753.5-0127
270.4438 -25.1508    5.2  18.6   -6.9   0.0925   2.2    9.7	GX 5-1
270.2120 -25.8306    5.6  19.3   -5.9  -0.0883  -2.0    7.2	GRS 1758-258
274.0342 -14.1843    9.7   9.8  -38.7  -0.0500  -1.2    9.0	GX 17+2
275.7742 -30.5292    0.0  25.0  -15.6  -0.0844  -1.9   12.5	H1820-303
285.0659 -24.7699   15.2  24.6  -39.6   0.0350   0.8    9.2	HT1900.1-2455
288.9474  10.9119    4.8  27.7 -128.1  -0.1242  -2.4    9.0	GRS 1915+105
299.6817  35.0380    4.2  51.6 -144.8  -0.3687  -2.8   10.8	Cyg X-1
262.9699 -33.6848    4.7  27.3    9.7   0.1230   2.5    9.0	GX 354-0
254.2419 -30.8131    0.2  27.1   27.1   2.6309  47.4 ------	UNKNOWN
290.2044  49.4603    4.1  59.6 -161.7   0.6662   2.8 ------	UNKNOWN
304.0631  30.3868    2.8  51.0 -137.3   0.7637   4.0 ------	UNKNOWN
Post-slew image of 15-350 keV band
Time interval of the image:
130.780590 302.250000

# RAcent  DECcent POSerr Theta    Phi  PeakCts   SNR AngSep     Name
#  [deg]    [deg]    ['] [deg]  [deg]                   [']
244.9770 -15.6226    0.9  48.0   -1.8   4.6785  12.5    1.1	Sco X-1
254.5317  35.3945    2.4  11.0 -107.6   0.7721   4.9    4.8	Her X-1
268.3566  -1.5872    3.3  42.2  -39.4   0.9342   3.5    8.1	SW J1753.5-0127
210.2569  30.9443    3.2  26.8   97.8   0.9486   3.6 ------	UNKNOWN
330.5658  74.1730    3.0  58.7 -159.2   3.7844   3.9 ------	UNKNOWN
287.6088  24.1895    2.2  40.8  -88.3   3.1507   5.3 ------	UNKNOWN