Analysis Summary
Notes:
- 1) No attempt has been made to eliminate the non-significant decimal places.
- 2) This batgrbproduct analysis is done using the HEASARC data.
- 3) This batgrbproduct analysis is using the flight position for the mask-weighting calculation.
======================================================================
BAT GRB EVENT DATA PROCESSING REPORT
Process Script Ver: batgrbproduct v2.46
Process Start Time: Wed Jan 22 17:48:25 EST 2014
Host Name: batevent1
Current Working Dir: /local/data/batevent/batevent_reproc/trigger202505
======================================================================
Trigger: 00202505 Segment: 000
BAT Trigger Time: 164817157.12 [s; MET]
Trigger Stop: 164817161.216 [s; MET]
UTC: 2006-03-23T14:32:36.031580 [includes UTCF correction]
Where From?: TDRSS position message
BAT
RA: 174.408567159494 Dec: 49.9749559287599 [deg; J2000]
Catalogged Source?: NO
Point Source?: YES
GRB Indicated?: YES [ by BAT flight software ]
Image S/N Ratio: 9.72
Image Trigger?: NO
Rate S/N Ratio: 12.0415945787923 [ if not an image trigger ]
Image S/N Ratio: 9.72
Analysis Position: [ source = BAT ]
RA: 174.408567159494 Dec: 49.9749559287599 [deg; J2000]
Refined Position: [ source = BAT pre-slew burst ]
RA: 174.423183158918 Dec: 49.9927446855327 [deg; J2000]
{ 11h 37m 41.6s , +49d 59' 33.9" }
+/- 1.51831685528247 [arcmin] (estimated 90% radius based on SNR)
+/- 0.620481290476377 [arcmin] (formal 1-sigma fit error)
SNR: 16.7505556540974
Angular difference between the analysis and refined position is 1.207126 arcmin
Partial Coding Fraction: 0.8046875 [ including projection effects ]
Duration
T90: 23.8719999492168 +/- 5.60339326124083
Measured from: -2.6879999935627
to: 21.1839999556541 [s; relative to TRIGTIME]
T50: 11.7759999930859 +/- 2.20892736378892
Measured from: 0.815999984741211
to: 12.5919999778271 [s; relative to TRIGTIME]
Fluence
Peak Flux (peak 1 second)
Measured from: 2.5959999859333
to: 3.5959999859333 [s; relative to TRIGTIME]
Total Fluence
Measured from: -5.12000000476837
to: 24.4799999892712 [s; relative to TRIGTIME]
Band 1 Band 2 Band 3 Band 4
15-25 25-50 50-100 100-350 keV
Total 0.319907 0.365044 0.300480 0.030001
0.030309 0.031902 0.028556 0.026610 [error]
Peak 0.040100 0.032101 0.015489 0.010026
0.005852 0.006001 0.005619 0.004883 [error]
[ fluence units of on-axis counts / fully illuminated detector ]
======================================================================
====== Table of the duration information =============================
Value tstart tstop
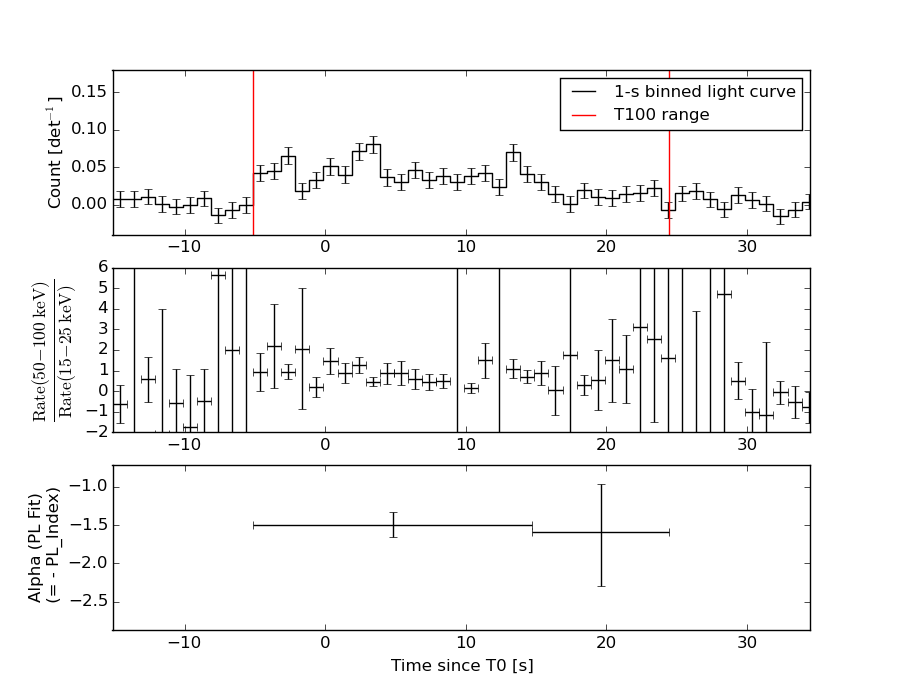
T100 29.600 -5.120 24.480
T90 23.872 -2.688 21.184
T50 11.776 0.816 12.592
Peak 1.000 2.596 3.596
====== Spectral Analysis Summary =====================================
Model : spectral model: simple power-law (PL) and cutoff power-law (CPL)
Ph_index : photon index: E^{Ph_index}
Ph_90err : 90% error of the photon index
Epeak : Epeak in keV
Epeak_90err: 90% error of Epeak
Norm : normalization at 50 keV in both the PL model and CPL model
Nomr_90err : 90% error of the normalization
chi2 : Chi-Squared
dof : degree of freedo
=== Time-averaged spectral analysis ===
(Best model with acceptable fit: PL)
Model Ph_index Ph_90err_low Ph_90err_hi Epeak Epeak_90err_low Epeak_90err_hi Norm Nomr_90err_low Norm_90err_hi chi2 dof
PL -1.535 -0.170 0.167 - - - 2.27e-03 -2.17e-04 2.15e-04 50.400 57
CPL -1.429 -0.837 0.569 265.767 -265.767 -265.767 2.57e-03 -8.98e-04 2.31e-03 50.440 56
=== 1-s peak spectral analysis ===
(Best model with acceptable fit: PL)
Model Ph_index Ph_90err_low Ph_90err_hi Epeak Epeak_90err_low Epeak_90err_hi Norm Nomr_90err_low Norm_90err_hi chi2 dof
PL -1.921 -0.428 0.393 - - - 5.27e-03 -1.42e-03 1.33e-03 51.790 57
CPL -1.936 -1.019 0.122 9999.360 N/A N/A 5.23e-03 N/A N/A 51.800 56
=== Fluence/Peak Flux Summary ===
Model Band1 Band2 Band3 Band4 Band5 Total
15-25 25-50 50-100 100-350 15-150 15-350 keV
Fluence PL 8.87e-08 1.59e-07 2.20e-07 6.31e-07 6.34e-07 1.10e-06 erg/cm2
90%_error_low -1.33e-08 -1.46e-08 -2.86e-08 -1.60e-07 -6.69e-08 -1.86e-07 erg/cm2
90%_error_hi 1.38e-08 1.46e-08 2.86e-08 1.95e-07 6.80e-08 2.15e-07 erg/cm2
Peak flux PL 3.25e-01 2.56e-01 1.35e-01 1.03e-01 7.63e-01 8.20e-01 ph/cm2/s
90%_error_low -8.83e-02 -4.80e-02 -4.70e-02 -5.63e-02 -1.41e-01 -1.58e-01 ph/cm2/s
90%_error_hi 9.02e-02 4.76e-02 4.95e-02 9.12e-02 1.41e-01 1.62e-01 ph/cm2/s
Fluence CPL 8.83e-08 1.60e-07 2.20e-07 6.01e-07 6.32e-07 1.00e-06 erg/cm2
90%_error_low -1.57e-08 -1.50e-08 -2.47e-08 -3.68e-07 -7.50e-08 -3.09e-07 erg/cm2
90%_error_hi 1.12e-08 1.77e-08 2.98e-08 1.43e-07 6.89e-08 1.49e-07 erg/cm2
Peak flux CPL 2.94e-01 1.83e-01 9.60e-02 9.78e-02 6.65e-01 8.30e-01 ph/cm2/s
90%_error_low -1.00e-01 -1.05e-01 -9.60e-02 -3.39e-02 -2.15e-01 N/A ph/cm2/s
90%_error_hi 9.97e-02 8.97e-02 4.00e-02 2.26e-02 2.11e-01 N/A ph/cm2/s
======================================================================
Image
Pre-slew 15.0-350.0 keV image (Event data)
#   RAcent    DECcent   POSerr    Theta     Phi              Peak Cts       SNR   Name
  174.4232    49.9927   0.0114    18.4115   118.9959         1.0445924     16.751 TRIG_00202505

Foreground time interval of the image:
 -5.120  24.480 (delta_t =  29.600 [sec])
Background time interval of the image:
-239.120  -5.120 (delta_t = 234.000 [sec])
Light Curves
Note: The mask-weighted lightcurves have units of either count/det or counts/sec/det, where a det is 0.4 x 0.4 = 0.16 sq cm.
Full-time range; 1 s binning
Other quick-look light curves:
- 64 ms binning (zoomed)
- 16 ms binning (zoomed)
- 8 ms binning (zoomed)
- 2 ms binning (zoomed)
- SN=5 or 10 s binning (full-time range)
- Raw light curve
Spectra
- 64 ms binning (zoomed)
- 16 ms binning (zoomed)
- 8 ms binning (zoomed)
- 2 ms binning (zoomed)
- SN=5 or 10 s binning (full-time range)
- Raw light curve
Spectra
Notes:
- 1) The fitting includes the systematic errors.
- 2) When the burst includes telescope slew time periods, the fitting uses an average response file made from multiple 5-s response files through out the slew time plus single time preiod for the non-slew times, and weighted by the total counts in the corresponding time period using addrmf. An average response file is needed becuase a spectral fit using the pre-slew DRM will introduce some errors in both a spectral shape and a normalization if the PHA file contains a lot of the slew/post-slew time interval.
- 3) For fits to more complicated models (e.g. a power-law over a cutoff power-law), the BAT team has decided to require a chi-square improvement of more than 6 for each extra dof.
Time averaged spectrum fit using the average DRM
Power-law model
Time interval is from   -5.120 sec. to   24.480 sec.

Spectral model in power-law:
------------------------------------------------------------
Parameters  : value       lower 90%   higher 90%
Photon index: -1.53516     ( -0.17012   0.167276 )
Norm@50keV  : 2.26995E-03    ( -0.000217189   0.000214728 )
------------------------------------------------------------
#Fit statistic : Chi-Squared =          50.40 using 59 PHA bins.
# Reduced chi-squared =         0.8843 for     57 degrees of freedom
# Null hypothesis probability =   7.191615e-01

Photon flux (15-150 keV)    in 29.6 sec: 0.286151 ( -0.025761  0.02579 ) ph/cm2/s
Energy fluence (15-150 keV)             : 6.33988e-07 ( -6.6885e-08  6.79714e-08 ) ergs/cm2
Cutoff power-law model

Time interval is from   -5.120 sec. to   24.480 sec.
Spectral model in the cutoff power-law:
------------------------------------------------------------
Parameters  : value       lower 90%   higher 90%
Photon index: -1.53282     ( -0.829946   0.575962 )
Epeak [keV] : 9829.92      ( -9517.87 -9517.87 )
Norm@50keV  : 2.27630E-03    ( -0.000602365   0.00260206 )
------------------------------------------------------------
#Fit statistic : Chi-Squared =          50.40 using 59 PHA bins.
# Reduced chi-squared =         0.9000 for     56 degrees of freedom
# Null hypothesis probability =   6.858528e-01

Photon flux (15-150 keV)    in 29.6 sec: 0.285711 ( -0.027266  0.026023 ) ph/cm2/s
Energy fluence (15-150 keV)             : 6.32312e-07 ( -7.49703e-08  6.89035e-08 ) ergs/cm2
1-s peak spectrum fit
Power-law model
Time interval is from    2.596 sec. to    3.596 sec.

Spectral model in power-law:
------------------------------------------------------------
Parameters  : value       lower 90%   higher 90%
Photon index: -1.92108     ( -0.428463   0.393406 )
Norm@50keV  : 5.26989E-03    ( -0.00142221   0.00133456 )
------------------------------------------------------------
#Fit statistic : Chi-Squared =          51.79 using 59 PHA bins.
# Reduced chi-squared =         0.9087 for     57 degrees of freedom
# Null hypothesis probability =   6.701560e-01

Photon flux (15-150 keV)    in 1 sec: 0.763189 ( -0.14085  0.140877 ) ph/cm2/s
Energy fluence (15-150 keV)             : 4.84697e-08 ( -1.19834e-08  1.28034e-08 ) ergs/cm2
Cutoff power-law model
Time interval is from    2.596 sec. to    3.596 sec.
Spectral model in the cutoff power-law:
------------------------------------------------------------
Parameters  : value       lower 90%   higher 90%
Photon index: -2.69549     ( -0.258513   0.882697 )
Epeak [keV] : 225.343      (   )
Norm@50keV  : 2.09788E-03    (     )
------------------------------------------------------------
#Fit statistic : Chi-Squared =          49.29 using 59 PHA bins.
# Reduced chi-squared =         0.8802 for     56 degrees of freedom
# Null hypothesis probability =   7.248097e-01

Photon flux (15-150 keV)    in 1 sec: 0.665123 ( -0.214997  0.210949 ) ph/cm2/s
Energy fluence (15-150 keV)             : 4.36445e-08 ( -1.4613e-08  1.23132e-08 ) ergs/cm2
Time-resolved spectra
Distribution
T90 vs. Hardness ratio plot
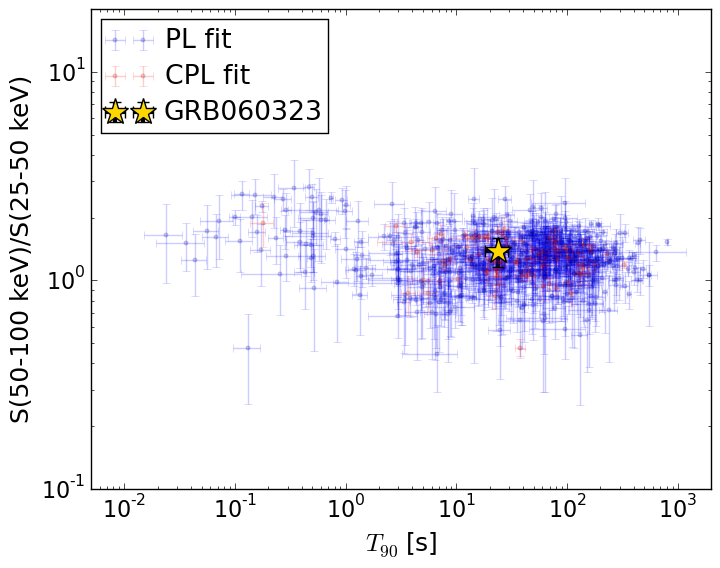
T90                                   = 23.872 sec.
Hardness ratio (energy fluence ratio) = 1.38019404521
S(15-50 keV) vs. S(50-150 keV) plot
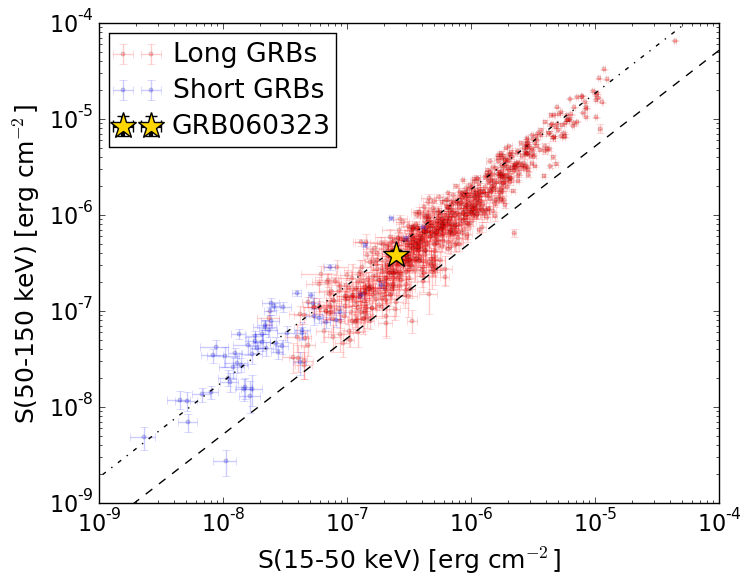
S(15-50 keV)  = 2.4815138e-07
S(50-150 keV) = 3.85845e-07
The dash-dotted line and the dashed line traces the fluences calculated from the Band function with Epeak = 15 and 150 keV, respectively. Both lines assume a canonical values of alpha = -1 and beta = -2.5.
Mask shadow pattern
IMX = -1.613621644231447E-01, IMY = -2.911546454777059E-01
Spacecraft aspect plot
Bright source in the pre-burst/pre-slew/post-slew images
Pre-burst image of 15-350 keV band
Time interval of the image:
-239.120000 -5.120000

# RAcent  DECcent POSerr Theta    Phi  PeakCts   SNR AngSep     Name
#  [deg]    [deg]    ['] [deg]  [deg]                   [']
254.4308  35.3972    6.1  43.9  -14.1   0.5042   1.9    3.5	Her X-1
179.0869  26.2689    2.6  39.1   91.7   2.9736   4.4 ------	UNKNOWN
198.0252  39.6928    2.3  23.6   64.2   0.9630   5.1 ------	UNKNOWN
252.9836  47.5556    2.7  33.5  -24.5   0.8553   4.3 ------	UNKNOWN
 87.7913  47.8509    2.6  56.2 -165.3   2.8769   4.5 ------	UNKNOWN
282.5243  66.2105    2.8  33.4  -69.2   1.2558   4.1 ------	UNKNOWN
Pre-slew background subtracted image of 15-350 keV band
Time interval of the image:
-5.120000 24.480000

# RAcent  DECcent POSerr Theta    Phi  PeakCts   SNR AngSep     Name
#  [deg]    [deg]    ['] [deg]  [deg]                   [']
254.4140  35.2209    4.3  44.0  -14.0   0.2530   2.7    7.6	Her X-1
174.4232  49.9927    0.7  18.4  119.0   1.0445  16.8 ------	UNKNOWN
263.1864  53.1491    2.3  34.0  -39.9   0.3967   5.0 ------	UNKNOWN
Post-slew image of 15-350 keV band
Time interval of the image:
152.380620 164.780590

# RAcent  DECcent POSerr Theta    Phi  PeakCts   SNR AngSep     Name
#  [deg]    [deg]    ['] [deg]  [deg]                   [']
245.0228 -15.6342    0.8  23.8   60.9   0.6905  14.6    2.5	Sco X-1
254.5893  35.2884    7.7  43.7  159.5   0.1275   1.5    7.2	Her X-1
255.9924 -37.6929    9.6  32.7   11.9  -0.0594  -1.2    9.1	4U 1700-377
256.4516 -36.3138    7.2  31.3   12.2   0.0778   1.6    6.6	GX 349+2
263.0164 -24.8973    5.2  18.7    7.8  -0.0851  -2.2    9.1	GX 1+4
264.8014 -44.5025  180.3  37.9   -2.0   0.0033   0.1    4.0	4U 1735-44
268.2125  -1.5137    6.8   5.2 -178.0   0.0645   1.7   10.0	SW J1753.5-0127
270.1202 -25.1385    5.1  18.6  -12.5   0.0816   2.3    9.6	GX 5-1
270.2032 -25.8871    5.4  19.3  -12.4   0.0782   2.1   10.2	GRS 1758-258
274.0134 -13.8877   12.7   9.6  -46.2   0.0333   0.9    8.9	GX 17+2
275.7509 -30.5135    0.0  25.0  -22.0   0.0242   0.6   12.6	H1820-303
284.9100 -25.0686    7.1  24.7  -45.4  -0.0744  -1.6   11.2	HT1900.1-2455
288.8903  10.8273    2.7  27.5 -134.6   0.1807   4.3    8.9	GRS 1915+105
299.6103  35.1419    3.7  51.6 -151.6   0.3762   3.1    3.7	Cyg X-1
263.1436 -33.8121  182.4  27.4    2.8  -0.0027  -0.1    7.8	GX 354-0
267.1577 -24.1420    2.7  17.4   -3.9   0.1509   4.2 ------	UNKNOWN
276.6400 -62.1814    2.5  55.9  -10.3   0.5822   4.6 ------	UNKNOWN
297.5352  46.7325    2.8  59.7 -161.8   0.9987   4.2 ------	UNKNOWN
299.3908   7.4071    2.2  34.7 -118.6   0.3331   5.2 ------	UNKNOWN
305.2425 -45.3925    2.2  50.6  -38.9   0.7560   5.2 ------	UNKNOWN