Analysis Summary
Notes:
- 1) No attempt has been made to eliminate the non-significant decimal places.
- 2) This batgrbproduct analysis is done using the HEASARC data.
- 3) This batgrbproduct analysis is using the flight position for the mask-weighting calculation.
======================================================================
                  BAT GRB EVENT DATA PROCESSING REPORT
    Process Script Ver: batgrbproduct v2.46
    Process Start Time: Wed Jan 22 17:40:27 EST 2014
             Host Name: batevent1
   Current Working Dir: /local/data/batevent/batevent_reproc/trigger203755
======================================================================

  Trigger: 00203755      Segment: 000

  BAT Trigger Time: 165762738.24   [s; MET]
      Trigger Stop: 165762739.264   [s; MET]
               UTC: 2006-04-03T13:12:17.129580    [includes UTCF correction]
       Where From?: TDRSS position message

  BAT
    RA: 282.306272499452   Dec: 8.32978203469296  [deg; J2000]

     Catalogged Source?: NO
     Point Source?:      YES
     GRB Indicated?:     YES    [ by BAT flight software ]
     Image S/N Ratio:    9.6
     Image Trigger?:     NO
     Rate S/N Ratio:     20.1246117974981  [ if not an image trigger ]
     Image S/N Ratio:    9.6

  Analysis Position:   [ source = BAT ]
    RA: 282.306272499452   Dec: 8.32978203469296  [deg; J2000]

  Refined Position:   [ source = BAT pre-slew burst ]
    RA: 282.333447785968   Dec: 8.32846521857071  [deg; J2000]
        { 18h 49m 20.0s , +08d 19' 42.5" }
         +/- 1.04859455311469 [arcmin] (estimated 90% radius based on SNR)
         +/- 0.374597280607624 [arcmin] (formal 1-sigma fit error)
    SNR: 28.4235916402692

  Angular difference between the analysis and refined position is 1.615252 arcmin

  Partial Coding Fraction: 1    [ including projection effects ]

  Duration
     T90: 30.5879999995232 +/- 4.84125316037351
        Measured from: -4.06000000238419
                   to: 26.527999997139     [s; relative to TRIGTIME]
     T50: 14.1879999935627 +/- 1.80021887130349
        Measured from: 0.19200000166893
                   to: 14.3799999952316     [s; relative to TRIGTIME]


  Fluence
     Peak Flux  (peak 1 second)
        Measured from: 1.80799999833107
                   to: 2.80799999833107     [s; relative to TRIGTIME]
     Total Fluence
        Measured from: -6.16800001263618
                   to: 33.1719999909401     [s; relative to TRIGTIME]

             Band 1     Band 2     Band 3     Band 4
              15-25      25-50     50-100    100-350     keV
 Total     0.341202   0.715541   0.681068   0.181609
           0.034532   0.035222   0.030494   0.025045 [error]
 Peak      0.014306   0.048049   0.053549   0.015797
           0.005537   0.005938   0.005411   0.004233 [error]

     [ fluence units of on-axis counts / fully illuminated detector ]

======================================================================


====== Table of the duration information =============================

        Value   tstart    tstop
T100   39.340   -6.168   33.172
T90    30.588   -4.060   26.528
T50    14.188    0.192   14.380
Peak    1.000    1.808    2.808


====== Spectral Analysis Summary =====================================

Model      : spectral model: simple power-law (PL) and cutoff power-law (CPL)
Ph_index   : photon index: E^{Ph_index}
Ph_90err   : 90% error of the photon index
Epeak      : Epeak in keV
Epeak_90err: 90% error of Epeak
Norm       : normalization at 50 keV in both the PL model and CPL model
Nomr_90err : 90% error of the normalization
chi2       : Chi-Squared
dof        : degree of freedo

=== Time-averaged spectral analysis ===
(Best model with acceptable fit: PL)

Model Ph_index Ph_90err_low Ph_90err_hi  Epeak  Epeak_90err_low  Epeak_90err_hi  Norm       Nomr_90err_low    Norm_90err_hi    chi2    dof
PL      -1.052    -0.090      0.092       -           -               -         3.25e-03     -1.69e-04          1.69e-04      53.340   57
CPL     -0.693    -0.352      0.378      205.877     -77.300      2060.493      4.72e-03     -1.34e-03          2.17e-03      50.200   56


=== 1-s peak spectral analysis ===
(Best model with acceptable fit: PL)

Model Ph_index Ph_90err_low Ph_90err_hi  Epeak  Epeak_90err_low  Epeak_90err_hi  Norm       Nomr_90err_low    Norm_90err_hi    chi2    dof
PL      -0.790     -0.210     0.222       -           -               -         8.27e-03     -1.13e-03          1.12e-03      67.910   57
CPL      0.542     -0.973     1.274      115.559     -29.167       135.978      2.96e-02     -1.76e-02          6.00e-02      61.960   56


=== Fluence/Peak Flux Summary ===

              Model    Band1     Band2     Band3     Band4     Band5     Total
                       15-25     25-50    50-100    100-350    15-150    15-350    keV
Fluence         PL   1.07e-07  2.60e-07  5.02e-07  2.38e-06  1.36e-06  3.24e-06   erg/cm2
      90%_error_low -1.13e-08 -1.67e-08 -2.83e-08 -2.95e-07 -7.40e-08 -3.10e-07   erg/cm2
      90%_error_hi   1.17e-08  1.65e-08  2.82e-08  3.25e-07  7.42e-08  3.36e-07   erg/cm2
Peak flux       PL   1.73e-01  2.67e-01  3.09e-01  6.85e-01  9.51e-01  1.43e+00   ph/cm2/s
      90%_error_low -4.60e-02 -4.70e-02 -4.01e-02 -1.70e-01 -1.26e-01 -2.01e-01   ph/cm2/s
      90%_error_hi   5.13e-02  4.67e-02  4.00e-02  2.05e-01  1.27e-01  2.12e-01   ph/cm2/s

Fluence        CPL   9.85e-08  2.67e-07  5.20e-07  1.48e-06  1.33e-06  2.36e-06   erg/cm2
      90%_error_low -1.39e-08 -1.82e-08 -3.34e-08 -5.14e-07 -7.97e-08 -5.11e-07   erg/cm2
      90%_error_hi   1.43e-08  1.85e-08  3.37e-08  8.56e-07  7.92e-08  8.18e-07   erg/cm2
Peak flux      CPL   1.15e-01  2.75e-01  3.58e-01  2.61e-01  9.08e-01  1.01e+00   ph/cm2/s
      90%_error_low -5.24e-02 -5.60e-02 -5.32e-02 -1.21e-01 -1.30e-01 -1.80e-01   ph/cm2/s
      90%_error_hi   6.22e-02  5.50e-02  5.48e-02  2.45e-01  1.31e-01  2.63e-01   ph/cm2/s

======================================================================
Image
Pre-slew 15.0-350.0 keV image (Event data)
#   RAcent    DECcent   POSerr    Theta     Phi              Peak Cts       SNR   Name
  282.3334     8.3285   0.0067     4.5154    89.9173         1.4445643     28.424 TRIG_00203755

Foreground time interval of the image:
 -6.168  14.061 (delta_t =  20.229 [sec])
Background time interval of the image:
-239.240  -6.168 (delta_t = 233.072 [sec])
Light Curves
Note: The mask-weighted lightcurves have units of either count/det or counts/sec/det, where a det is 0.4 x 0.4 = 0.16 sq cm.
Full-time range; 1 s binning
Other quick-look light curves:
- 64 ms binning (zoomed)
- 16 ms binning (zoomed)
- 8 ms binning (zoomed)
- 2 ms binning (zoomed)
- SN=5 or 10 s binning (full-time range)
- Raw light curve
Spectra
- 64 ms binning (zoomed)
- 16 ms binning (zoomed)
- 8 ms binning (zoomed)
- 2 ms binning (zoomed)
- SN=5 or 10 s binning (full-time range)
- Raw light curve
Spectra
Notes:
- 1) The fitting includes the systematic errors.
- 2) When the burst includes telescope slew time periods, the fitting uses an average response file made from multiple 5-s response files through out the slew time plus single time preiod for the non-slew times, and weighted by the total counts in the corresponding time period using addrmf. An average response file is needed becuase a spectral fit using the pre-slew DRM will introduce some errors in both a spectral shape and a normalization if the PHA file contains a lot of the slew/post-slew time interval.
- 3) For fits to more complicated models (e.g. a power-law over a cutoff power-law), the BAT team has decided to require a chi-square improvement of more than 6 for each extra dof.
Time averaged spectrum fit using the average DRM
Power-law model

Time interval is from   -6.168 sec. to   33.172 sec.

Spectral model in power-law:
------------------------------------------------------------
Parameters  : value       lower 90%   higher 90%
Photon index: -1.05151     ( -0.089951   0.0916052 )
Norm@50keV  : 3.24730E-03    ( -0.000169014   0.000168649 )
------------------------------------------------------------
#Fit statistic : Chi-Squared =          53.34 using 59 PHA bins.
# Reduced chi-squared =         0.9357 for     57 degrees of freedom
# Null hypothesis probability =   6.132866e-01

Photon flux (15-150 keV)    in 39.34 sec: 0.375094 ( -0.02016  0.020202 ) ph/cm2/s
Energy fluence (15-150 keV)             : 1.3572e-06 ( -7.40025e-08  7.42086e-08 ) ergs/cm2
Cutoff power-law model
Time interval is from   -6.168 sec. to   33.172 sec.
Spectral model in the cutoff power-law:
------------------------------------------------------------
Parameters  : value       lower 90%   higher 90%
Photon index: -0.693089     ( -0.352122   0.378324 )
Epeak [keV] : 205.877      ( -77.3008 2060.49 )
Norm@50keV  : 4.71591E-03    ( -0.00134366   0.00217095 )
------------------------------------------------------------
#Fit statistic : Chi-Squared =          50.20 using 59 PHA bins.
# Reduced chi-squared =         0.8964 for     56 degrees of freedom
# Null hypothesis probability =   6.930908e-01

Photon flux (15-150 keV)    in 39.34 sec: 0.369087 ( -0.020964  0.020986 ) ph/cm2/s
Energy fluence (15-150 keV)             : 1.32998e-06 ( -7.96788e-08  7.91938e-08 ) ergs/cm2
1-s peak spectrum fit
Power-law model
Time interval is from    1.808 sec. to    2.808 sec.

Spectral model in power-law:
------------------------------------------------------------
Parameters  : value       lower 90%   higher 90%
Photon index: -0.790429     ( -0.209754   0.221996 )
Norm@50keV  : 8.27168E-03    ( -0.00113361   0.0011195 )
------------------------------------------------------------
#Fit statistic : Chi-Squared =          67.91 using 59 PHA bins.
# Reduced chi-squared =          1.191 for     57 degrees of freedom
# Null hypothesis probability =   1.528125e-01

Photon flux (15-150 keV)    in 1 sec: 0.951004 ( -0.126353  0.126996 ) ph/cm2/s
Energy fluence (15-150 keV)             : 9.70644e-08 ( -1.29423e-08  1.29957e-08 ) ergs/cm2
Cutoff power-law model
Time interval is from    1.808 sec. to    2.808 sec.
Spectral model in the cutoff power-law:
------------------------------------------------------------
Parameters  : value       lower 90%   higher 90%
Photon index: 0.541877     ( -0.973112   1.27392 )
Epeak [keV] : 115.559      ( -29.1659 135.98 )
Norm@50keV  : 2.95673E-02    ( -0.0175646   0.059989 )
------------------------------------------------------------
#Fit statistic : Chi-Squared =          61.96 using 59 PHA bins.
# Reduced chi-squared =          1.106 for     56 degrees of freedom
# Null hypothesis probability =   2.720980e-01

Photon flux (15-150 keV)    in 1 sec: 0.907664 ( -0.129536  0.130546 ) ph/cm2/s
Energy fluence (15-150 keV)             : 9.24123e-08 ( -1.38598e-08  1.3789e-08 ) ergs/cm2
Time-resolved spectra
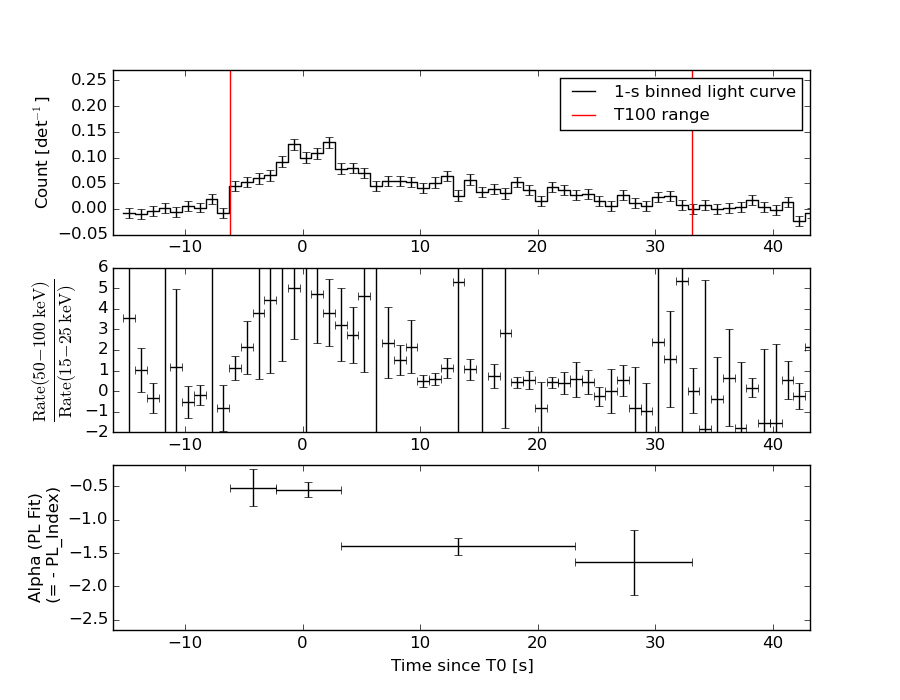
Distribution
T90 vs. Hardness ratio plot
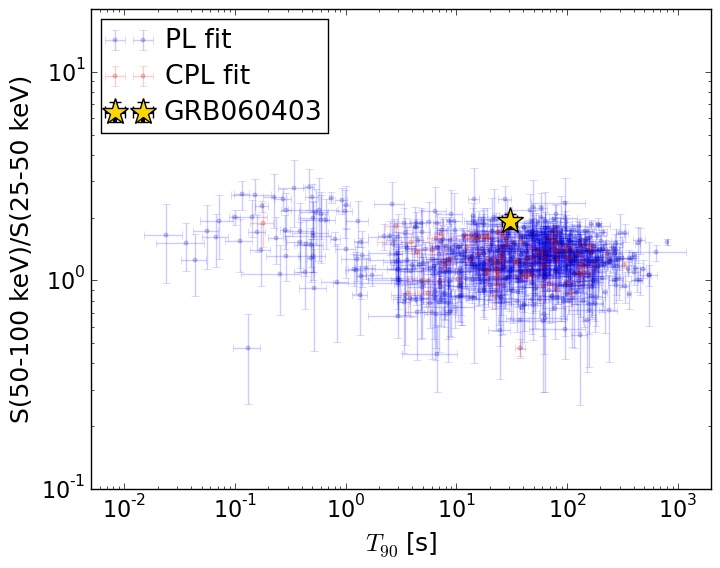
T90                                   = 30.588 sec.
Hardness ratio (energy fluence ratio) = 1.92987780013
S(15-50 keV) vs. S(50-150 keV) plot
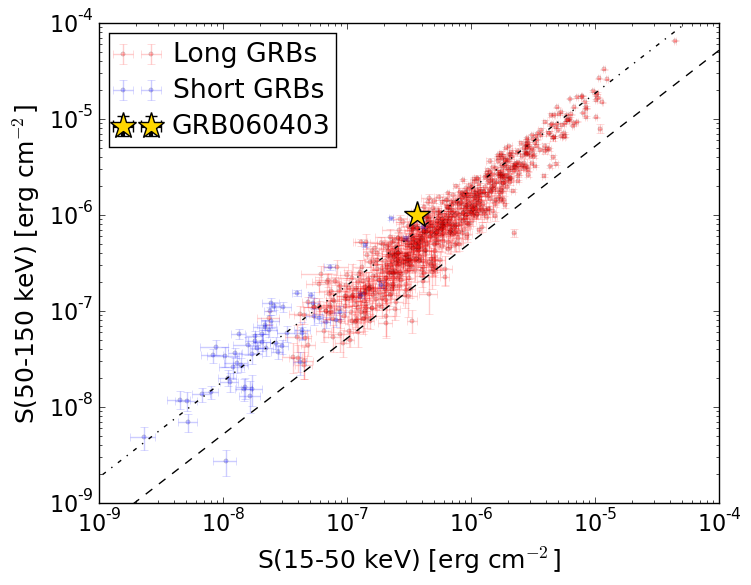
S(15-50 keV)  = 3.672854e-07
S(50-150 keV) = 9.899171e-07
The dash-dotted line and the dashed line traces the fluences calculated from the Band function with Epeak = 15 and 150 keV, respectively. Both lines assume a canonical values of alpha = -1 and beta = -2.5.
Mask shadow pattern
IMX = 1.140449292239489E-04, IMY = -7.897123620050106E-02
Spacecraft aspect plot
Bright source in the pre-burst/pre-slew/post-slew images
Pre-burst image of 15-350 keV band
Time interval of the image:
-239.240000 -6.168000

# RAcent  DECcent POSerr Theta    Phi  PeakCts   SNR AngSep     Name
#  [deg]    [deg]    ['] [deg]  [deg]                   [']
254.4556  35.3766   66.0  39.3  148.6  -0.0677  -0.2    2.1	Her X-1
263.0097 -24.7566    8.6  41.2   45.9   0.5880   1.3    0.7	GX 1+4
268.2689  -1.5076    5.8  21.4   72.7   0.4436   2.0    6.8	SW J1753.5-0127
270.2638 -25.0541    2.4  38.0   36.9   1.5310   4.8    1.9	GX 5-1
270.4527 -25.8189    4.8  38.6   36.1   0.7649   2.4    9.3	GRS 1758-258
273.9684 -13.8968    8.8  26.5   41.0   0.3284   1.3    8.7	GX 17+2
275.9865 -30.4141    7.1  41.1   26.4   0.5928   1.6    4.3	H1820-303
285.1766 -24.9314    7.1  34.3   14.7   0.4089   1.6    7.7	HT1900.1-2455
288.8155  10.9613    0.6   2.6 -117.8   3.8924  19.4    1.4	GRS 1915+105
299.6080  35.2127    0.5  28.4 -145.5   5.4371  23.7    1.1	Cyg X-1
308.1098  40.9600   41.7  36.8 -140.6  -0.0797  -0.3    0.4	Cyg X-3
262.9551 -33.8267  282.1  48.7   38.6   0.0373   0.0    1.8	GX 354-0
252.2004  16.6758    3.2  34.5  118.1   1.4003   3.6 ------	UNKNOWN
250.1226  41.8034    2.2  45.7  153.7   2.5726   5.2 ------	UNKNOWN
293.1456  -3.1550    2.3  14.0  -15.1   0.8766   5.0 ------	UNKNOWN
298.3009  17.1289    2.6  13.7 -114.0   0.8486   4.4 ------	UNKNOWN
290.7843  68.2829    3.0  59.0 -166.2   4.8624   3.9 ------	UNKNOWN
312.0076  65.9628    3.8  59.2 -156.2   4.6648   3.0 ------	UNKNOWN
Pre-slew background subtracted image of 15-350 keV band
Time interval of the image:
-6.168000 14.060580

# RAcent  DECcent POSerr Theta    Phi  PeakCts   SNR AngSep     Name
#  [deg]    [deg]    ['] [deg]  [deg]                   [']
254.5362  35.5462   45.5  39.4  148.9   0.0248   0.3   12.8	Her X-1
263.0218 -24.7763    5.1  41.2   45.8  -0.2776  -2.3    2.0	GX 1+4
268.5338  -1.4980   23.6  21.2   72.3  -0.0302  -0.5   10.3	SW J1753.5-0127
270.2851 -25.1229   11.9  38.0   36.8  -0.0866  -1.0    2.6	GX 5-1
270.2466 -25.6967    5.9  38.5   36.4  -0.1760  -2.0    4.1	GRS 1758-258
273.8990 -14.1966    0.0  26.8   40.8  -0.0507  -0.8   11.4	GX 17+2
275.8308 -30.5165    0.0  41.2   26.5   0.1359   1.5   10.2	H1820-303
285.0719 -25.0056   29.9  34.4   14.9   0.0253   0.4    5.5	HT1900.1-2455
288.8165  10.9709   93.8   2.6 -117.9  -0.0059  -0.1    1.9	GRS 1915+105
299.4030  35.2688    7.4  28.4 -145.9   0.0904   1.6   10.0	Cyg X-1
308.1314  41.0233    5.9  36.9 -140.7   0.1482   2.0    4.3	Cyg X-3
262.9858 -33.9669   11.0  48.8   38.5   0.2545   1.1    7.9	GX 354-0
260.3006  49.0753    2.8  45.5  167.9   0.4299   4.2 ------	UNKNOWN
282.3334   8.3285    0.4   4.5   89.9   1.4447  28.4 ------	UNKNOWN
296.0779 -26.5146    2.4  36.9   -1.8   0.3341   4.9 ------	UNKNOWN
312.9743  43.8153    2.2  41.3 -139.1   0.4710   5.2 ------	UNKNOWN
Post-slew image of 15-350 keV band
Time interval of the image:
40.660600 274.660620

# RAcent  DECcent POSerr Theta    Phi  PeakCts   SNR AngSep     Name
#  [deg]    [deg]    ['] [deg]  [deg]                   [']
254.5064  35.2617    8.3  37.0  146.2   0.4821   1.4    5.4	Her X-1
263.1503 -24.7296   20.9  38.0   34.4   0.1694   0.5    7.8	GX 1+4
268.2900  -1.5156    3.2  17.1   60.9   0.7194   3.6    6.0	SW J1753.5-0127
270.3485 -25.0676    2.4  35.4   24.3   1.2979   4.9    3.6	GX 5-1
270.1744 -25.5960    3.7  35.9   24.3   0.8517   3.1   11.2	GRS 1758-258
274.1634 -14.1353    6.5  23.9   25.3  -0.3514  -1.8   10.9	GX 17+2
275.9610 -30.3725    8.9  39.2   14.1   0.3471   1.3    1.9	H1820-303
285.1218 -24.9455    6.4  33.4    0.8   0.4365   1.8    4.9	HT1900.1-2455
288.7740  10.9408    0.6   6.9 -107.5   3.4512  19.0    1.5	GRS 1915+105
299.5946  35.2037    0.5  31.2 -146.6   5.0064  23.1    0.2	Cyg X-1
308.0805  40.9092   16.4  39.8 -143.7   0.2420   0.7    2.9	Cyg X-3
262.8524 -33.8574   33.0  46.0   28.0  -0.1731  -0.3    6.9	GX 354-0
247.7490   9.3771    2.3  34.1   99.9   2.0200   5.0 ------	UNKNOWN
289.7773  49.8576    2.7  42.0 -167.4   1.2471   4.2 ------	UNKNOWN
306.0013  59.6219    2.9  54.3 -160.1   2.5520   4.0 ------	UNKNOWN
312.1862 -38.0610    2.4  54.1  -23.6   2.8249   4.7 ------	UNKNOWN