Analysis Summary
Notes:
- 1) No attempt has been made to eliminate the non-significant decimal places.
- 2) This batgrbproduct analysis is done using the HEASARC data.
- 3) This batgrbproduct analysis is using the flight position for the mask-weighting calculation.
======================================================================
                  BAT GRB EVENT DATA PROCESSING REPORT
    Process Script Ver: batgrbproduct v2.46
    Process Start Time: Wed Jan 22 17:34:16 EST 2014
             Host Name: batevent1
   Current Working Dir: /local/data/batevent/batevent_reproc/trigger205096
======================================================================

  Trigger: 00205096      Segment: 000

  BAT Trigger Time: 166646424   [s; MET]
      Trigger Stop: 166646488   [s; MET]
               UTC: 2006-04-13T18:40:22.869180    [includes UTCF correction]
       Where From?: TDRSS position message

  BAT
    RA: 291.299608710978   Dec: 13.807879439934  [deg; J2000]

     Catalogged Source?: NO
     Point Source?:      YES
     GRB Indicated?:     YES    [ by BAT flight software ]
     Image S/N Ratio:    7.26
     Image Trigger?:     YES
     Rate S/N Ratio:     0  [ if not an image trigger ]
     Image S/N Ratio:    7.26

  Analysis Position:   [ source = BAT ]
    RA: 291.299608710978   Dec: 13.807879439934  [deg; J2000]

  Refined Position:   [ source = BAT pre-slew burst ]
    RA: 291.292926282381   Dec: 13.7473285945198  [deg; J2000]
        { 19h 25m 10.3s , +13d 44' 50.4" }
         +/- 1.91165478341018 [arcmin] (estimated 90% radius based on SNR)
         +/- 0.688252182555294 [arcmin] (formal 1-sigma fit error)
    SNR: 12.0532691497615

  Angular difference between the analysis and refined position is 3.653861 arcmin

  Partial Coding Fraction: 1.03125    [ including projection effects ]

  Duration
     T90: 141.124000012875 +/- 20.5971195106687
        Measured from: 53.16400000453
                   to: 194.288000017405     [s; relative to TRIGTIME]
     T50: 37.3480000197887 +/- 3.18845732972999
        Measured from: 83.8240000009537
                   to: 121.172000020742     [s; relative to TRIGTIME]


  Fluence
     Peak Flux  (peak 1 second)
        Measured from: 90.1599999964237
                   to: 91.1599999964237     [s; relative to TRIGTIME]
     Total Fluence
        Measured from: 29.9760000109673
                   to: 246.944000005722     [s; relative to TRIGTIME]

             Band 1     Band 2     Band 3     Band 4
              15-25      25-50     50-100    100-350     keV
 Total     2.044615   2.345358   1.608454   0.352370
           0.073645   0.073594   0.061361   0.049097 [error]
 Peak      0.042131   0.043144   0.027559   0.008898
           0.005185   0.005478   0.004516   0.003394 [error]

     [ fluence units of on-axis counts / fully illuminated detector ]

======================================================================


====== Table of the duration information =============================

        Value   tstart    tstop
T100  216.968   29.976  246.944
T90   141.124   53.164  194.288
T50    37.348   83.824  121.172
Peak    1.000   90.160   91.160


====== Spectral Analysis Summary =====================================

Model      : spectral model: simple power-law (PL) and cutoff power-law (CPL)
Ph_index   : photon index: E^{Ph_index}
Ph_90err   : 90% error of the photon index
Epeak      : Epeak in keV
Epeak_90err: 90% error of Epeak
Norm       : normalization at 50 keV in both the PL model and CPL model
Nomr_90err : 90% error of the normalization
chi2       : Chi-Squared
dof        : degree of freedo

=== Time-averaged spectral analysis ===
(Best model with acceptable fit: PL)

Model Ph_index Ph_90err_low Ph_90err_hi  Epeak  Epeak_90err_low  Epeak_90err_hi  Norm       Nomr_90err_low    Norm_90err_hi    chi2    dof
PL      -1.662    -0.072      0.072       -           -               -         1.76e-03     -6.77e-05          6.75e-05      41.730   57
CPL     -1.528    -0.226      0.295      179.265     -89.914      -179.265      2.05e-03     -3.43e-04          7.86e-04      41.060   56


=== 1-s peak spectral analysis ===
(Best model with acceptable fit: PL)

Model Ph_index Ph_90err_low Ph_90err_hi  Epeak  Epeak_90err_low  Epeak_90err_hi  Norm       Nomr_90err_low    Norm_90err_hi    chi2    dof
PL      -1.743     -0.241     0.231       -           -               -         6.83e-03     -1.05e-03          1.02e-03      51.740   57
CPL     -1.575     -0.588     0.997      112.065     -68.664      -112.065      8.50e-03        N/A               N/A         51.630   56


=== Fluence/Peak Flux Summary ===

              Model    Band1     Band2     Band3     Band4     Band5     Total
                       15-25     25-50    50-100    100-350    15-150    15-350    keV
Fluence         PL   5.69e-07  9.47e-07  1.20e-06  3.02e-06  3.56e-06  5.73e-06   erg/cm2
      90%_error_low -3.91e-08 -3.80e-08 -6.12e-08 -3.30e-07 -1.44e-07 -3.73e-07   erg/cm2
      90%_error_hi   4.01e-08  3.79e-08  6.11e-08  3.57e-07  1.44e-07  3.94e-07   erg/cm2
Peak flux       PL   3.55e-01  3.10e-01  1.85e-01  1.67e-01  9.22e-01  1.02e+00   ph/cm2/s
      90%_error_low -6.91e-02 -4.08e-02 -3.68e-02 -5.68e-02 -1.21e-01 -1.36e-01   ph/cm2/s
      90%_error_hi   7.16e-02  4.07e-02  3.69e-02  7.23e-02  1.21e-01  1.37e-01   ph/cm2/s

Fluence        CPL   5.54e-07  9.57e-07  1.21e-06  2.46e-06  3.52e-06  5.18e-06   erg/cm2
      90%_error_low -4.93e-08 -4.25e-08 -6.41e-08 -8.23e-07 -1.66e-07 -8.39e-07   erg/cm2
      90%_error_hi   4.62e-08  4.35e-08  6.48e-08  6.46e-07  1.65e-07  6.96e-07   erg/cm2
Peak flux      CPL   3.49e-01  3.16e-01  1.86e-01  1.30e-01  9.17e-01  9.82e-01   ph/cm2/s
      90%_error_low -7.69e-02 -4.66e-02 -3.73e-02 -1.30e-01 -1.24e-01 -1.64e-01   ph/cm2/s
      90%_error_hi   7.44e-02  5.47e-02  3.87e-02  7.88e-02  1.23e-01  1.68e-01   ph/cm2/s

======================================================================
Image
Pre-slew 15.0-350.0 keV image (Event data)
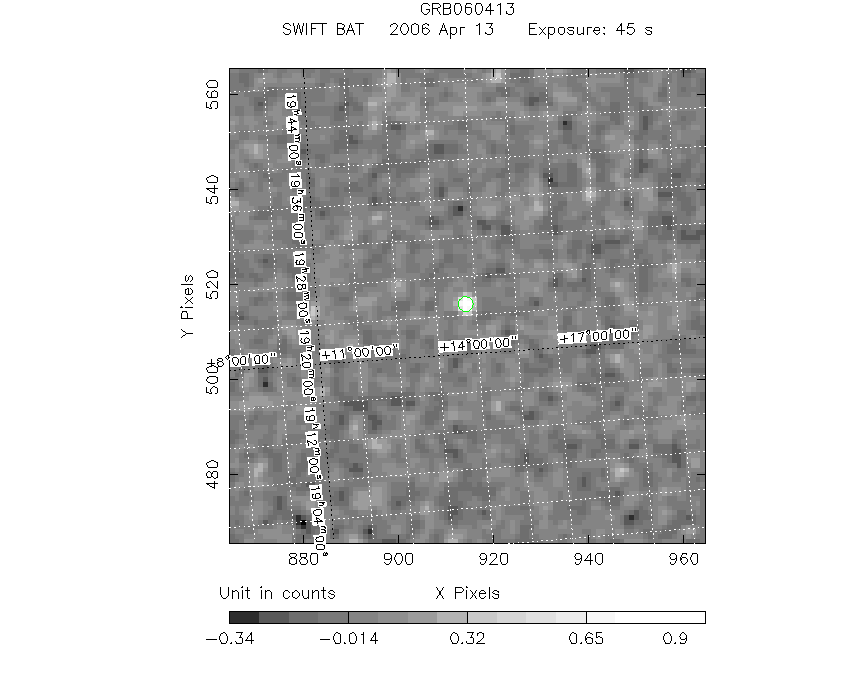
#   RAcent    DECcent   POSerr    Theta     Phi              Peak Cts       SNR   Name
  291.2929    13.7473   0.0160     6.2665  -131.2762         1.0441791     12.053 TRIG_00205096

Foreground time interval of the image:
 29.976  74.901 (delta_t =  44.925 [sec])
Background time interval of the image:
 -5.699  29.976 (delta_t =  35.675 [sec])
Light Curves
Note: The mask-weighted lightcurves have units of either count/det or counts/sec/det, where a det is 0.4 x 0.4 = 0.16 sq cm.
Full-time range; 1 s binning
Other quick-look light curves:
- 64 ms binning (zoomed)
- 16 ms binning (zoomed)
- 8 ms binning (zoomed)
- 2 ms binning (zoomed)
- SN=5 or 10 s binning (full-time range)
- Raw light curve
Spectra
- 64 ms binning (zoomed)
- 16 ms binning (zoomed)
- 8 ms binning (zoomed)
- 2 ms binning (zoomed)
- SN=5 or 10 s binning (full-time range)
- Raw light curve
Spectra
Notes:
- 1) The fitting includes the systematic errors.
- 2) When the burst includes telescope slew time periods, the fitting uses an average response file made from multiple 5-s response files through out the slew time plus single time preiod for the non-slew times, and weighted by the total counts in the corresponding time period using addrmf. An average response file is needed becuase a spectral fit using the pre-slew DRM will introduce some errors in both a spectral shape and a normalization if the PHA file contains a lot of the slew/post-slew time interval.
- 3) For fits to more complicated models (e.g. a power-law over a cutoff power-law), the BAT team has decided to require a chi-square improvement of more than 6 for each extra dof.
Time averaged spectrum fit using the average DRM
Power-law model
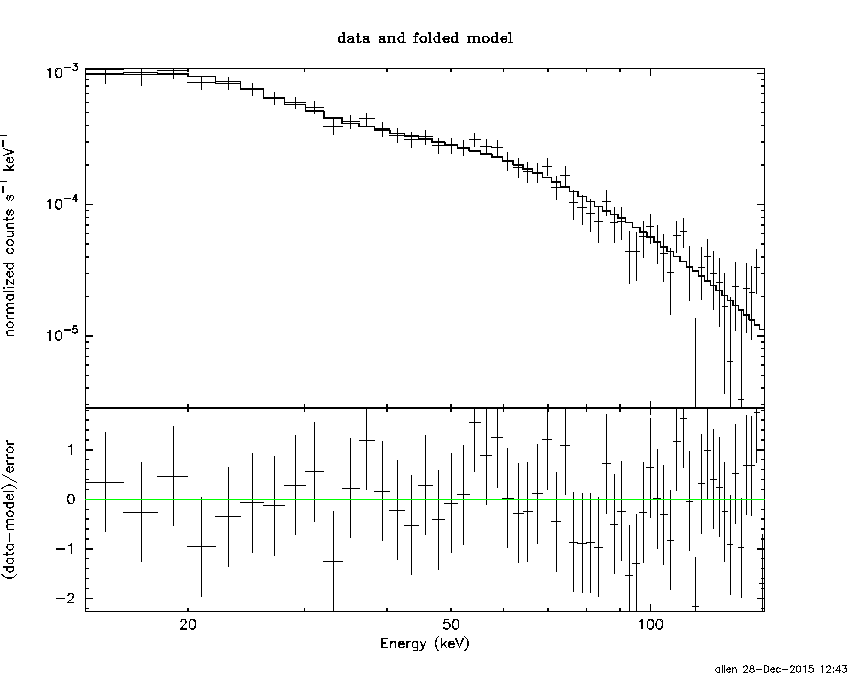
Time interval is from   29.976 sec. to  246.944 sec.

Spectral model in power-law:
------------------------------------------------------------
Parameters  : value       lower 90%   higher 90%
Photon index: -1.66246     ( -0.0723175   0.0718946 )
Norm@50keV  : 1.76374E-03    ( -6.77225e-05   6.74861e-05 )
------------------------------------------------------------
#Fit statistic : Chi-Squared =          41.73 using 59 PHA bins.
# Reduced chi-squared =         0.7320 for     57 degrees of freedom
# Null hypothesis probability =   9.356092e-01

Photon flux (15-150 keV)    in 217 sec: 0.231265 ( -0.009266  0.009308 ) ph/cm2/s
Energy fluence (15-150 keV)             : 3.55574e-06 ( -1.43656e-07  1.44158e-07 ) ergs/cm2
Cutoff power-law model
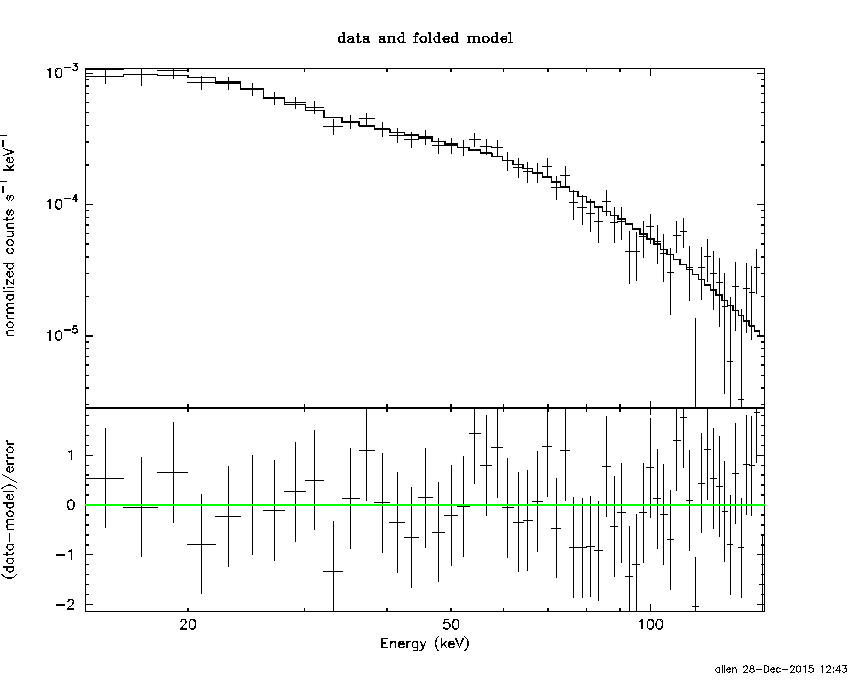
Time interval is from   29.976 sec. to  246.944 sec.
Spectral model in the cutoff power-law:
------------------------------------------------------------
Parameters  : value       lower 90%   higher 90%
Photon index: -1.52827     ( -0.226226   0.294826 )
Epeak [keV] : 179.265      ( -89.9149 -179.266 )
Norm@50keV  : 2.05194E-03    ( -0.000343077   0.000786408 )
------------------------------------------------------------
#Fit statistic : Chi-Squared =          41.06 using 59 PHA bins.
# Reduced chi-squared =         0.7333 for     56 degrees of freedom
# Null hypothesis probability =   9.327338e-01

Photon flux (15-150 keV)    in 217 sec: 0.229034 ( -0.010292  0.010318 ) ph/cm2/s
Energy fluence (15-150 keV)             : 3.51536e-06 ( -1.66321e-07  1.64744e-07 ) ergs/cm2
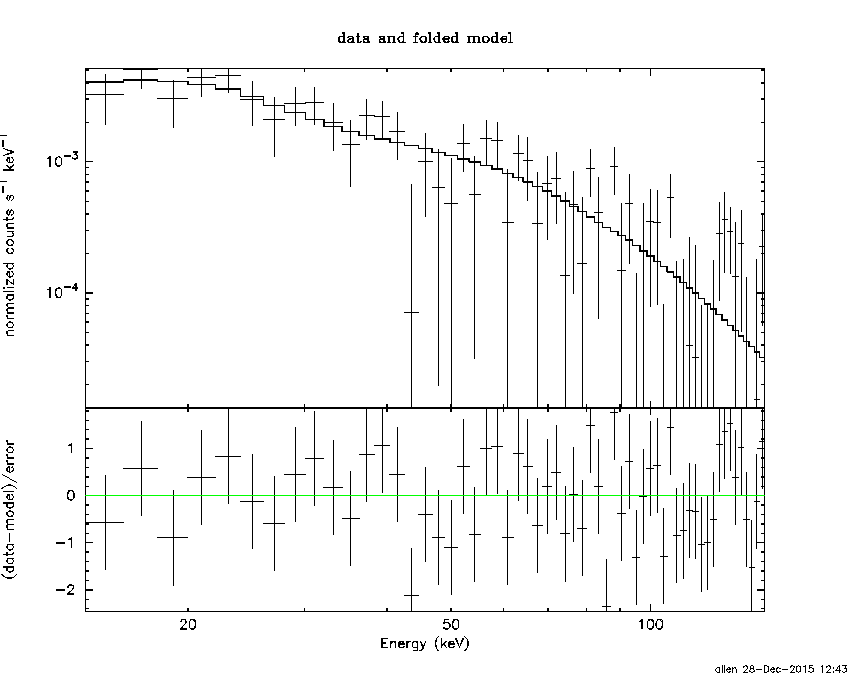
1-s peak spectrum fit
Power-law model

Time interval is from   90.160 sec. to   91.160 sec.

Spectral model in power-law:
------------------------------------------------------------
Parameters  : value       lower 90%   higher 90%
Photon index: -1.74258     ( -0.241428   0.23061 )
Norm@50keV  : 6.83390E-03    ( -0.00105164   0.00102479 )
------------------------------------------------------------
#Fit statistic : Chi-Squared =          51.74 using 59 PHA bins.
# Reduced chi-squared =         0.9077 for     57 degrees of freedom
# Null hypothesis probability =   6.720645e-01

Photon flux (15-150 keV)    in 1 sec: 0.921586 ( -0.121019  0.121034 ) ph/cm2/s
Energy fluence (15-150 keV)             : 6.30957e-08 ( -9.93386e-09  1.01361e-08 ) ergs/cm2
Cutoff power-law model
Time interval is from   90.160 sec. to   91.160 sec.
Spectral model in the cutoff power-law:
------------------------------------------------------------
Parameters  : value       lower 90%   higher 90%
Photon index: -1.57456     ( -0.587395   0.997563 )
Epeak [keV] : 112.065      ( -68.9445 -112.345 )
Norm@50keV  : 8.49649E-03    (     )
------------------------------------------------------------
#Fit statistic : Chi-Squared =          51.63 using 59 PHA bins.
# Reduced chi-squared =         0.9220 for     56 degrees of freedom
# Null hypothesis probability =   6.408367e-01

Photon flux (15-150 keV)    in 1 sec: 0.916672 ( -0.123802  0.122798 ) ph/cm2/s
Energy fluence (15-150 keV)             : 6.20283e-08 ( -1.13035e-08  1.09376e-08 ) ergs/cm2
Time-resolved spectra

Distribution
T90 vs. Hardness ratio plot
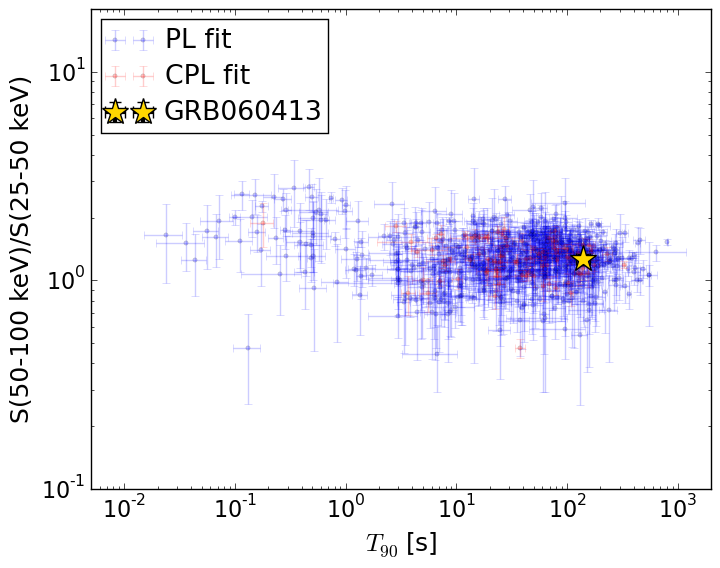
T90                                   = 141.124 sec.
Hardness ratio (energy fluence ratio) = 1.26363016139
S(15-50 keV) vs. S(50-150 keV) plot
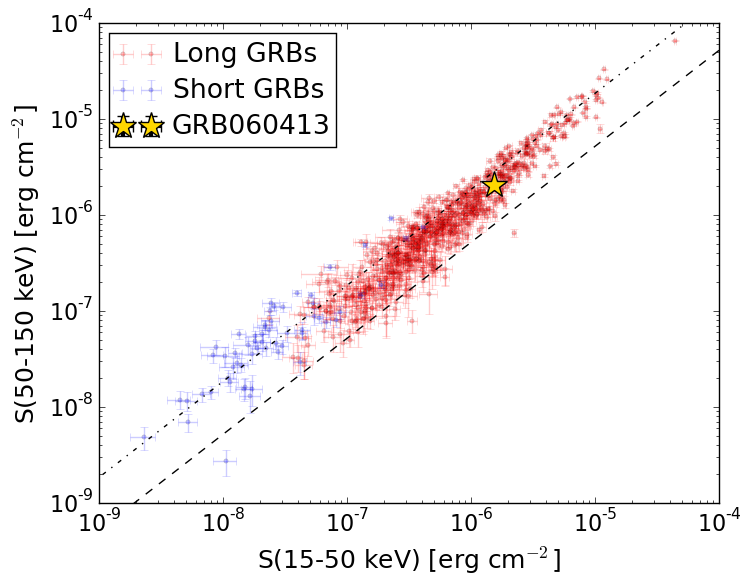
S(15-50 keV)  = 1.5167558e-06
S(50-150 keV) = 2.0389601e-06
The dash-dotted line and the dashed line traces the fluences calculated from the Band function with Epeak = 15 and 150 keV, respectively. Both lines assume a canonical values of alpha = -1 and beta = -2.5.
Mask shadow pattern
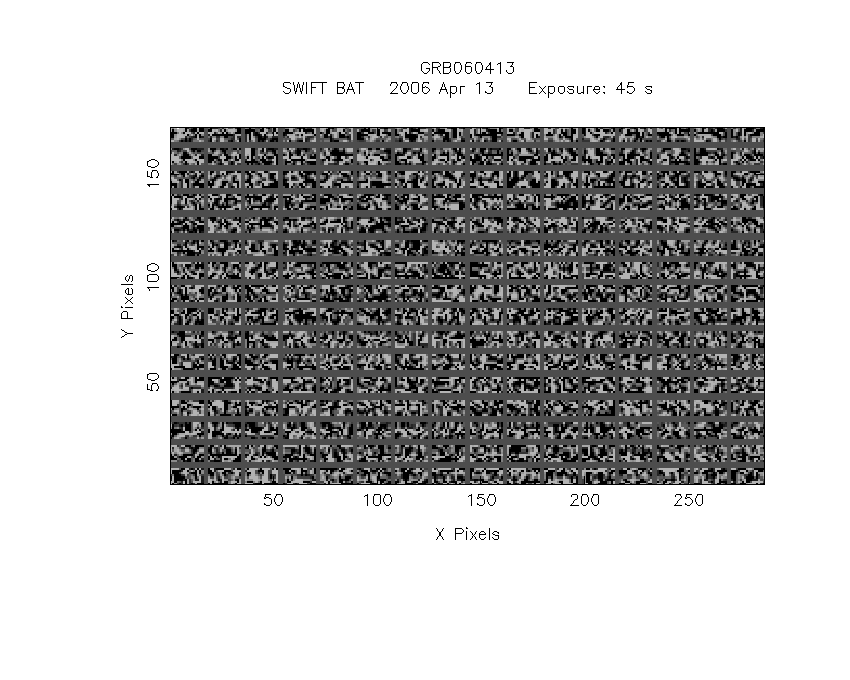
IMX = -7.243973460855259E-02, IMY = 8.252560554271778E-02
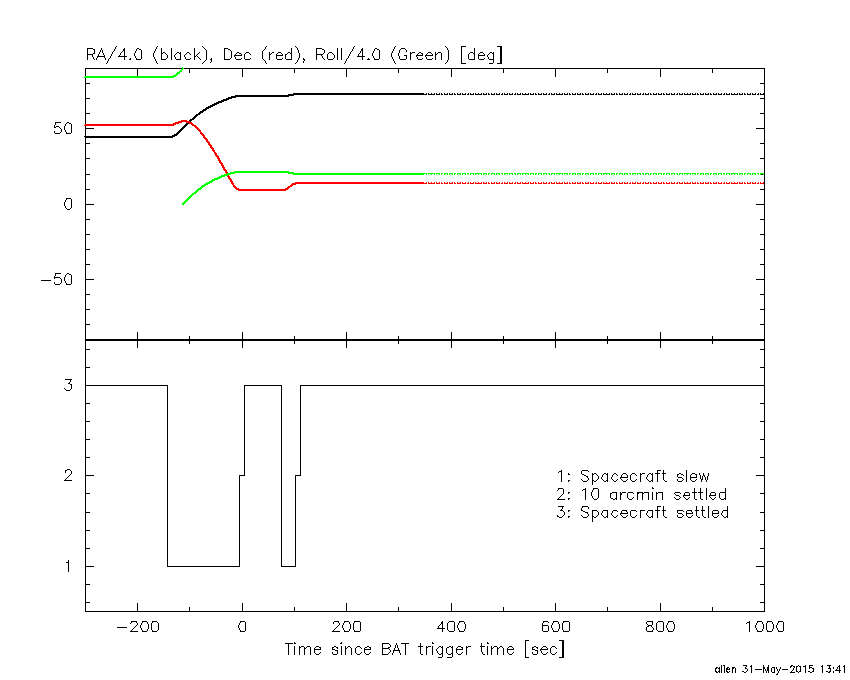
Spacecraft aspect plot
Bright source in the pre-burst/pre-slew/post-slew images
Pre-burst image of 15-350 keV band
Time interval of the image:
-5.699410 29.976000

# RAcent  DECcent POSerr Theta    Phi  PeakCts   SNR AngSep     Name
#  [deg]    [deg]    ['] [deg]  [deg]                   [']
254.6166  35.3589   16.8  39.2  141.1  -0.0818  -0.7    7.8	Her X-1
263.1587 -24.8989    9.8  41.2   38.0   0.1512   1.2   12.3	GX 1+4
268.4731  -1.3029   19.5  21.1   65.3  -0.0384  -0.6   11.0	SW J1753.5-0127
270.2436 -25.2203   11.8  38.1   29.2   0.0973   1.0    8.8	GX 5-1
270.4661 -25.8845    3.9  38.6   28.4   0.2953   3.0   12.3	GRS 1758-258
274.0381 -14.0242    3.0  26.5   33.1   0.2745   3.9    2.0	GX 17+2
275.9255 -30.3674  191.9  41.0   18.8   0.0059   0.1    0.0	H1820-303
285.0662 -25.0056    5.4  34.3    7.3   0.1544   2.2    5.4	HT1900.1-2455
288.8299  10.9328    0.9   2.6 -125.1   0.6999  12.4    2.0	GRS 1915+105
299.5919  35.1797    0.6  28.4 -153.2   1.1811  20.3    1.3	Cyg X-1
308.2558  40.9753   36.9  36.9 -148.2   0.0244   0.3    6.7	Cyg X-3
326.1127  38.3964    9.5  45.7 -131.6  -0.2133  -1.2    5.3	Cyg X-2
263.0997 -33.7744   13.4  48.6   30.9  -0.1828  -0.9    6.6	GX 354-0
283.2776 -46.7947    2.2  56.2    7.4   1.7997   5.3 ------	UNKNOWN
Pre-slew background subtracted image of 15-350 keV band
Time interval of the image:
29.976000 74.900600

# RAcent  DECcent POSerr Theta    Phi  PeakCts   SNR AngSep     Name
#  [deg]    [deg]    ['] [deg]  [deg]                   [']
254.3641  35.4589    8.5  39.5  141.1  -0.2651  -1.3    8.4	Her X-1
263.0803 -24.8042    4.7  41.2   38.1  -0.5157  -2.4    5.2	GX 1+4
268.2020  -1.3229    0.0  21.3   65.6   0.1228   1.1   12.6	SW J1753.5-0127
270.2235 -25.0283    6.6  37.9   29.3   0.2861   1.7    4.5	GX 5-1
270.4656 -25.8811    4.1  38.6   28.4  -0.4698  -2.8   12.1	GRS 1758-258
274.0341 -14.0210    4.0  26.5   33.2  -0.3168  -2.9    1.9	GX 17+2
275.7774 -30.3037    4.2  41.0   19.0   0.4380   2.7    8.5	H1820-303
284.9768 -25.0731    8.3  34.4    7.4  -0.1689  -1.4    9.7	HT1900.1-2455
288.8861  10.9629    5.4   2.7 -124.8  -0.1957  -2.1    5.3	GRS 1915+105
299.6414  35.2671   33.6  28.5 -153.2  -0.0335  -0.3    4.7	Cyg X-1
308.2786  41.0739    0.0  37.0 -148.2  -0.2261  -1.8   10.5	Cyg X-3
326.3106  38.2843    9.2  45.8 -131.3   0.3563   1.3    6.9	Cyg X-2
263.0413 -33.7939    7.0  48.6   31.0   0.5763   1.7    3.6	GX 354-0
270.1920  65.2799    2.5  57.2  176.3   2.4234   4.7 ------	UNKNOWN
291.2929  13.7469    0.9   6.3 -131.3   1.0523  12.2 ------	UNKNOWN
296.6817  25.8005    2.6  19.0 -147.2   0.3796   4.5 ------	UNKNOWN
Post-slew image of 15-350 keV band
Time interval of the image:
101.500600 963.049800

# RAcent  DECcent POSerr Theta    Phi  PeakCts   SNR AngSep     Name
#  [deg]    [deg]    ['] [deg]  [deg]                   [']
254.5488  35.2283   12.3  39.4  138.7  -1.0830  -0.9    8.2	Her X-1
263.0012 -24.8230    4.9  47.5   44.8   4.4087   2.3    4.7	GX 1+4
268.4379  -1.5204    4.1  27.4   66.8   1.8588   2.8    5.8	SW J1753.5-0127
270.1972 -25.0789    5.5  44.0   37.1   2.3177   2.1    4.7	GX 5-1
270.3632 -25.7914    3.8  44.5   36.4   3.5798   3.1    4.4	GRS 1758-258
273.9858 -13.9812    1.3  32.6   41.5   5.2570   8.8    3.5	GX 17+2
275.9878 -30.3676    3.2  46.6   27.4   4.3835   3.6    3.3	H1820-303
285.1884 -25.0199    3.6  39.3   17.9   2.2671   3.2   10.2	HT1900.1-2455
288.7964  10.9484    0.4   3.8   50.0  13.6233  29.3    0.2	GRS 1915+105
299.5981  35.1966    0.2  22.7 -153.1  26.1477  50.1    0.5	Cyg X-1
308.2158  40.9618   12.2  30.9 -145.6   0.5126   0.9    4.8	Cyg X-3
326.1676  38.3144    6.3  39.4 -125.9   1.7317   1.8    0.5	Cyg X-2
282.3914  26.4431    2.4  15.1  157.1   1.9145   4.8 ------	UNKNOWN
291.2877  13.7781    1.4   0.0   37.6   4.0435   8.0 ------	UNKNOWN
314.8942 -22.6095    3.2  43.1  -23.6   2.7975   3.6 ------	UNKNOWN
304.6803  72.3542    4.1  59.1 -166.2  10.0977   2.9 ------	UNKNOWN
332.6325  -1.2128    3.7  43.6  -64.1   8.8099   3.2 ------	UNKNOWN