Analysis Summary
Notes:
- 1) No attempt has been made to eliminate the non-significant decimal places.
- 2) This batgrbproduct analysis is done using the HEASARC data.
- 3) This batgrbproduct analysis is using the flight position for the mask-weighting calculation.
======================================================================
                  BAT GRB EVENT DATA PROCESSING REPORT
    Process Script Ver: batgrbproduct v2.46
    Process Start Time: Wed Jan 22 17:29:14 EST 2014
             Host Name: batevent1
   Current Working Dir: /local/data/batevent/batevent_reproc/trigger205851
======================================================================

  Trigger: 00205851      Segment: 000

  BAT Trigger Time: 167022369.344   [s; MET]
      Trigger Stop: 167022370.368   [s; MET]
               UTC: 2006-04-18T03:06:08.204500    [includes UTCF correction]
       Where From?: TDRSS position message

  BAT
    RA: 236.419948391906   Dec: -3.64343384352562  [deg; J2000]

     Catalogged Source?: NO
     Point Source?:      YES
     GRB Indicated?:     YES    [ by BAT flight software ]
     Image S/N Ratio:    10.8
     Image Trigger?:     NO
     Rate S/N Ratio:     28.9309522829789  [ if not an image trigger ]
     Image S/N Ratio:    10.8

  Analysis Position:   [ source = BAT ]
    RA: 236.419948391906   Dec: -3.64343384352562  [deg; J2000]

  Refined Position:   [ source = BAT pre-slew burst ]
    RA: 236.430661828296   Dec: -3.63965249246618  [deg; J2000]
        { 15h 45m 43.4s , -03d 38' 22.7" }
         +/- 0.969578605224568 [arcmin] (estimated 90% radius based on SNR)
         +/- 0.500532965683523 [arcmin] (formal 1-sigma fit error)
    SNR: 31.7896311502763

  Angular difference between the analysis and refined position is 0.680447 arcmin

  Partial Coding Fraction: 0.3046875    [ including projection effects ]

  Duration
     T90: 109.080000013113 +/- 46.7255162820641
        Measured from: -45.6200000047684
                   to: 63.4600000083447     [s; relative to TRIGTIME]
     T50: 25.4920000135899 +/- 0.68913860008981
        Measured from: 2.0799999833107
                   to: 27.5719999969006     [s; relative to TRIGTIME]


  Fluence
     Peak Flux  (peak 1 second)
        Measured from: 27.4519999921322
                   to: 28.4519999921322     [s; relative to TRIGTIME]
     Total Fluence
        Measured from: -82.4560000002384
                   to: 136.619999974966     [s; relative to TRIGTIME]

             Band 1     Band 2     Band 3     Band 4
              15-25      25-50     50-100    100-350     keV
 Total     4.234725   5.224577   3.668461   0.930035
           0.127418   0.117749   0.102110   0.090026 [error]
 Peak      0.215832   0.289826   0.235451   0.053250
           0.012172   0.012617   0.011528   0.008156 [error]

     [ fluence units of on-axis counts / fully illuminated detector ]

======================================================================


====== Table of the duration information =============================

        Value   tstart    tstop
T100  219.076  -82.456  136.620
T90   109.080  -45.620   63.460
T50    25.492    2.080   27.572
Peak    1.000   27.452   28.452


====== Spectral Analysis Summary =====================================

Model      : spectral model: simple power-law (PL) and cutoff power-law (CPL)
Ph_index   : photon index: E^{Ph_index}
Ph_90err   : 90% error of the photon index
Epeak      : Epeak in keV
Epeak_90err: 90% error of Epeak
Norm       : normalization at 50 keV in both the PL model and CPL model
Nomr_90err : 90% error of the normalization
chi2       : Chi-Squared
dof        : degree of freedo

=== Time-averaged spectral analysis ===
(Best model with acceptable fit: PL)

Model Ph_index Ph_90err_low Ph_90err_hi  Epeak  Epeak_90err_low  Epeak_90err_hi  Norm       Nomr_90err_low    Norm_90err_hi    chi2    dof
PL      -1.681    -0.057      0.056       -           -               -         4.13e-03     -1.20e-04          1.19e-04      59.350   57
CPL     -1.553    -0.163      0.226      182.814    -112.680      -182.814      4.76e-03     -7.08e-04          1.29e-03      58.330   56


=== 1-s peak spectral analysis ===
(Best model with acceptable fit: PL)

Model Ph_index Ph_90err_low Ph_90err_hi  Epeak  Epeak_90err_low  Epeak_90err_hi  Norm       Nomr_90err_low    Norm_90err_hi    chi2    dof
PL      -1.498     -0.089     0.089       -           -               -         5.26e-02     -2.60e-03          2.59e-03      54.680   57
CPL     -1.313     -0.231     0.360      194.981      N/A           N/A         6.46e-02        N/A               N/A         53.800   56


=== Fluence/Peak Flux Summary ===

              Model    Band1     Band2     Band3     Band4     Band5     Total
                       15-25     25-50    50-100    100-350    15-150    15-350    keV
Fluence         PL   1.37e-06  2.26e-06  2.81e-06  6.97e-06  8.40e-06  1.34e-05   erg/cm2
      90%_error_low -7.63e-08 -7.20e-08 -1.07e-07 -5.83e-07 -2.52e-07 -6.47e-07   erg/cm2
      90%_error_hi   7.81e-08  7.18e-08  1.06e-07  6.20e-07  2.53e-07  6.75e-07   erg/cm2
Peak flux       PL   2.16e+00  2.18e+00  1.54e+00  1.73e+00  6.56e+00  7.61e+00   ph/cm2/s
      90%_error_low -1.92e-01 -1.18e-01 -9.50e-02 -2.16e-01 -3.33e-01 -3.73e-01   ph/cm2/s
      90%_error_hi   1.99e-01  1.17e-01  9.45e-02  2.34e-01  3.34e-01  3.73e-01   ph/cm2/s

Fluence        CPL   1.33e-06  2.27e-06  2.84e-06  5.79e-06  8.31e-06  1.22e-05   erg/cm2
      90%_error_low -9.56e-08 -7.82e-08 -1.13e-07 -1.51e-06 -2.93e-07 -1.54e-06   erg/cm2
      90%_error_hi   9.96e-08  7.88e-08  1.14e-07  1.16e-06  2.91e-07  1.43e-06   erg/cm2
Peak flux      CPL   2.02e+00  1.56e+00  8.43e-01  7.84e-01  4.75e+00  5.21e+00   ph/cm2/s
      90%_error_low -1.45e-01 -1.89e-01 -8.24e-02 -9.33e-02 -5.59e-01 -5.56e-01   ph/cm2/s
      90%_error_hi   2.44e-01  1.69e-01  6.87e-02  8.57e-02  4.91e-01  4.69e-01   ph/cm2/s

======================================================================
Image
Pre-slew 15.0-350.0 keV image (Event data)
#   RAcent    DECcent   POSerr    Theta     Phi              Peak Cts       SNR   Name
  236.4307    -3.6397   0.0060    31.2072    94.9614         7.9157465     31.790 TRIG_00205851

Foreground time interval of the image:
-82.456  11.957 (delta_t =  94.413 [sec])
Background time interval of the image:
-239.344 -82.456 (delta_t = 156.888 [sec])
Light Curves
Note: The mask-weighted lightcurves have units of either count/det or counts/sec/det, where a det is 0.4 x 0.4 = 0.16 sq cm.
Full-time range; 1 s binning
Other quick-look light curves:
- 64 ms binning (zoomed)
- 16 ms binning (zoomed)
- 8 ms binning (zoomed)
- 2 ms binning (zoomed)
- SN=5 or 10 s binning (full-time range)
- Raw light curve
Spectra
- 64 ms binning (zoomed)
- 16 ms binning (zoomed)
- 8 ms binning (zoomed)
- 2 ms binning (zoomed)
- SN=5 or 10 s binning (full-time range)
- Raw light curve
Spectra
Notes:
- 1) The fitting includes the systematic errors.
- 2) When the burst includes telescope slew time periods, the fitting uses an average response file made from multiple 5-s response files through out the slew time plus single time preiod for the non-slew times, and weighted by the total counts in the corresponding time period using addrmf. An average response file is needed becuase a spectral fit using the pre-slew DRM will introduce some errors in both a spectral shape and a normalization if the PHA file contains a lot of the slew/post-slew time interval.
- 3) For fits to more complicated models (e.g. a power-law over a cutoff power-law), the BAT team has decided to require a chi-square improvement of more than 6 for each extra dof.
Time averaged spectrum fit using the average DRM
Power-law model
Time interval is from  -82.456 sec. to  136.620 sec.

Spectral model in power-law:
------------------------------------------------------------
Parameters  : value       lower 90%   higher 90%
Photon index: -1.681     ( -0.0565556   0.0563754 )
Norm@50keV  : 4.13366E-03    ( -0.000119507   0.00011936 )
------------------------------------------------------------
#Fit statistic : Chi-Squared =          59.35 using 59 PHA bins.
# Reduced chi-squared =          1.041 for     57 degrees of freedom
# Null hypothesis probability =   3.898786e-01

Photon flux (15-150 keV)    in 219.1 sec: 0.545424 ( -0.017459  0.017533 ) ph/cm2/s
Energy fluence (15-150 keV)             : 8.40005e-06 ( -2.52215e-07  2.52662e-07 ) ergs/cm2
Cutoff power-law model
Time interval is from  -82.456 sec. to  136.620 sec.
Spectral model in the cutoff power-law:
------------------------------------------------------------
Parameters  : value       lower 90%   higher 90%
Photon index: -1.55263     ( -0.162721   0.225666 )
Epeak [keV] : 182.814      ( -112.693 -182.827 )
Norm@50keV  : 4.75659E-03    ( -0.000708026   0.00129188 )
------------------------------------------------------------
#Fit statistic : Chi-Squared =          58.33 using 59 PHA bins.
# Reduced chi-squared =          1.042 for     56 degrees of freedom
# Null hypothesis probability =   3.897251e-01

Photon flux (15-150 keV)    in 219.1 sec: 0.539628 ( -0.01981  0.0199 ) ph/cm2/s
Energy fluence (15-150 keV)             : 8.31136e-06 ( -2.92691e-07  2.91094e-07 ) ergs/cm2
1-s peak spectrum fit
Power-law model

Time interval is from   27.452 sec. to   28.452 sec.

Spectral model in power-law:
------------------------------------------------------------
Parameters  : value       lower 90%   higher 90%
Photon index: -1.49841     ( -0.0891434   0.0885831 )
Norm@50keV  : 5.25714E-02    ( -0.00259986   0.00259292 )
------------------------------------------------------------
#Fit statistic : Chi-Squared =          54.68 using 59 PHA bins.
# Reduced chi-squared =         0.9593 for     57 degrees of freedom
# Null hypothesis probability =   5.625071e-01

Photon flux (15-150 keV)    in 1 sec: 6.56033 ( -0.33336  0.33398 ) ph/cm2/s
Energy fluence (15-150 keV)             : 4.98907e-07 ( -2.68005e-08  2.69407e-08 ) ergs/cm2
Cutoff power-law model
Time interval is from   27.452 sec. to   28.452 sec.
Spectral model in the cutoff power-law:
------------------------------------------------------------
Parameters  : value       lower 90%   higher 90%
Photon index: -1.31252     ( -0.231008   0.360114 )
Epeak [keV] : 194.981      (   )
Norm@50keV  : 6.46113E-02    (     )
------------------------------------------------------------
#Fit statistic : Chi-Squared =          53.80 using 59 PHA bins.
# Reduced chi-squared =         0.9608 for     56 degrees of freedom
# Null hypothesis probability =   5.584751e-01

Photon flux (15-150 keV)    in 1 sec: 4.74686 ( -0.55904  0.49126 ) ph/cm2/s
Energy fluence (15-150 keV)             : 4.92799e-07 ( -2.92347e-08  2.90562e-08 ) ergs/cm2
Time-resolved spectra
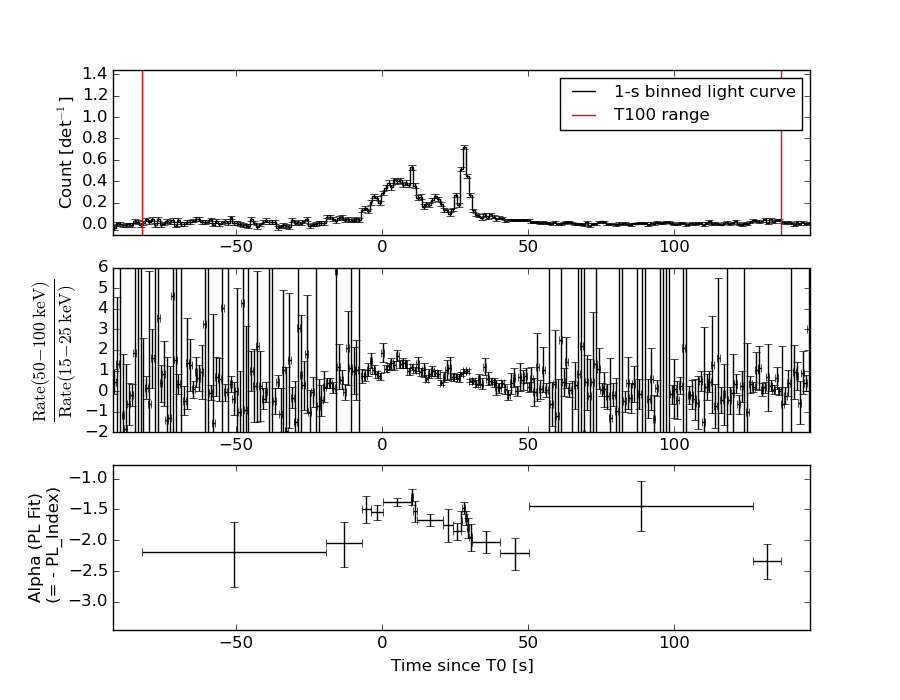
Distribution
T90 vs. Hardness ratio plot
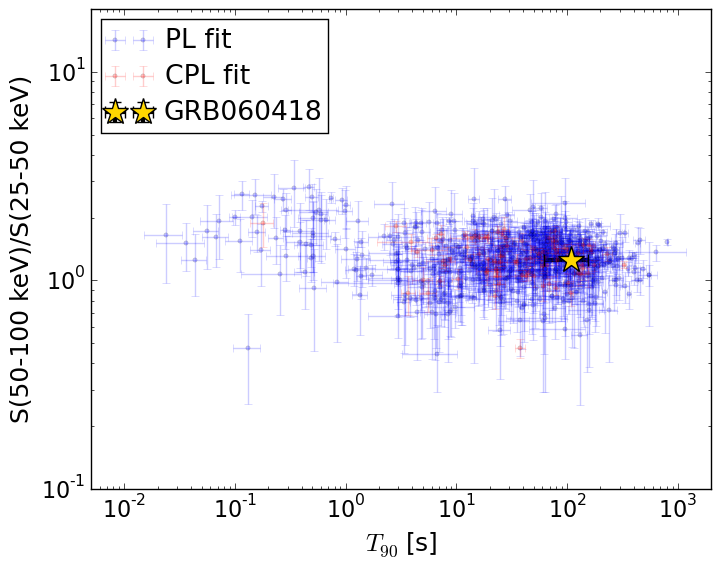
T90                                   = 109.08 sec.
Hardness ratio (energy fluence ratio) = 1.24749852059
S(15-50 keV) vs. S(50-150 keV) plot
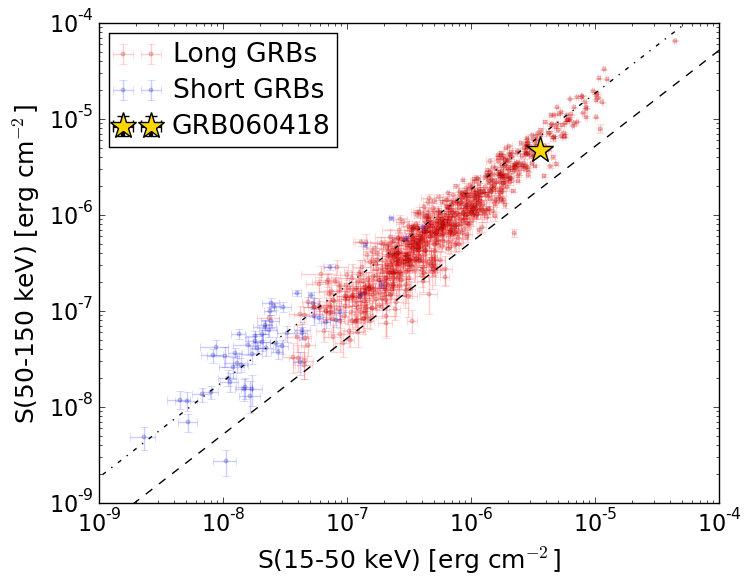
S(15-50 keV)  = 3.626854e-06
S(50-150 keV) = 4.773168e-06
The dash-dotted line and the dashed line traces the fluences calculated from the Band function with Epeak = 15 and 150 keV, respectively. Both lines assume a canonical values of alpha = -1 and beta = -2.5.
Mask shadow pattern
IMX = -5.239178584497276E-02, IMY = -6.035240817613787E-01
Spacecraft aspect plot
Bright source in the pre-burst/pre-slew/post-slew images
Pre-burst image of 15-350 keV band
Time interval of the image:
-239.344000 -82.456000

# RAcent  DECcent POSerr Theta    Phi  PeakCts   SNR AngSep     Name
#  [deg]    [deg]    ['] [deg]  [deg]                   [']
244.9781 -15.6278    0.3  23.9   67.1   6.8594  35.8    0.8	Sco X-1
254.3211  35.3424    6.2  43.9  165.2   0.5819   1.9    6.7	Her X-1
255.9455 -37.8894    3.4  32.9   18.0   0.6284   3.4    3.3	4U 1700-377
256.3866 -36.3937    5.3  31.4   18.4   0.3623   2.2    2.9	GX 349+2
262.9669 -24.5953    4.1  18.4   14.4   0.3776   2.8    9.3	GX 1+4
264.7473 -44.5106    9.5  37.9    4.2   0.2643   1.2    3.6	4U 1735-44
268.3036  -1.5047    4.6   5.3 -171.6   0.3654   2.5    5.0	SW J1753.5-0127
270.3350 -25.0962    2.5  18.6   -6.9   0.7062   4.6    2.9	GX 5-1
270.2648 -25.7389    3.3  19.2   -6.4   0.5427   3.6    2.1	GRS 1758-258
273.8524 -14.0349   13.0   9.5  -38.5   0.1252   0.9    8.9	GX 17+2
275.9071 -30.4166    3.0  24.9  -16.3   0.6043   3.8    3.1	H1820-303
285.0994 -24.8645    7.0  24.7  -39.9   0.2632   1.6    4.8	HT1900.1-2455
288.7798  10.9541    1.4  27.5 -129.0   1.3882   8.1    1.2	GRS 1915+105
299.6208  35.1701    1.4  51.6 -145.6   4.0054   8.2    2.4	Cyg X-1
263.0387 -33.8458    3.7  27.5    9.2   0.4696   3.1    2.6	GX 354-0
251.4811  44.0414    2.6  52.8  166.4   2.5274   4.5 ------	UNKNOWN
253.2473 -39.2713    2.4  35.0   20.4   0.9961   4.8 ------	UNKNOWN
289.2056 -24.2070    2.9  27.1  -46.6   0.7304   4.0 ------	UNKNOWN
Pre-slew background subtracted image of 15-350 keV band
Time interval of the image:
-82.456000 11.956590

# RAcent  DECcent POSerr Theta    Phi  PeakCts   SNR AngSep     Name
#  [deg]    [deg]    ['] [deg]  [deg]                   [']
245.1284 -15.7938    0.0  23.8   66.6   0.1845   1.0   12.6	Sco X-1
254.3420  35.4568    8.5  44.0  165.3  -0.3538  -1.4    8.9	Her X-1
255.8224 -37.9600   44.0  33.0   18.1  -0.0445  -0.3   10.4	4U 1700-377
256.5441 -36.4667   83.6  31.4   18.1   0.0217   0.1    5.9	GX 349+2
263.1481 -24.7875    4.0  18.6   13.7  -0.3561  -2.9    8.0	GX 1+4
264.9118 -44.6026    0.0  38.0    4.0  -0.1689  -0.9   11.7	4U 1735-44
268.5148  -1.3003    0.0   5.5 -169.7   0.0381   0.3   12.7	SW J1753.5-0127
270.1294 -25.1772    6.0  18.6   -6.2  -0.2528  -1.9   10.3	GX 5-1
270.4561 -25.5882    0.0  19.1   -7.0   0.1534   1.2   12.5	GRS 1758-258
274.0191 -13.8866    3.0   9.5  -39.9   0.4754   3.9    9.0	GX 17+2
275.7941 -30.4320    9.4  24.9  -16.0   0.1580   1.2    7.8	H1820-303
284.9257 -24.9459    4.6  24.6  -39.4   0.3365   2.5    6.2	HT1900.1-2455
288.6570  10.8600    5.9  27.3 -129.0  -0.2746  -2.0    9.8	GRS 1915+105
299.6120  35.0867    8.4  51.5 -145.5  -0.5809  -1.4    7.0	Cyg X-1
263.0509 -33.9860    5.3  27.6    9.1  -0.3070  -2.2    9.6	GX 354-0
236.4307  -3.6397    0.4  31.2   95.0   7.9173  31.8 ------	UNKNOWN
271.0559 -42.6712    2.9  36.1   -3.4   0.6795   4.0 ------	UNKNOWN
309.6710 -18.6791    1.7  42.6  -68.7   2.9783   6.6 ------	UNKNOWN
Post-slew image of 15-350 keV band
Time interval of the image:
66.956610 962.700700

# RAcent  DECcent POSerr Theta    Phi  PeakCts   SNR AngSep     Name
#  [deg]    [deg]    ['] [deg]  [deg]                   [']
244.9814 -15.6313    0.1  14.6  -19.5  41.8577  81.9    0.5	Sco X-1
254.4296  35.4641   24.5  42.6 -143.3   0.4481   0.5    7.4	Her X-1
256.0316 -37.8175    2.1  38.6  -10.2   3.8914   5.6    2.7	4U 1700-377
256.4971 -36.3853    1.9  37.6  -12.0   4.0038   6.0    3.7	GX 349+2
263.0814 -24.6629    5.2  33.2  -33.2   1.3638   2.2    6.3	GX 1+4
264.8293 -44.3251    7.7  47.7  -12.4   1.6075   1.5    8.4	4U 1735-44
268.3106  -1.4618    9.7  31.9  -78.2   1.1075   1.2    3.5	SW J1753.5-0127
270.2353 -25.0214    2.6  38.9  -38.5   3.7457   4.5    4.4	GX 5-1
270.3915 -25.6288    3.1  39.3  -37.7   3.0498   3.7    8.4	GRS 1758-258
273.8968 -13.9921    3.8  38.4  -57.0   3.0965   3.0    6.9	GX 17+2
275.9481 -30.3265    5.5  45.8  -35.0   2.1694   2.1    2.7	H1820-303
263.1204 -33.7780    8.7  39.1  -21.4   1.0387   1.3    7.4	GX 354-0
236.4629  -3.6669    2.3   0.0  -23.4   2.5251   4.9 ------	UNKNOWN
242.4398 -12.6261    3.2  10.8  -18.1   1.7041   3.6 ------	UNKNOWN
265.4115   4.4208    3.3  30.0  -90.4   2.9733   3.5 ------	UNKNOWN