Analysis Summary
Notes:
- 1) No attempt has been made to eliminate the non-significant decimal places.
- 2) This batgrbproduct analysis is done using the HEASARC data.
- 3) This batgrbproduct analysis is using the flight position for the mask-weighting calculation.
======================================================================
BAT GRB EVENT DATA PROCESSING REPORT
Process Script Ver: batgrbproduct v2.46
Process Start Time: Wed Jan 22 17:18:22 EST 2014
Host Name: batevent1
Current Working Dir: /local/data/batevent/batevent_reproc/trigger206773
======================================================================
Trigger: 00206773 Segment: 000
BAT Trigger Time: 167544980.672 [s; MET]
Trigger Stop: 167544981.696 [s; MET]
UTC: 2006-04-24T04:16:19.520420 [includes UTCF correction]
Where From?: TDRSS position message
BAT
RA: 7.35525645990139 Dec: 36.8198378270448 [deg; J2000]
Catalogged Source?: NO
Point Source?: YES
GRB Indicated?: YES [ by BAT flight software ]
Image S/N Ratio: 10.1
Image Trigger?: NO
Rate S/N Ratio: 21.2132034355964 [ if not an image trigger ]
Image S/N Ratio: 10.1
Analysis Position: [ source = BAT ]
RA: 7.35525645990139 Dec: 36.8198378270448 [deg; J2000]
Refined Position: [ source = BAT pre-slew burst ]
RA: 7.35897766896579 Dec: 36.7845636298646 [deg; J2000]
{ 00h 29m 26.2s , +36d 47' 04.4" }
+/- 1.70236221959549 [arcmin] (estimated 90% radius based on SNR)
+/- 0.813305717588225 [arcmin] (formal 1-sigma fit error)
SNR: 14.2247333353899
Angular difference between the analysis and refined position is 2.123989 arcmin
Partial Coding Fraction: 0.53125 [ including projection effects ]
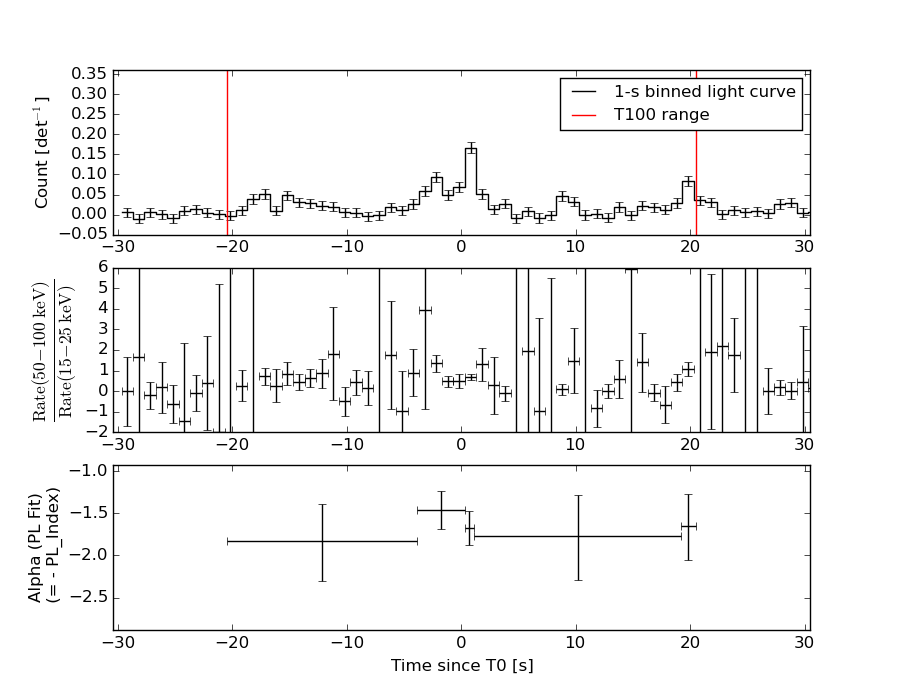
Duration
T90: 37.6800000071526 +/- 3.47315419041859
Measured from: -17.8439999818802
to: 19.8360000252724 [s; relative to TRIGTIME]
T50: 11.5440000295639 +/- 8.376860001479
Measured from: -8.36800000071526
to: 3.17600002884865 [s; relative to TRIGTIME]
Fluence
Peak Flux (peak 1 second)
Measured from: 0.108000010251999
to: 1.108000010252 [s; relative to TRIGTIME]
Total Fluence
Measured from: -20.4599999785423
to: 20.4760000109673 [s; relative to TRIGTIME]
Band 1 Band 2 Band 3 Band 4
15-25 25-50 50-100 100-350 keV
Total 0.371056 0.428516 0.278942 0.041417
0.039724 0.041268 0.035770 0.030336 [error]
Peak 0.060524 0.075356 0.046287 0.006741
0.007139 0.007780 0.006821 0.004791 [error]
[ fluence units of on-axis counts / fully illuminated detector ]
======================================================================
====== Table of the duration information =============================
Value tstart tstop
T100 40.936 -20.460 20.476
T90 37.680 -17.844 19.836
T50 11.544 -8.368 3.176
Peak 1.000 0.108 1.108
====== Spectral Analysis Summary =====================================
Model : spectral model: simple power-law (PL) and cutoff power-law (CPL)
Ph_index : photon index: E^{Ph_index}
Ph_90err : 90% error of the photon index
Epeak : Epeak in keV
Epeak_90err: 90% error of Epeak
Norm : normalization at 50 keV in both the PL model and CPL model
Nomr_90err : 90% error of the normalization
chi2 : Chi-Squared
dof : degree of freedo
=== Time-averaged spectral analysis ===
(Best model with acceptable fit: PL)
Model Ph_index Ph_90err_low Ph_90err_hi Epeak Epeak_90err_low Epeak_90err_hi Norm Nomr_90err_low Norm_90err_hi chi2 dof
PL -1.698 -0.185 0.180 - - - 1.81e-03 -2.08e-04 2.05e-04 61.720 57
CPL -1.190 -0.625 0.819 73.363 -23.300 -73.363 3.41e-03 -1.72e-03 5.89e-03 60.200 56
=== 1-s peak spectral analysis ===
(Best model with acceptable fit: PL)
Model Ph_index Ph_90err_low Ph_90err_hi Epeak Epeak_90err_low Epeak_90err_hi Norm Nomr_90err_low Norm_90err_hi chi2 dof
PL -1.694 -0.201 0.193 - - - 1.23e-02 -1.57e-03 1.55e-03 50.360 57
CPL -0.897 -0.863 1.104 63.629 -16.221 -63.629 3.33e-02 -3.33e-02 9.74e-02 48.050 56
=== Fluence/Peak Flux Summary ===
Model Band1 Band2 Band3 Band4 Band5 Total
15-25 25-50 50-100 100-350 15-150 15-350 keV
Fluence PL 1.14e-07 1.85e-07 2.29e-07 5.57e-07 6.86e-07 1.09e-06 erg/cm2
90%_error_low -1.79e-08 -1.93e-08 -3.50e-08 -1.57e-07 -8.23e-08 -1.93e-07 erg/cm2
90%_error_hi 1.85e-08 1.93e-08 3.51e-08 1.93e-07 8.34e-08 2.22e-07 erg/cm2
Peak flux PL 6.11e-01 5.48e-01 3.39e-01 3.19e-01 1.63e+00 1.82e+00 ph/cm2/s
90%_error_low -1.05e-01 -6.36e-02 -5.55e-02 -9.17e-02 -1.88e-01 -2.11e-01 ph/cm2/s
90%_error_hi 1.10e-01 6.34e-02 5.53e-02 1.11e-01 1.88e-01 2.12e-01 ph/cm2/s
Fluence CPL 1.07e-07 1.97e-07 2.31e-07 2.51e-07 6.56e-07 7.87e-07 erg/cm2
90%_error_low -2.07e-08 -2.49e-08 -3.80e-08 -1.59e-07 -9.07e-08 -1.86e-07 erg/cm2
90%_error_hi 2.07e-08 2.58e-08 3.80e-08 3.62e-07 9.28e-08 3.84e-07 erg/cm2
Peak flux CPL 5.50e-01 5.99e-01 3.51e-01 1.31e-01 1.59e+00 1.63e+00 ph/cm2/s
90%_error_low -1.28e-01 -8.48e-02 -6.26e-02 -8.35e-02 -1.96e-01 -2.19e-01 ph/cm2/s
90%_error_hi 1.29e-01 8.86e-02 6.30e-02 2.21e-01 1.95e-01 2.73e-01 ph/cm2/s
======================================================================
Image
Pre-slew 15.0-350.0 keV image (Event data)

#   RAcent    DECcent   POSerr    Theta     Phi              Peak Cts       SNR   Name
    7.3590    36.7846   0.0136    29.6909   -64.1589         1.1365816     14.225 TRIG_00206773

Foreground time interval of the image:
-20.460  20.476 (delta_t =  40.936 [sec])
Background time interval of the image:
-239.672 -20.460 (delta_t = 219.212 [sec])
Light Curves
Note: The mask-weighted lightcurves have units of either count/det or counts/sec/det, where a det is 0.4 x 0.4 = 0.16 sq cm.
Full-time range; 1 s binning
Other quick-look light curves:
- 64 ms binning (zoomed)
- 16 ms binning (zoomed)
- 8 ms binning (zoomed)
- 2 ms binning (zoomed)
- SN=5 or 10 s binning (full-time range)
- Raw light curve
Spectra
- 64 ms binning (zoomed)
- 16 ms binning (zoomed)
- 8 ms binning (zoomed)
- 2 ms binning (zoomed)
- SN=5 or 10 s binning (full-time range)
- Raw light curve
Spectra
Notes:
- 1) The fitting includes the systematic errors.
- 2) When the burst includes telescope slew time periods, the fitting uses an average response file made from multiple 5-s response files through out the slew time plus single time preiod for the non-slew times, and weighted by the total counts in the corresponding time period using addrmf. An average response file is needed becuase a spectral fit using the pre-slew DRM will introduce some errors in both a spectral shape and a normalization if the PHA file contains a lot of the slew/post-slew time interval.
- 3) For fits to more complicated models (e.g. a power-law over a cutoff power-law), the BAT team has decided to require a chi-square improvement of more than 6 for each extra dof.
Time averaged spectrum fit using the average DRM
Power-law model
Time interval is from  -20.460 sec. to   20.476 sec.

Spectral model in power-law:
------------------------------------------------------------
Parameters  : value       lower 90%   higher 90%
Photon index: -1.69785     ( -0.184898   0.179821 )
Norm@50keV  : 1.80876E-03    ( -0.00020791   0.000204879 )
------------------------------------------------------------
#Fit statistic : Chi-Squared =          61.72 using 59 PHA bins.
# Reduced chi-squared =          1.083 for     57 degrees of freedom
# Null hypothesis probability =   3.113127e-01

Photon flux (15-150 keV)    in 40.94 sec: 0.240053 ( -0.025011  0.025028 ) ph/cm2/s
Energy fluence (15-150 keV)             : 6.85831e-07 ( -8.22607e-08  8.34198e-08 ) ergs/cm2
Cutoff power-law model
Time interval is from  -20.460 sec. to   20.476 sec.
Spectral model in the cutoff power-law:
------------------------------------------------------------
Parameters  : value       lower 90%   higher 90%
Photon index: -1.19049     ( -0.624674   0.818533 )
Epeak [keV] : 73.3627      ( -23.2996 -73.3628 )
Norm@50keV  : 3.40635E-03    ( -0.00172359   0.00589051 )
------------------------------------------------------------
#Fit statistic : Chi-Squared =          60.20 using 59 PHA bins.
# Reduced chi-squared =          1.075 for     56 degrees of freedom
# Null hypothesis probability =   3.263862e-01

Photon flux (15-150 keV)    in 40.94 sec: 0.235405 ( -0.025871  0.025837 ) ph/cm2/s
Energy fluence (15-150 keV)             : 6.55658e-07 ( -9.06981e-08  9.27659e-08 ) ergs/cm2
1-s peak spectrum fit
Power-law model

Time interval is from    0.108 sec. to    1.108 sec.

Spectral model in power-law:
------------------------------------------------------------
Parameters  : value       lower 90%   higher 90%
Photon index: -1.69424     ( -0.201324   0.193459 )
Norm@50keV  : 1.23190E-02    ( -0.00157485   0.00154891 )
------------------------------------------------------------
#Fit statistic : Chi-Squared =          50.36 using 59 PHA bins.
# Reduced chi-squared =         0.8836 for     57 degrees of freedom
# Null hypothesis probability =   7.204935e-01

Photon flux (15-150 keV)    in 1 sec: 1.63289 ( -0.18783  0.18792 ) ph/cm2/s
Energy fluence (15-150 keV)             : 1.14127e-07 ( -1.52079e-08  1.54178e-08 ) ergs/cm2
Cutoff power-law model

Time interval is from    0.108 sec. to    1.108 sec.
Spectral model in the cutoff power-law:
------------------------------------------------------------
Parameters  : value       lower 90%   higher 90%
Photon index: -0.896995     ( -0.863282   1.10424 )
Epeak [keV] : 63.6293      ( -16.2185 -63.6264 )
Norm@50keV  : 3.32965E-02    ( -0.033302   0.0973985 )
------------------------------------------------------------
#Fit statistic : Chi-Squared =          48.05 using 59 PHA bins.
# Reduced chi-squared =         0.8579 for     56 degrees of freedom
# Null hypothesis probability =   7.662995e-01

Photon flux (15-150 keV)    in 1 sec: 1.58976 ( -0.19567  0.19469 ) ph/cm2/s
Energy fluence (15-150 keV)             : 1.07137e-07 ( -1.67429e-08  1.72915e-08 ) ergs/cm2
Time-resolved spectra
Distribution
T90 vs. Hardness ratio plot
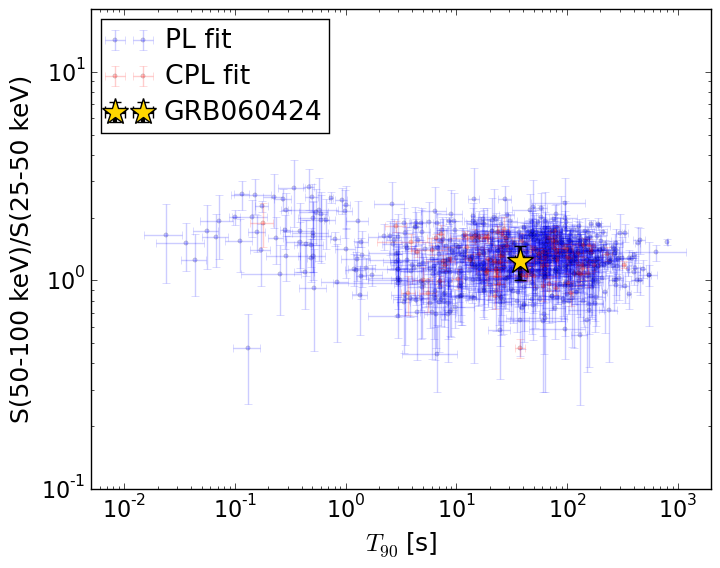
T90                                   = 37.68 sec.
Hardness ratio (energy fluence ratio) = 1.23301998834
S(15-50 keV) vs. S(50-150 keV) plot
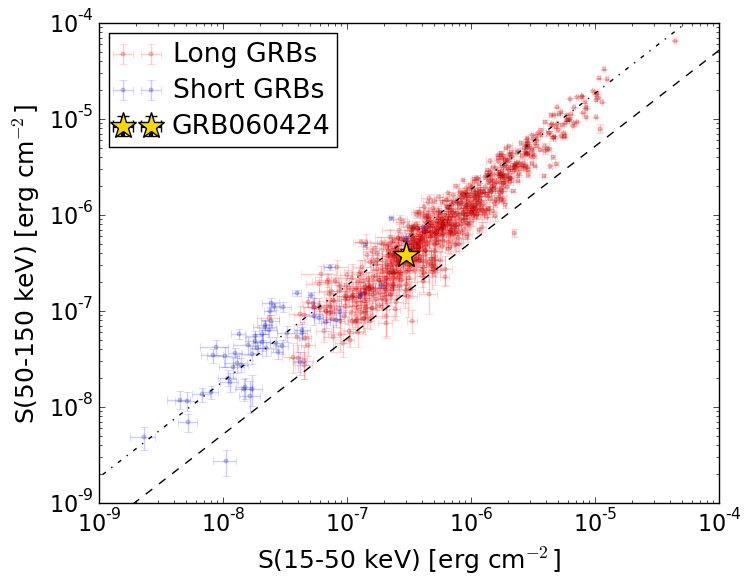
S(15-50 keV)  = 2.993758e-07
S(50-150 keV) = 3.864661e-07
The dash-dotted line and the dashed line traces the fluences calculated from the Band function with Epeak = 15 and 150 keV, respectively. Both lines assume a canonical values of alpha = -1 and beta = -2.5.
Mask shadow pattern
IMX = 2.485279971674947E-01, IMY = 5.131652843505772E-01
Spacecraft aspect plot

Bright source in the pre-burst/pre-slew/post-slew images
Pre-burst image of 15-350 keV band
Time interval of the image:
-239.672000 -20.460000

# RAcent  DECcent POSerr Theta    Phi  PeakCts   SNR AngSep     Name
#  [deg]    [deg]    ['] [deg]  [deg]                   [']
299.5946  35.1959    0.5  38.6   41.9   7.5167  21.5    0.4	Cyg X-1
308.2882  40.9820    4.8  30.1   36.9   0.4838   2.4    8.3	Cyg X-3
326.1650  38.3172   13.3  26.6    8.1   0.1390   0.9    0.4	Cyg X-2
150.2823  61.7235    3.4  55.2  163.9   3.3199   3.4 ------	UNKNOWN
124.6615  62.4064    3.1  51.5  178.1   1.4377   3.7 ------	UNKNOWN
108.7735  50.2292    3.8  59.0 -166.1   3.0043   3.1 ------	UNKNOWN
Pre-slew background subtracted image of 15-350 keV band
Time interval of the image:
-20.460000 20.476000

# RAcent  DECcent POSerr Theta    Phi  PeakCts   SNR AngSep     Name
#  [deg]    [deg]    ['] [deg]  [deg]                   [']
299.7933  35.1189   23.7  38.6   41.7  -0.0624  -0.5   11.1	Cyg X-1
307.9702  41.0933    7.2  30.2   37.5   0.1401   1.6   10.6	Cyg X-3
326.1694  38.3220 1387.5  26.6    8.1  -0.0005  -0.0    0.1	Cyg X-2
313.2330  21.8908    2.7  45.7   17.4   0.5927   4.2 ------	UNKNOWN
331.1842  30.4464    2.0  33.2   -3.8   0.4242   5.6 ------	UNKNOWN
 94.6240  56.4156    2.6  49.5 -160.9   0.5568   4.4 ------	UNKNOWN
 23.0610  50.0361    2.7  24.6 -101.3   0.3223   4.2 ------	UNKNOWN
  7.3590  36.7846    0.8  29.7  -64.2   1.1362  14.2 ------	UNKNOWN
Post-slew image of 15-350 keV band
Time interval of the image:
341.928600 962.408000

# RAcent  DECcent POSerr Theta    Phi  PeakCts   SNR AngSep     Name
#  [deg]    [deg]    ['] [deg]  [deg]                   [']
 83.6316  22.0213    0.4  50.6  -17.0  24.0855  31.7    0.4	Crab
110.6312 -17.7435    2.7  38.5   51.6   3.5735   4.2 ------	UNKNOWN
 37.8174 -73.1204    3.9  49.4  158.4   2.8383   3.0 ------	UNKNOWN
 98.7557   6.8104    3.0  43.7   10.4   1.9973   3.8 ------	UNKNOWN
359.3168 -49.8207    3.0  57.7 -167.3   6.4175   3.9 ------	UNKNOWN
 64.9964  10.2442    3.6  37.4  -41.5   1.4443   3.2 ------	UNKNOWN
 12.0325 -26.0781    2.7  51.4 -136.5   9.3437   4.2 ------	UNKNOWN