Analysis Summary
Notes:
- 1) No attempt has been made to eliminate the non-significant decimal places.
- 2) This batgrbproduct analysis is done using the HEASARC data.
- 3) This batgrbproduct analysis is using the flight position for the mask-weighting calculation.
======================================================================
                  BAT GRB EVENT DATA PROCESSING REPORT
    Process Script Ver: batgrbproduct v2.46
    Process Start Time: Wed Jan 22 17:14:29 EST 2014
             Host Name: batevent1
   Current Working Dir: /local/data/batevent/batevent_reproc/trigger207281
======================================================================

  Trigger: 00207281      Segment: 000

  BAT Trigger Time: 167830992   [s; MET]
      Trigger Stop: 167831056   [s; MET]
               UTC: 2006-04-27T11:43:10.841740    [includes UTCF correction]
       Where From?: TDRSS position message

  BAT
    RA: 124.30315943152   Dec: 62.6173129548239  [deg; J2000]

     Catalogged Source?: NO
     Point Source?:      YES
     GRB Indicated?:     YES    [ by BAT flight software ]
     Image S/N Ratio:    9.47
     Image Trigger?:     YES
     Rate S/N Ratio:     0  [ if not an image trigger ]
     Image S/N Ratio:    9.47

  Analysis Position:   [ source = BAT ]
    RA: 124.30315943152   Dec: 62.6173129548239  [deg; J2000]

  Refined Position:   [ source = BAT pre-slew burst ]
    RA: 124.201541706105   Dec: 62.6601382720296  [deg; J2000]
        { 08h 16m 48.4s , +62d 39' 36.5" }
         +/- 2.19843321734575 [arcmin] (estimated 90% radius based on SNR)
         +/- 1.25095979308777 [arcmin] (formal 1-sigma fit error)
    SNR: 9.87154492967367

  Angular difference between the analysis and refined position is 3.801946 arcmin

  Partial Coding Fraction: 0.7109375    [ including projection effects ]

  Duration
     T90: 62 +/- 16.4924225024706
        Measured from: -8
                   to: 54     [s; relative to TRIGTIME]
     T50: 28 +/- 10.295630140987
        Measured from: 1
                   to: 29     [s; relative to TRIGTIME]


  Fluence
     Peak Flux  (peak 1 second)
        Measured from: 2
                   to: 3     [s; relative to TRIGTIME]
     Total Fluence
        Measured from: -10
                   to: 61     [s; relative to TRIGTIME]

             Band 1     Band 2     Band 3     Band 4
              15-25      25-50     50-100    100-350     keV
 Total     0.321440   0.349698   0.207970   0.043664
           0.043218   0.044698   0.038789   0.032704 [error]
 Peak      0.017149   0.009765   0.007076   0.000330
           0.005174   0.005399   0.004674   0.003769 [error]

     [ fluence units of on-axis counts / fully illuminated detector ]

======================================================================


====== Table of the duration information =============================

        Value   tstart    tstop
T100   71.000  -10.000   61.000
T90    62.000   -8.000   54.000
T50    28.000    1.000   29.000
Peak    1.000    2.000    3.000


====== Spectral Analysis Summary =====================================

Model      : spectral model: simple power-law (PL) and cutoff power-law (CPL)
Ph_index   : photon index: E^{Ph_index}
Ph_90err   : 90% error of the photon index
Epeak      : Epeak in keV
Epeak_90err: 90% error of Epeak
Norm       : normalization at 50 keV in both the PL model and CPL model
Nomr_90err : 90% error of the normalization
chi2       : Chi-Squared
dof        : degree of freedo

=== Time-averaged spectral analysis ===
(Best model with acceptable fit: PL)

Model Ph_index Ph_90err_low Ph_90err_hi  Epeak  Epeak_90err_low  Epeak_90err_hi  Norm       Nomr_90err_low    Norm_90err_hi    chi2    dof
PL      -1.884    -0.291      0.270       -           -               -         7.70e-04     -1.39e-04          1.33e-04      59.250   57
CPL     -1.890    -0.609      0.633     9999.050      N/A           N/A         7.67e-04        N/A               N/A         59.250   56


=== 1-s peak spectral analysis ===
(Best model with acceptable fit: N/A)

Model Ph_index Ph_90err_low Ph_90err_hi  Epeak  Epeak_90err_low  Epeak_90err_hi  Norm       Nomr_90err_low    Norm_90err_hi    chi2    dof
PL      -1.892     -1.183     0.840       -           -               -         1.80e-03     -1.80e-03          1.07e-03      54.990   57
CPL     -0.733     -1.439     9.343       50.119      N/A           N/A         7.74e-03        N/A               N/A         54.660   56


=== Fluence/Peak Flux Summary ===

              Model    Band1     Band2     Band3     Band4     Band5     Total
                       15-25     25-50    50-100    100-350    15-150    15-350    keV
Fluence         PL   1.00e-07  1.46e-07  1.58e-07  3.20e-07  5.03e-07  7.25e-07   erg/cm2
      90%_error_low -2.06e-08 -2.05e-08 -3.87e-08 -1.35e-07 -8.71e-08 -1.79e-07   erg/cm2
      90%_error_hi   2.13e-08  2.05e-08  3.93e-08  1.87e-07  8.95e-08  2.21e-07   erg/cm2
Peak flux       PL   1.08e-01  8.65e-02  4.66e-02  3.66e-02  2.58e-01  2.78e-01   ph/cm2/s
      90%_error_low -6.70e-02 -4.30e-02 -3.49e-02 -3.66e-02 -1.26e-01 -1.38e-01   ph/cm2/s
      90%_error_hi   7.57e-02  4.25e-02  3.76e-02  8.28e-02  1.26e-01  1.42e-01   ph/cm2/s

Fluence        CPL    N/A     1.35e-07  1.41e-07  3.00e-07  4.71e-07  7.17e-07   erg/cm2
      90%_error_low -2.06e-08 -3.37e-08 -3.40e-08 -1.04e-07 -1.15e-07 -7.05e-07   erg/cm2
      90%_error_hi   2.13e-08  2.74e-08  2.72e-08  7.29e-08  8.74e-08  1.23e-07   erg/cm2
Peak flux      CPL   9.36e-02  9.90e-02  4.99e-02  1.20e-02  2.52e-01  2.54e-01   ph/cm2/s
      90%_error_low     N/A   -5.65e-02 -4.11e-02 -1.20e-02 -2.52e-01 -1.31e-01   ph/cm2/s
      90%_error_hi      N/A    6.00e-02  4.62e-02  4.11e-02  1.27e-01  1.53e-01   ph/cm2/s

======================================================================
Image
Pre-slew 15.0-350.0 keV image (Event data)
#   RAcent    DECcent   POSerr    Theta     Phi              Peak Cts       SNR   Name
  124.2015    62.6601   0.0196    24.5120  -122.2254         0.8798484      9.872 TRIG_00207281

Foreground time interval of the image:
-10.000  61.000 (delta_t =  71.000 [sec])
Background time interval of the image:
-239.000 -10.000 (delta_t = 229.000 [sec])
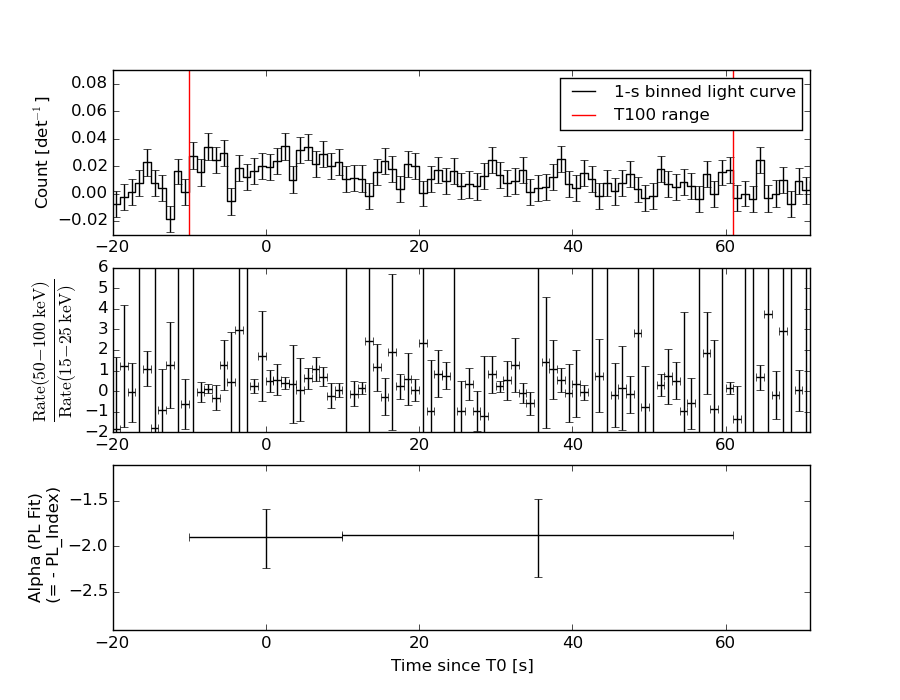
Light Curves
Note: The mask-weighted lightcurves have units of either count/det or counts/sec/det, where a det is 0.4 x 0.4 = 0.16 sq cm.
Full-time range; 1 s binning
Other quick-look light curves:
- 64 ms binning (zoomed)
- 16 ms binning (zoomed)
- 8 ms binning (zoomed)
- 2 ms binning (zoomed)
- SN=5 or 10 s binning (full-time range)
- Raw light curve
Spectra
- 64 ms binning (zoomed)
- 16 ms binning (zoomed)
- 8 ms binning (zoomed)
- 2 ms binning (zoomed)
- SN=5 or 10 s binning (full-time range)
- Raw light curve
Spectra
Notes:
- 1) The fitting includes the systematic errors.
- 2) When the burst includes telescope slew time periods, the fitting uses an average response file made from multiple 5-s response files through out the slew time plus single time preiod for the non-slew times, and weighted by the total counts in the corresponding time period using addrmf. An average response file is needed becuase a spectral fit using the pre-slew DRM will introduce some errors in both a spectral shape and a normalization if the PHA file contains a lot of the slew/post-slew time interval.
- 3) For fits to more complicated models (e.g. a power-law over a cutoff power-law), the BAT team has decided to require a chi-square improvement of more than 6 for each extra dof.
Time averaged spectrum fit using the average DRM
Power-law model
Time interval is from  -10.000 sec. to   61.000 sec.

Spectral model in power-law:
------------------------------------------------------------
Parameters  : value       lower 90%   higher 90%
Photon index: -1.88352     ( -0.291   0.270405 )
Norm@50keV  : 7.70393E-04    ( -0.00013881   0.000133079 )
------------------------------------------------------------
#Fit statistic : Chi-Squared =          59.25 using 59 PHA bins.
# Reduced chi-squared =          1.039 for     57 degrees of freedom
# Null hypothesis probability =   3.934146e-01

Photon flux (15-150 keV)    in 71 sec: 0.109801 ( -0.0154185  0.015423 ) ph/cm2/s
Energy fluence (15-150 keV)             : 5.02919e-07 ( -8.70772e-08  8.94856e-08 ) ergs/cm2
Cutoff power-law model
Time interval is from  -10.000 sec. to   61.000 sec.
Spectral model in the cutoff power-law:
------------------------------------------------------------
Parameters  : value       lower 90%   higher 90%
Photon index: -2.34894     ( -0.149881   1.09182 )
Epeak [keV] : 129.191      (   )
Norm@50keV  : 4.45463E-04    (     )
------------------------------------------------------------
#Fit statistic : Chi-Squared =          58.51 using 59 PHA bins.
# Reduced chi-squared =          1.045 for     56 degrees of freedom
# Null hypothesis probability =   3.832852e-01

Photon flux (15-150 keV)    in 71 sec: 0.101915 ( -0.0254625  0.021828 ) ph/cm2/s
Energy fluence (15-150 keV)             : 4.70683e-07 ( -1.15388e-07  8.74251e-08 ) ergs/cm2
1-s peak spectrum fit
Power-law model
Time interval is from    2.000 sec. to    3.000 sec.

Spectral model in power-law:
------------------------------------------------------------
Parameters  : value       lower 90%   higher 90%
Photon index: -1.89226     ( -1.18349   0.840061 )
Norm@50keV  : 1.80292E-03    ( -0.00180294   0.00107052 )
------------------------------------------------------------
#Fit statistic : Chi-Squared =          54.99 using 59 PHA bins.
# Reduced chi-squared =         0.9648 for     57 degrees of freedom
# Null hypothesis probability =   5.508138e-01

Photon flux (15-150 keV)    in 1 sec: 0.257907 ( -0.126391  0.126402 ) ph/cm2/s
Energy fluence (15-150 keV)             : 1.65775e-08 ( -9.53317e-09  1.05007e-08 ) ergs/cm2
Cutoff power-law model
Time interval is from    2.000 sec. to    3.000 sec.
Spectral model in the cutoff power-law:
------------------------------------------------------------
Parameters  : value       lower 90%   higher 90%
Photon index: -0.732905     ( -1.4348   9.34665 )
Epeak [keV] : 50.1187      (   )
Norm@50keV  : 7.74238E-03    (     )
------------------------------------------------------------
#Fit statistic : Chi-Squared =          54.66 using 59 PHA bins.
# Reduced chi-squared =         0.9761 for     56 degrees of freedom
# Null hypothesis probability =   5.256989e-01

Photon flux (15-150 keV)    in 1 sec: 0.252001 ( -0.252001  0.127306 ) ph/cm2/s
Energy fluence (15-150 keV)             : 1.57112e-08 ( 0  0 ) ergs/cm2
Time-resolved spectra
Distribution
T90 vs. Hardness ratio plot
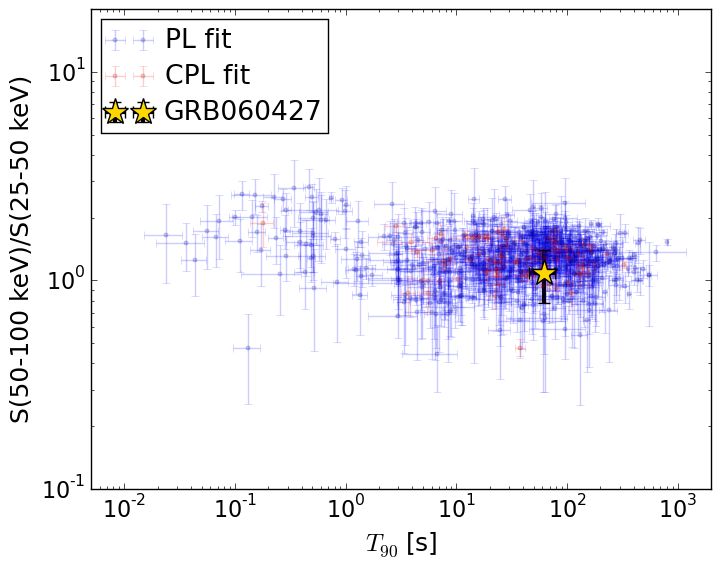
T90                                   = 62.0 sec.
Hardness ratio (energy fluence ratio) = 1.08410139433
S(15-50 keV) vs. S(50-150 keV) plot
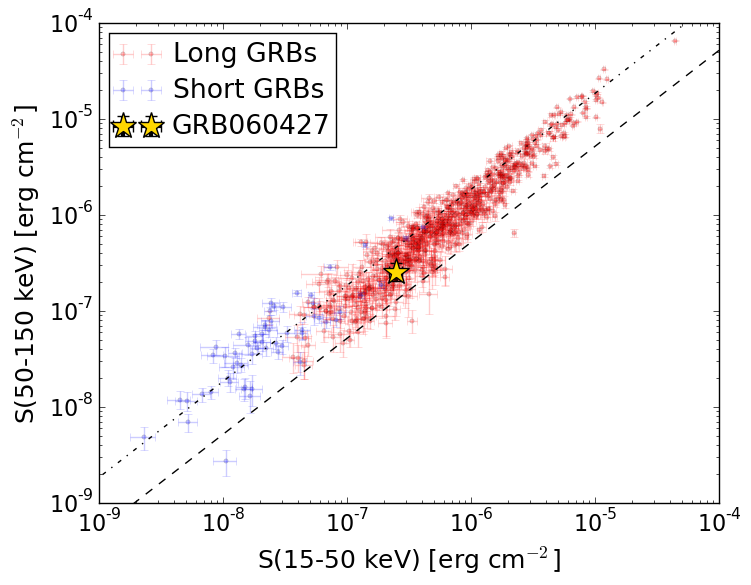
S(15-50 keV)  = 2.461324e-07
S(50-150 keV) = 2.5678186e-07
The dash-dotted line and the dashed line traces the fluences calculated from the Band function with Epeak = 15 and 150 keV, respectively. Both lines assume a canonical values of alpha = -1 and beta = -2.5.
Mask shadow pattern
IMX = -2.431519080151418E-01, IMY = 3.857386396362503E-01
Spacecraft aspect plot
Bright source in the pre-burst/pre-slew/post-slew images
Pre-burst image of 15-350 keV band
Time interval of the image:
-239.000000 -10.000000

# RAcent  DECcent POSerr Theta    Phi  PeakCts   SNR AngSep     Name
#  [deg]    [deg]    ['] [deg]  [deg]                   [']
 99.2261  53.7336    2.9  40.2 -124.4   1.1783   4.0 ------	UNKNOWN
101.1965  32.2919    3.5  55.2 -145.5   3.2077   3.2 ------	UNKNOWN
 56.0105  73.0346    2.4  41.0  -83.6   2.9652   4.8 ------	UNKNOWN
Pre-slew background subtracted image of 15-350 keV band
Time interval of the image:
-10.000000 61.000000

# RAcent  DECcent POSerr Theta    Phi  PeakCts   SNR AngSep     Name
#  [deg]    [deg]    ['] [deg]  [deg]                   [']
253.8904  50.1251    2.0  42.7    6.1   0.7798   5.8 ------	UNKNOWN
118.4013  18.9445    2.6  57.9 -169.8   1.7660   4.4 ------	UNKNOWN
124.2014  62.6601    1.2  24.5 -122.2   0.8790   9.9 ------	UNKNOWN
306.7405  76.4988    2.8  39.9  -45.0   0.5481   4.1 ------	UNKNOWN
Post-slew image of 15-350 keV band
Time interval of the image:
119.100640 963.074200

# RAcent  DECcent POSerr Theta    Phi  PeakCts   SNR AngSep     Name
#  [deg]    [deg]    ['] [deg]  [deg]                   [']
 83.6426  22.0044    1.1  49.0 -132.9  18.8367  10.5    0.8	Crab
166.0030  31.3604    2.5  40.9  113.8   6.1671   4.7 ------	UNKNOWN
118.1647  84.1392    3.3  21.6   -7.8   1.1948   3.5 ------	UNKNOWN
297.8707  81.4461    3.0  35.9   -4.5   1.8167   3.9 ------	UNKNOWN
 40.2721  79.2992    3.1  28.2  -29.1   1.2858   3.7 ------	UNKNOWN
 90.8742  12.7366    4.6  55.3 -145.2   6.3672   2.6 ------	UNKNOWN