Analysis Summary
Notes:
- 1) No attempt has been made to eliminate the non-significant decimal places.
- 2) This batgrbproduct analysis is done using the HEASARC data.
- 3) This batgrbproduct analysis is using the flight position for the mask-weighting calculation.
======================================================================
                  BAT GRB EVENT DATA PROCESSING REPORT
    Process Script Ver: batgrbproduct v2.46
    Process Start Time: Wed Jan 22 17:10:08 EST 2014
             Host Name: batevent1
   Current Working Dir: /local/data/batevent/batevent_reproc/trigger207364
======================================================================

  Trigger: 00207364      Segment: 000

  BAT Trigger Time: 167887369.216   [s; MET]
      Trigger Stop: 167887370.24   [s; MET]
               UTC: 2006-04-28T03:22:48.056420    [includes UTCF correction]
       Where From?: TDRSS position message

  BAT
    RA: 123.567655340779   Dec: -37.1647612611289  [deg; J2000]

     Catalogged Source?: NO
     Point Source?:      YES
     GRB Indicated?:     YES    [ by BAT flight software ]
     Image S/N Ratio:    7.35
     Image Trigger?:     NO
     Rate S/N Ratio:     9.4339811320566  [ if not an image trigger ]
     Image S/N Ratio:    7.35

  Analysis Position:   [ source = BAT ]
    RA: 123.567655340779   Dec: -37.1647612611289  [deg; J2000]

  Refined Position:   [ source = BAT pre-slew burst ]
    RA: 123.541649205845   Dec: -37.1689536776636  [deg; J2000]
        { 08h 14m 10.0s , -37d 10' 08.2" }
         +/- 0.944979430322587 [arcmin] (estimated 90% radius based on SNR)
         +/- 0.288077544167766 [arcmin] (formal 1-sigma fit error)
    SNR: 32.9783787251301

  Angular difference between the analysis and refined position is 1.268614 arcmin

  Partial Coding Fraction: 0.65625    [ including projection effects ]

  Duration
     T90: 39.4799999892712 +/- 3.8208355244297
        Measured from: -1.77199998497963
                   to: 37.7080000042915     [s; relative to TRIGTIME]
     T50: 22.1520000100136 +/- 1.66793766760253
        Measured from: 4.09600001573563
                   to: 26.2480000257492     [s; relative to TRIGTIME]


  Fluence
     Peak Flux  (peak 1 second)
        Measured from: 4.41200000047684
                   to: 5.41200000047684     [s; relative to TRIGTIME]
     Total Fluence
        Measured from: -6.81199997663498
                   to: 42.9600000083447     [s; relative to TRIGTIME]

             Band 1     Band 2     Band 3     Band 4
              15-25      25-50     50-100    100-350     keV
 Total     0.976776   1.018606   0.518548   0.079312
           0.038128   0.039479   0.034040   0.029142 [error]
 Peak      0.095244   0.101436   0.056482   0.006909
           0.006997   0.007276   0.006058   0.004621 [error]

     [ fluence units of on-axis counts / fully illuminated detector ]

======================================================================


====== Table of the duration information =============================

        Value   tstart    tstop
T100   49.772   -6.812   42.960
T90    39.480   -1.772   37.708
T50    22.152    4.096   26.248
Peak    1.000    4.412    5.412


====== Spectral Analysis Summary =====================================

Model      : spectral model: simple power-law (PL) and cutoff power-law (CPL)
Ph_index   : photon index: E^{Ph_index}
Ph_90err   : 90% error of the photon index
Epeak      : Epeak in keV
Epeak_90err: 90% error of Epeak
Norm       : normalization at 50 keV in both the PL model and CPL model
Nomr_90err : 90% error of the normalization
chi2       : Chi-Squared
dof        : degree of freedo

=== Time-averaged spectral analysis ===
(Best model with acceptable fit: PL)

Model Ph_index Ph_90err_low Ph_90err_hi  Epeak  Epeak_90err_low  Epeak_90err_hi  Norm       Nomr_90err_low    Norm_90err_hi    chi2    dof
PL      -2.016    -0.100      0.098       -           -               -         3.05e-03     -1.78e-04          1.76e-04      51.900   57
CPL     -1.713    -0.383      0.426       41.957     -41.875       -41.957      4.46e-03     -1.67e-03          3.11e-03      50.110   56


=== 1-s peak spectral analysis ===
(Best model with acceptable fit: CPL)

Model Ph_index Ph_90err_low Ph_90err_hi  Epeak  Epeak_90err_low  Epeak_90err_hi  Norm       Nomr_90err_low    Norm_90err_hi    chi2    dof
PL      -2.032     -0.152     0.146       -           -               -         1.50e-02     -1.54e-03          1.52e-03      62.450   57
CPL     -1.003     -0.638     0.756       40.635      -8.980         9.349      5.83e-02     -3.29e-02          1.02e-01      54.150   56


=== Fluence/Peak Flux Summary ===

              Model    Band1     Band2     Band3     Band4     Band5     Total
                       15-25     25-50    50-100    100-350    15-150    15-350    keV
Fluence         PL   3.15e-07  4.24e-07  4.19e-07  7.46e-07  1.40e-06  1.90e-06   erg/cm2
      90%_error_low -2.45e-08 -2.06e-08 -3.42e-08 -1.19e-07 -7.67e-08 -1.53e-07   erg/cm2
      90%_error_hi   2.51e-08  2.06e-08  3.45e-08  1.34e-07  7.74e-08  1.64e-07   erg/cm2
Peak flux       PL   1.03e+00  7.58e-01  3.71e-01  2.57e-01  2.28e+00  2.42e+00   ph/cm2/s
      90%_error_low -1.18e-01 -6.20e-02 -4.94e-02 -5.97e-02 -1.87e-01 -1.98e-01   ph/cm2/s
      90%_error_hi   1.21e-01  6.20e-02  4.99e-02  6.97e-02  1.87e-01  1.98e-01   ph/cm2/s

Fluence        CPL   3.03e-07  4.36e-07  4.16e-07  4.45e-07  1.36e-06  1.60e-06   erg/cm2
      90%_error_low -2.91e-08 -2.58e-08 -3.66e-08 -2.04e-07 -9.42e-08 -2.31e-07   erg/cm2
      90%_error_hi   2.95e-08  2.63e-08  3.61e-08  4.16e-07  9.49e-08  4.28e-07   erg/cm2
Peak flux      CPL   9.27e-01  8.49e-01  3.66e-01  7.71e-02  2.20e+00  2.22e+00   ph/cm2/s
      90%_error_low -1.36e-01 -8.28e-02 -6.02e-02 -4.33e-02 -1.92e-01 -1.99e-01   ph/cm2/s
      90%_error_hi   1.37e-01  8.53e-02  5.81e-02  8.19e-02  1.92e-01  2.04e-01   ph/cm2/s

======================================================================
Image
Pre-slew 15.0-350.0 keV image (Event data)
#   RAcent    DECcent   POSerr    Theta     Phi              Peak Cts       SNR   Name
  123.5416   -37.1690   0.0058    25.4066   137.9507         1.6768271     32.978 TRIG_00207364

Foreground time interval of the image:
 -6.812  10.885 (delta_t =  17.697 [sec])
Background time interval of the image:
-239.216  -6.812 (delta_t = 232.404 [sec])
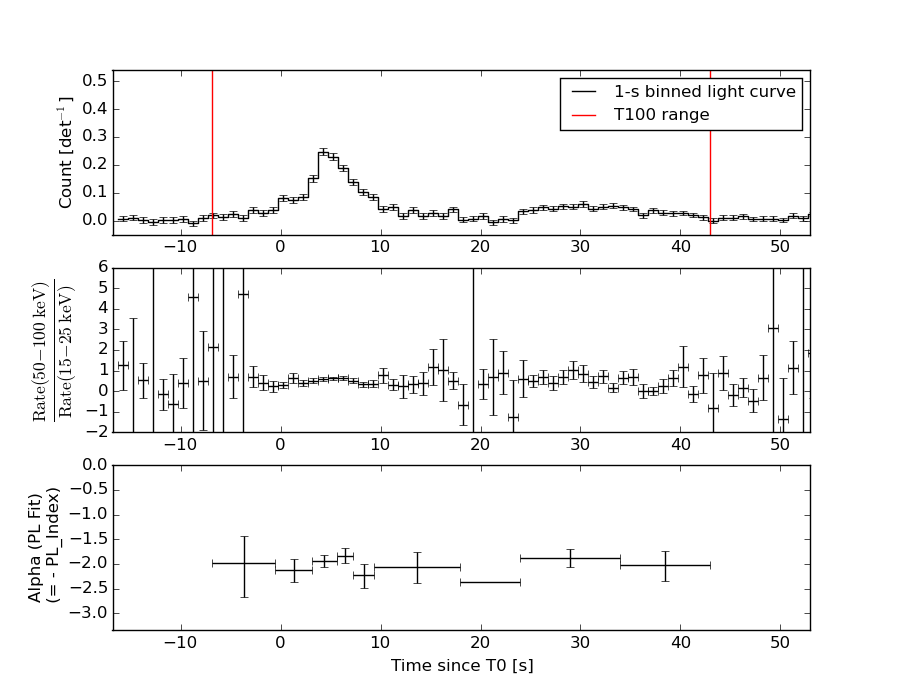
Light Curves
Note: The mask-weighted lightcurves have units of either count/det or counts/sec/det, where a det is 0.4 x 0.4 = 0.16 sq cm.
Full-time range; 1 s binning
Other quick-look light curves:
- 64 ms binning (zoomed)
- 16 ms binning (zoomed)
- 8 ms binning (zoomed)
- 2 ms binning (zoomed)
- SN=5 or 10 s binning (full-time range)
- Raw light curve
Spectra
- 64 ms binning (zoomed)
- 16 ms binning (zoomed)
- 8 ms binning (zoomed)
- 2 ms binning (zoomed)
- SN=5 or 10 s binning (full-time range)
- Raw light curve
Spectra
Notes:
- 1) The fitting includes the systematic errors.
- 2) When the burst includes telescope slew time periods, the fitting uses an average response file made from multiple 5-s response files through out the slew time plus single time preiod for the non-slew times, and weighted by the total counts in the corresponding time period using addrmf. An average response file is needed becuase a spectral fit using the pre-slew DRM will introduce some errors in both a spectral shape and a normalization if the PHA file contains a lot of the slew/post-slew time interval.
- 3) For fits to more complicated models (e.g. a power-law over a cutoff power-law), the BAT team has decided to require a chi-square improvement of more than 6 for each extra dof.
Time averaged spectrum fit using the average DRM
Power-law model
Time interval is from   -6.812 sec. to   42.960 sec.

Spectral model in power-law:
------------------------------------------------------------
Parameters  : value       lower 90%   higher 90%
Photon index: -2.01621     ( -0.10022   0.0980815 )
Norm@50keV  : 3.04966E-03    ( -0.000178071   0.000176139 )
------------------------------------------------------------
#Fit statistic : Chi-Squared =          51.90 using 59 PHA bins.
# Reduced chi-squared =         0.9105 for     57 degrees of freedom
# Null hypothesis probability =   6.663537e-01

Photon flux (15-150 keV)    in 49.77 sec: 0.460927 ( -0.023275  0.023327 ) ph/cm2/s
Energy fluence (15-150 keV)             : 1.40122e-06 ( -7.67379e-08  7.73988e-08 ) ergs/cm2
Cutoff power-law model
Time interval is from   -6.812 sec. to   42.960 sec.
Spectral model in the cutoff power-law:
------------------------------------------------------------
Parameters  : value       lower 90%   higher 90%
Photon index: -1.71292     ( -0.383366   0.425945 )
Epeak [keV] : 41.9573      ( -41.8751 -41.9573 )
Norm@50keV  : 4.46396E-03    ( -0.00166776   0.00310759 )
------------------------------------------------------------
#Fit statistic : Chi-Squared =          50.11 using 59 PHA bins.
# Reduced chi-squared =         0.8949 for     56 degrees of freedom
# Null hypothesis probability =   6.962048e-01

Photon flux (15-150 keV)    in 49.77 sec: 0.452020 ( -0.02576  0.025792 ) ph/cm2/s
Energy fluence (15-150 keV)             : 1.35659e-06 ( -9.4242e-08  9.49497e-08 ) ergs/cm2
1-s peak spectrum fit
Power-law model
Time interval is from    4.412 sec. to    5.412 sec.

Spectral model in power-law:
------------------------------------------------------------
Parameters  : value       lower 90%   higher 90%
Photon index: -2.03215     ( -0.152239   0.14553 )
Norm@50keV  : 1.49690E-02    ( -0.00153923   0.00151544 )
------------------------------------------------------------
#Fit statistic : Chi-Squared =          62.45 using 59 PHA bins.
# Reduced chi-squared =          1.096 for     57 degrees of freedom
# Null hypothesis probability =   2.887691e-01

Photon flux (15-150 keV)    in 1 sec: 2.27937 ( -0.18722  0.18729 ) ph/cm2/s
Energy fluence (15-150 keV)             : 1.38331e-07 ( -1.32129e-08  1.3416e-08 ) ergs/cm2
Cutoff power-law model
Time interval is from    4.412 sec. to    5.412 sec.
Spectral model in the cutoff power-law:
------------------------------------------------------------
Parameters  : value       lower 90%   higher 90%
Photon index: -1.00321     ( -0.637974   0.755817 )
Epeak [keV] : 40.6353      ( -8.98018 9.34894 )
Norm@50keV  : 5.83498E-02    ( -0.0328526   0.101766 )
------------------------------------------------------------
#Fit statistic : Chi-Squared =          54.15 using 59 PHA bins.
# Reduced chi-squared =         0.9670 for     56 degrees of freedom
# Null hypothesis probability =   5.451935e-01

Photon flux (15-150 keV)    in 1 sec: 2.20220 ( -0.19199  0.19231 ) ph/cm2/s
Energy fluence (15-150 keV)             : 1.27145e-07 ( -1.39753e-08  1.46073e-08 ) ergs/cm2
Time-resolved spectra
Distribution
T90 vs. Hardness ratio plot
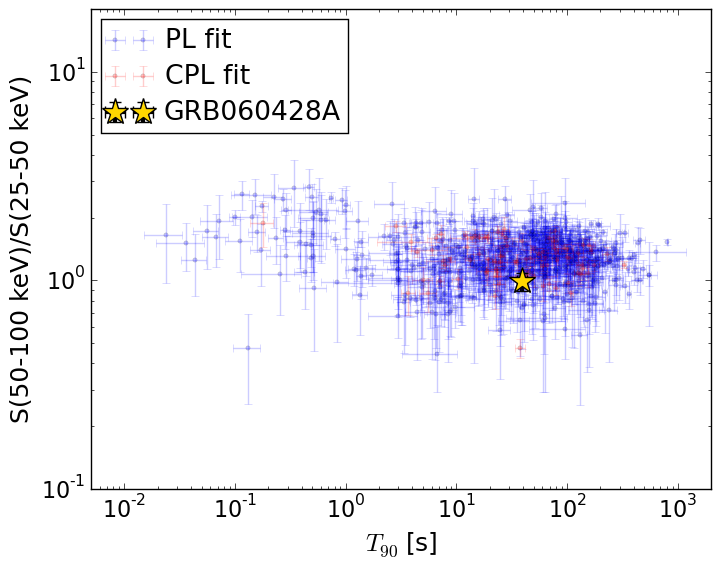
T90                                   = 39.48 sec.
Hardness ratio (energy fluence ratio) = 0.988848901172
S(15-50 keV) vs. S(50-150 keV) plot
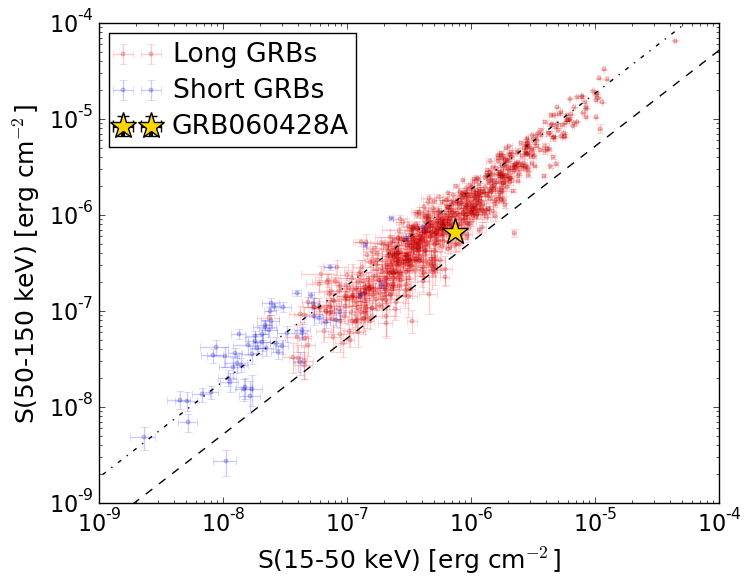
S(15-50 keV)  = 7.392084e-07
S(50-150 keV) = 6.620326e-07
The dash-dotted line and the dashed line traces the fluences calculated from the Band function with Epeak = 15 and 150 keV, respectively. Both lines assume a canonical values of alpha = -1 and beta = -2.5.
Mask shadow pattern
IMX = -3.527023013122125E-01, IMY = -3.181246530503754E-01
Spacecraft aspect plot
Bright source in the pre-burst/pre-slew/post-slew images
Pre-burst image of 15-350 keV band
Time interval of the image:
-239.216000 -6.812000

# RAcent  DECcent POSerr Theta    Phi  PeakCts   SNR AngSep     Name
#  [deg]    [deg]    ['] [deg]  [deg]                   [']
135.3006 -40.6376   46.1  33.3  126.1  -0.0659  -0.3   11.5	Vela X-1
 74.5984 -48.2777    2.7  47.1 -168.0   1.2219   4.2 ------	UNKNOWN
Pre-slew background subtracted image of 15-350 keV band
Time interval of the image:
-6.812000 10.884590

# RAcent  DECcent POSerr Theta    Phi  PeakCts   SNR AngSep     Name
#  [deg]    [deg]    ['] [deg]  [deg]                   [']
135.6884 -40.6446    6.2  33.5  125.7  -0.1434  -1.9    9.1	Vela X-1
123.5416 -37.1690    0.4  25.4  138.0   1.6769  33.0 ------	UNKNOWN
 97.5309  11.2134    2.3  29.2  -55.3   0.2626   5.0 ------	UNKNOWN
105.8915  31.1468    2.2  45.2  -31.3   0.3750   5.3 ------	UNKNOWN
 58.7912 -34.6452    1.9  53.2 -145.9   1.0181   5.9 ------	UNKNOWN
Post-slew image of 15-350 keV band
Time interval of the image:
57.484600 962.832800

# RAcent  DECcent POSerr Theta    Phi  PeakCts   SNR AngSep     Name
#  [deg]    [deg]    ['] [deg]  [deg]                   [']
135.6147 -40.7082    4.5  10.0  102.2  -0.9043  -2.5   10.0	Vela X-1
170.3136 -60.5289    3.8  37.4  131.5   2.5704   3.0    5.6	Cen X-3
186.5766 -62.7402   13.0  45.4  132.7   1.5446   0.9    2.8	GX 301-2
144.0326 -28.3813    2.4  19.3   56.6   1.9661   4.7 ------	UNKNOWN
102.4065 -30.4491    3.2  18.8  -87.6   1.5506   3.7 ------	UNKNOWN
 98.9460   8.0339    4.3  50.7  -44.5   6.6175   2.7 ------	UNKNOWN