Analysis Summary
Notes:
- 1) No attempt has been made to eliminate the non-significant decimal places.
- 2) This batgrbproduct analysis is done using the HEASARC data.
- 3) This batgrbproduct analysis is using the flight position for the mask-weighting calculation.
======================================================================
                  BAT GRB EVENT DATA PROCESSING REPORT
    Process Script Ver: batgrbproduct v2.46
    Process Start Time: Wed Jan 22 17:06:07 EST 2014
             Host Name: batevent1
   Current Working Dir: /local/data/batevent/batevent_reproc/trigger207399
======================================================================

  Trigger: 00207399      Segment: 000

  BAT Trigger Time: 167907280   [s; MET]
      Trigger Stop: 167907408   [s; MET]
               UTC: 2006-04-28T08:54:38.839960    [includes UTCF correction]
       Where From?: TDRSS position message

  BAT
    RA: 235.350233277521   Dec: 62.0100932089346  [deg; J2000]

     Catalogged Source?: NO
     Point Source?:      YES
     GRB Indicated?:     YES    [ by BAT flight software ]
     Image S/N Ratio:    14.21
     Image Trigger?:     YES
     Rate S/N Ratio:     0  [ if not an image trigger ]
     Image S/N Ratio:    14.21

  Analysis Position:   [ source = BAT ]
    RA: 235.350233277521   Dec: 62.0100932089346  [deg; J2000]

  Refined Position:   [ source = BAT pre-slew burst ]
    RA: 235.346372263927   Dec: 62.0180387074765  [deg; J2000]
        { 15h 41m 23.1s , +62d 01' 04.9" }
         +/- 2.75105152721155 [arcmin] (estimated 90% radius based on SNR)
         +/- 1.64213268654636 [arcmin] (formal 1-sigma fit error)
    SNR: 7.16577320675431

  Angular difference between the analysis and refined position is 0.488967 arcmin

  Partial Coding Fraction: 0.7421875    [ including projection effects ]

  Duration
     T90: 96 +/- 50.5964425626941
        Measured from: -15
                   to: 81     [s; relative to TRIGTIME]
     T50: 16 +/- 22.6274169979695
        Measured from: 1
                   to: 17     [s; relative to TRIGTIME]


  Fluence
     Peak Flux  (peak 1 second)
        Measured from: 8.5
                   to: 9.5     [s; relative to TRIGTIME]
     Total Fluence
        Measured from: -15
                   to: 113     [s; relative to TRIGTIME]

             Band 1     Band 2     Band 3     Band 4
              15-25      25-50     50-100    100-350     keV
 Total     0.987094   0.788057   0.079260   0.036526
           0.063340   0.066089   0.058137   0.051424 [error]
 Peak      0.017597   0.013364   0.005690  -0.005076
           0.005793   0.005954   0.005202   0.004435 [error]

     [ fluence units of on-axis counts / fully illuminated detector ]

======================================================================


====== Table of the duration information =============================

        Value   tstart    tstop
T100  128.000  -15.000  113.000
T90    96.000  -15.000   81.000
T50    16.000    1.000   17.000
Peak    1.000    8.500    9.500


====== Spectral Analysis Summary =====================================

Model      : spectral model: simple power-law (PL) and cutoff power-law (CPL)
Ph_index   : photon index: E^{Ph_index}
Ph_90err   : 90% error of the photon index
Epeak      : Epeak in keV
Epeak_90err: 90% error of Epeak
Norm       : normalization at 50 keV in both the PL model and CPL model
Nomr_90err : 90% error of the normalization
chi2       : Chi-Squared
dof        : degree of freedo

=== Time-averaged spectral analysis ===
(Best model with acceptable fit: PL)

Model Ph_index Ph_90err_low Ph_90err_hi  Epeak  Epeak_90err_low  Epeak_90err_hi  Norm       Nomr_90err_low    Norm_90err_hi    chi2    dof
PL      -2.781    -0.257      0.234       -           -               -         6.02e-04     -1.16e-04          1.18e-04      68.940   57
CPL     -0.408    -1.580      2.427       20.447      N/A           N/A         2.52e-02        N/A               N/A         63.200   56


=== 1-s peak spectral analysis ===
(Best model with acceptable fit: N/A)

Model Ph_index Ph_90err_low Ph_90err_hi  Epeak  Epeak_90err_low  Epeak_90err_hi  Norm       Nomr_90err_low    Norm_90err_hi    chi2    dof
PL      -2.255     -1.008     0.751       -           -               -         1.81e-03     -1.15e-03          1.19e-03      68.010   57
CPL      9.926    -10.071    -9.926       25.399      -3.911         4.501      2.07e+06     -2.07e+06          1.43e+07      63.770   56


=== Fluence/Peak Flux Summary ===

              Model    Band1     Band2     Band3     Band4     Band5     Total
                       15-25     25-50    50-100    100-350    15-150    15-350    keV
Fluence         PL   3.33e-07  2.84e-07  1.65e-07  1.43e-07  8.44e-07  9.25e-07   erg/cm2
      90%_error_low -3.94e-08 -3.57e-08 -4.13e-08 -5.73e-08 -1.02e-07 -1.32e-07   erg/cm2
      90%_error_hi   3.98e-08  3.50e-08  4.57e-08  8.10e-08  1.07e-07  1.49e-07   erg/cm2
Peak flux       PL   1.55e-01  1.00e-01  4.18e-02  2.38e-02  3.09e-01  3.21e-01   ph/cm2/s
      90%_error_low -8.10e-02 -4.96e-02 -3.01e-02 -2.38e-02 -1.41e-01 -1.49e-01   ph/cm2/s
      90%_error_hi   8.53e-02  4.83e-02  3.84e-02  5.59e-02  1.42e-01  1.52e-01   ph/cm2/s

Fluence        CPL   3.17e-07  3.21e-07  7.23e-08  1.92e-09  7.12e-07  7.12e-07   erg/cm2
      90%_error_low -4.45e-08    N/A    -4.26e-08    N/A    -8.93e-08    N/A      erg/cm2
      90%_error_hi   4.36e-08    N/A     7.45e-08    N/A     1.14e-07    N/A      erg/cm2
Peak flux      CPL   1.68e-01  1.10e-01  4.13e-04  2.45e-11  2.84e-01  2.83e-01   ph/cm2/s
      90%_error_low -7.86e-02 -5.42e-02 -4.13e-04 -2.45e-11 -1.04e-01 -1.04e-01   ph/cm2/s
      90%_error_hi   1.05e-01  8.74e-02  4.65e-02  -2.45e-11  1.35e-01  1.36e-01   ph/cm2/s

======================================================================
Image
Pre-slew 15.0-350.0 keV image (Event data)

#   RAcent    DECcent   POSerr    Theta     Phi              Peak Cts       SNR   Name
  235.3464    62.0180   0.0268    31.1257     2.6276         1.6281245      7.166 TRIG_00207399

Foreground time interval of the image:
-15.000 113.000 (delta_t = 128.000 [sec])
Background time interval of the image:
-68.699 -15.000 (delta_t =  53.699 [sec])
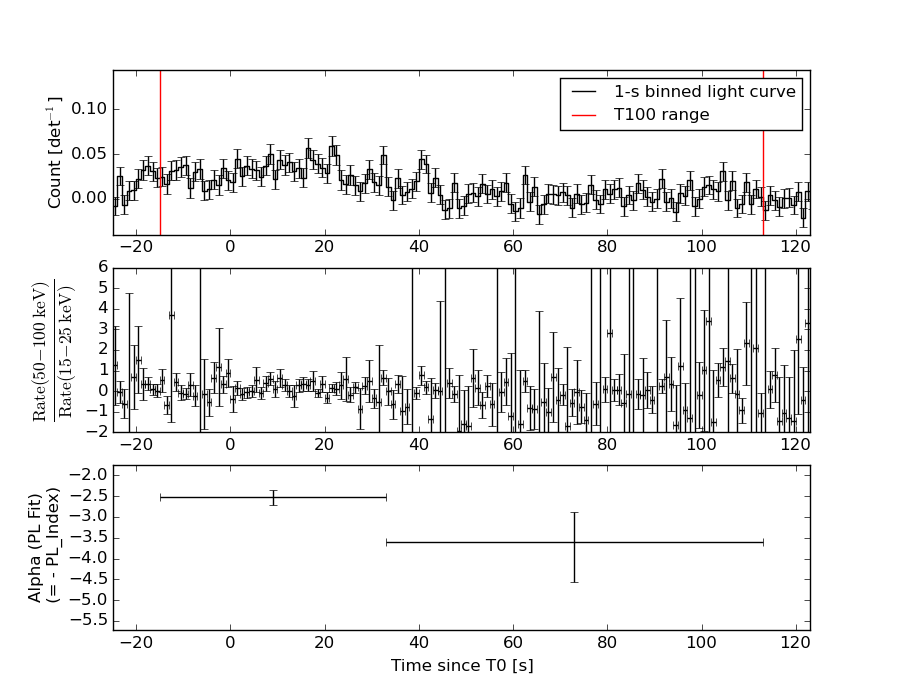
Light Curves
Note: The mask-weighted lightcurves have units of either count/det or counts/sec/det, where a det is 0.4 x 0.4 = 0.16 sq cm.
Full-time range; 1 s binning
Other quick-look light curves:
- 64 ms binning (zoomed)
- 16 ms binning (zoomed)
- 8 ms binning (zoomed)
- 2 ms binning (zoomed)
- SN=5 or 10 s binning (full-time range)
- Raw light curve
Spectra
- 64 ms binning (zoomed)
- 16 ms binning (zoomed)
- 8 ms binning (zoomed)
- 2 ms binning (zoomed)
- SN=5 or 10 s binning (full-time range)
- Raw light curve
Spectra
Notes:
- 1) The fitting includes the systematic errors.
- 2) When the burst includes telescope slew time periods, the fitting uses an average response file made from multiple 5-s response files through out the slew time plus single time preiod for the non-slew times, and weighted by the total counts in the corresponding time period using addrmf. An average response file is needed becuase a spectral fit using the pre-slew DRM will introduce some errors in both a spectral shape and a normalization if the PHA file contains a lot of the slew/post-slew time interval.
- 3) For fits to more complicated models (e.g. a power-law over a cutoff power-law), the BAT team has decided to require a chi-square improvement of more than 6 for each extra dof.
Time averaged spectrum fit using the average DRM
Power-law model
Time interval is from  -15.000 sec. to  113.000 sec.

Spectral model in power-law:
------------------------------------------------------------
Parameters  : value       lower 90%   higher 90%
Photon index: -2.78118     ( -0.256811   0.233988 )
Norm@50keV  : 6.01583E-04    ( -0.000115804   0.000118123 )
------------------------------------------------------------
#Fit statistic : Chi-Squared =          68.94 using 59 PHA bins.
# Reduced chi-squared =          1.209 for     57 degrees of freedom
# Null hypothesis probability =   1.335460e-01

Photon flux (15-150 keV)    in 128 sec: 0.141818 ( -0.013953  0.013954 ) ph/cm2/s
Energy fluence (15-150 keV)             : 8.44054e-07 ( -1.02487e-07  1.06726e-07 ) ergs/cm2
Cutoff power-law model
Time interval is from  -15.000 sec. to  113.000 sec.
Spectral model in the cutoff power-law:
------------------------------------------------------------
Parameters  : value       lower 90%   higher 90%
Photon index: -0.408089     ( -1.60308   2.40335 )
Epeak [keV] : 20.4470      (   )
Norm@50keV  : 2.51673E-02    (     )
------------------------------------------------------------
#Fit statistic : Chi-Squared =          63.20 using 59 PHA bins.
# Reduced chi-squared =          1.128 for     56 degrees of freedom
# Null hypothesis probability =   2.372322e-01

Photon flux (15-150 keV)    in 128 sec: 0.133445 (    ) ph/cm2/s
Energy fluence (15-150 keV)             : 7.11622e-07 ( -8.92506e-08  1.13503e-07 ) ergs/cm2
1-s peak spectrum fit
Power-law model
Time interval is from    8.500 sec. to    9.500 sec.

Spectral model in power-law:
------------------------------------------------------------
Parameters  : value       lower 90%   higher 90%
Photon index: -2.25498     ( -1.00136   0.757467 )
Norm@50keV  : 1.81429E-03    ( -0.00115098   0.00119651 )
------------------------------------------------------------
#Fit statistic : Chi-Squared =          68.01 using 59 PHA bins.
# Reduced chi-squared =          1.193 for     57 degrees of freedom
# Null hypothesis probability =   1.507430e-01

Photon flux (15-150 keV)    in 1 sec: 0.309256 ( -0.14085  0.141899 ) ph/cm2/s
Energy fluence (15-150 keV)             : 1.71728e-08 ( -9.0701e-09  1.04845e-08 ) ergs/cm2
Cutoff power-law model
Time interval is from    8.500 sec. to    9.500 sec.
Spectral model in the cutoff power-law:
------------------------------------------------------------
Parameters  : value       lower 90%   higher 90%
Photon index: 10     ( -10.145   -10 )
Epeak [keV] : 25.2679      ( -3.78136 4.63102 )
Norm@50keV  : 2.49796E+06    ( -2.49676e+06   1.39144e+07 )
------------------------------------------------------------
#Fit statistic : Chi-Squared =          63.76 using 59 PHA bins.
# Reduced chi-squared =          1.139 for     56 degrees of freedom
# Null hypothesis probability =   2.224579e-01

Photon flux (15-150 keV)    in 1 sec: 0.284054 ( -0.104368  0.135208 ) ph/cm2/s
Energy fluence (15-150 keV)             : 1.10477e-08 ( -4.10673e-09  5.62017e-09 ) ergs/cm2
Time-resolved spectra
Distribution
T90 vs. Hardness ratio plot

T90                                   = 96.0 sec.
Hardness ratio (energy fluence ratio) = 0.581955718244
S(15-50 keV) vs. S(50-150 keV) plot
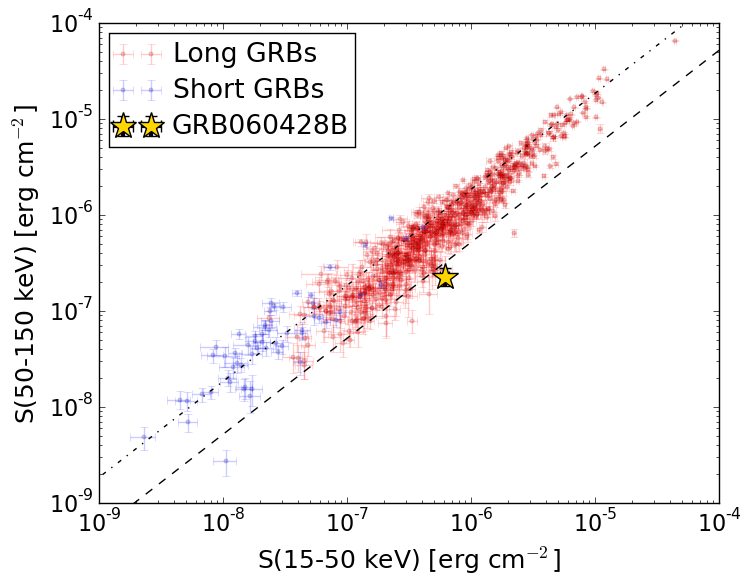
S(15-50 keV)  = 6.165611e-07
S(50-150 keV) = 2.2750794e-07
The dash-dotted line and the dashed line traces the fluences calculated from the Band function with Epeak = 15 and 150 keV, respectively. Both lines assume a canonical values of alpha = -1 and beta = -2.5.
Mask shadow pattern
IMX = 6.032146379186801E-01, IMY = -2.768270523241032E-02
Spacecraft aspect plot
Bright source in the pre-burst/pre-slew/post-slew images
Pre-burst image of 15-350 keV band
Time interval of the image:
-68.699410 -15.000000

# RAcent  DECcent POSerr Theta    Phi  PeakCts   SNR AngSep     Name
#  [deg]    [deg]    ['] [deg]  [deg]                   [']
163.5268   3.3446    2.8  50.6  152.7   1.1401   4.2 ------	UNKNOWN
129.1389  37.3962    2.3  37.2 -140.5   0.4896   5.1 ------	UNKNOWN
Pre-slew background subtracted image of 15-350 keV band
Time interval of the image:
-15.000000 113.000000

# RAcent  DECcent POSerr Theta    Phi  PeakCts   SNR AngSep     Name
#  [deg]    [deg]    ['] [deg]  [deg]                   [']
251.4288  40.4541    2.2  49.4   26.4   3.9357   5.3 ------	UNKNOWN
151.1015  17.7083    2.3  40.8  175.3   1.4377   5.0 ------	UNKNOWN
235.3466  62.0181    1.6  31.1    2.6   1.6291   7.2 ------	UNKNOWN
240.1602  62.9219    2.3  33.2    0.3   1.0873   5.0 ------	UNKNOWN
143.0169  16.4109    2.3  45.5 -175.5   1.6429   4.9 ------	UNKNOWN
134.3727  13.8430    2.4  52.0 -167.8   2.0863   4.9 ------	UNKNOWN
176.8156  79.7554    2.0  27.4  -47.5   1.2492   5.8 ------	UNKNOWN
322.7755  74.0217    2.2  51.3  -34.9   3.1257   5.3 ------	UNKNOWN
Post-slew image of 15-350 keV band
Time interval of the image:
190.300590 963.070000

# RAcent  DECcent POSerr Theta    Phi  PeakCts   SNR AngSep     Name
#  [deg]    [deg]    ['] [deg]  [deg]                   [']
254.4454  35.3423    1.1  29.2   37.3   5.1957  10.4    0.6	Her X-1
299.5966  35.1979    0.3  47.5  -16.3  27.8908  33.3    0.4	Cyg X-1
308.0058  41.0752    5.8  46.7  -28.3   1.5824   2.0    8.7	Cyg X-3
205.9558  57.4821    2.2  15.3  156.6   1.9839   5.3 ------	UNKNOWN