Analysis Summary
Notes:
- 1) No attempt has been made to eliminate the non-significant decimal places.
- 2) This batgrbproduct analysis is done using the HEASARC data.
- 3) This batgrbproduct analysis is using the flight position for the mask-weighting calculation.
======================================================================
                  BAT GRB EVENT DATA PROCESSING REPORT
    Process Script Ver: batgrbproduct v2.46
    Process Start Time: Wed Jan 22 16:53:07 EST 2014
             Host Name: batevent1
   Current Working Dir: /local/data/batevent/batevent_reproc/trigger208050
======================================================================

  Trigger: 00208050      Segment: 000

  BAT Trigger Time: 168164100.032   [s; MET]
      Trigger Stop: 168164101.056   [s; MET]
               UTC: 2006-05-01T08:14:58.865920    [includes UTCF correction]
       Where From?: TDRSS position message

  BAT
    RA: 328.367202913993   Dec: 43.9831881862281  [deg; J2000]

     Catalogged Source?: NO
     Point Source?:      YES
     GRB Indicated?:     YES    [ by BAT flight software ]
     Image S/N Ratio:    11.15
     Image Trigger?:     NO
     Rate S/N Ratio:     23.3023603954621  [ if not an image trigger ]
     Image S/N Ratio:    11.15

  Analysis Position:   [ source = BAT ]
    RA: 328.367202913993   Dec: 43.9831881862281  [deg; J2000]

  Refined Position:   [ source = BAT pre-slew burst ]
    RA: 328.368779028254   Dec: 43.9999259906866  [deg; J2000]
        { 21h 53m 28.5s , +43d 59' 59.7" }
         +/- 1.4668303481302 [arcmin] (estimated 90% radius based on SNR)
         +/- 0.504397776771621 [arcmin] (formal 1-sigma fit error)
    SNR: 17.5967647278263

  Angular difference between the analysis and refined position is 1.006570 arcmin

  Partial Coding Fraction: 0.3671875    [ including projection effects ]

  Duration
     T90: 25.6280000209808 +/- 10.379552205759
        Measured from: -3.27200001478195
                   to: 22.3560000061989     [s; relative to TRIGTIME]
     T50: 7.30000001192093 +/- 1.40534408393302
        Measured from: 0.219999998807907
                   to: 7.52000001072884     [s; relative to TRIGTIME]


  Fluence
     Peak Flux  (peak 1 second)
        Measured from: 0.375999987125397
                   to: 1.3759999871254     [s; relative to TRIGTIME]
     Total Fluence
        Measured from: -10.1159999966621
                   to: 30.1519999802113     [s; relative to TRIGTIME]

             Band 1     Band 2     Band 3     Band 4
              15-25      25-50     50-100    100-350     keV
 Total     0.487431   0.730767   0.622639   0.209619
           0.054911   0.058040   0.052049   0.046318 [error]
 Peak      0.042891   0.076873   0.095633   0.030810
           0.009115   0.010391   0.010059   0.008087 [error]

     [ fluence units of on-axis counts / fully illuminated detector ]

======================================================================


====== Table of the duration information =============================

        Value   tstart    tstop
T100   40.268  -10.116   30.152
T90    25.628   -3.272   22.356
T50     7.300    0.220    7.520
Peak    1.000    0.376    1.376


====== Spectral Analysis Summary =====================================

Model      : spectral model: simple power-law (PL) and cutoff power-law (CPL)
Ph_index   : photon index: E^{Ph_index}
Ph_90err   : 90% error of the photon index
Epeak      : Epeak in keV
Epeak_90err: 90% error of Epeak
Norm       : normalization at 50 keV in both the PL model and CPL model
Nomr_90err : 90% error of the normalization
chi2       : Chi-Squared
dof        : degree of freedo

=== Time-averaged spectral analysis ===
(Best model with acceptable fit: PL)

Model Ph_index Ph_90err_low Ph_90err_hi  Epeak  Epeak_90err_low  Epeak_90err_hi  Norm       Nomr_90err_low    Norm_90err_hi    chi2    dof
PL      -1.499    -0.150      0.149       -           -               -         3.65e-03     -3.05e-04          3.04e-04      51.260   57
CPL     -1.421    -0.217      0.588      375.400    -375.400      -375.400      3.97e-03     -3.97e-03          -2.04e-03      51.220   56


=== 1-s peak spectral analysis ===
(Best model with acceptable fit: N/A)

Model Ph_index Ph_90err_low Ph_90err_hi  Epeak  Epeak_90err_low  Epeak_90err_hi  Norm       Nomr_90err_low    Norm_90err_hi    chi2    dof
PL      -0.961     -0.210     0.220       -           -               -         1.75e-02     -2.28e-03          2.25e-03      76.010   57
CPL     -0.620     -0.442     0.948      260.563    -260.563      -260.563      2.39e-02     -8.25e-03          2.93e-02      75.480   56


=== Fluence/Peak Flux Summary ===

              Model    Band1     Band2     Band3     Band4     Band5     Total
                       15-25     25-50    50-100    100-350    15-150    15-350    keV
Fluence         PL   1.88e-07  3.45e-07  4.88e-07  1.45e-06  1.40e-06  2.47e-06   erg/cm2
      90%_error_low -2.82e-08 -3.17e-08 -5.14e-08 -3.10e-07 -1.24e-07 -3.49e-07   erg/cm2
      90%_error_hi   2.95e-08  3.14e-08  5.08e-08  3.62e-07  1.25e-07  3.90e-07   erg/cm2
Peak flux       PL   4.31e-01  5.99e-01  6.15e-01  1.16e+00  2.01e+00  2.80e+00   ph/cm2/s
      90%_error_low -1.13e-01 -1.03e-01 -7.63e-02 -2.81e-01 -2.65e-01 -3.52e-01   ph/cm2/s
      90%_error_hi   1.25e-01  1.01e-01  7.59e-02  3.34e-01  2.67e-01  3.59e-01   ph/cm2/s

Fluence        CPL   1.84e-07  3.47e-07  4.92e-07  1.30e-06  1.39e-06  2.32e-06   erg/cm2
      90%_error_low -3.50e-08 -3.34e-08 -5.46e-08 -6.67e-07 -1.31e-07 -6.75e-07   erg/cm2
      90%_error_hi   2.68e-08  3.55e-08  5.82e-08  2.21e-07  1.26e-07  3.51e-07   erg/cm2
Peak flux      CPL   3.84e-01  6.00e-01  6.45e-01  8.83e-01  1.98e+00  2.51e+00   ph/cm2/s
      90%_error_low -1.48e-01 -1.08e-01 -9.73e-02 -3.99e-01 -2.73e-01 -5.13e-01   ph/cm2/s
      90%_error_hi   1.58e-01  1.06e-01  1.04e-01  3.77e-01  2.75e-01  4.83e-01   ph/cm2/s

======================================================================
Image
Pre-slew 15.0-350.0 keV image (Event data)
#   RAcent    DECcent   POSerr    Theta     Phi              Peak Cts       SNR   Name
  328.3688    43.9999   0.0110    47.7285  -170.2495         2.0550801     17.597 TRIG_00208050

Foreground time interval of the image:
-10.116  30.152 (delta_t =  40.268 [sec])
Background time interval of the image:
-204.531 -10.116 (delta_t = 194.415 [sec])
Light Curves
Note: The mask-weighted lightcurves have units of either count/det or counts/sec/det, where a det is 0.4 x 0.4 = 0.16 sq cm.
Full-time range; 1 s binning
Other quick-look light curves:
- 64 ms binning (zoomed)
- 16 ms binning (zoomed)
- 8 ms binning (zoomed)
- 2 ms binning (zoomed)
- SN=5 or 10 s binning (full-time range)
- Raw light curve
Spectra
- 64 ms binning (zoomed)
- 16 ms binning (zoomed)
- 8 ms binning (zoomed)
- 2 ms binning (zoomed)
- SN=5 or 10 s binning (full-time range)
- Raw light curve
Spectra
Notes:
- 1) The fitting includes the systematic errors.
- 2) When the burst includes telescope slew time periods, the fitting uses an average response file made from multiple 5-s response files through out the slew time plus single time preiod for the non-slew times, and weighted by the total counts in the corresponding time period using addrmf. An average response file is needed becuase a spectral fit using the pre-slew DRM will introduce some errors in both a spectral shape and a normalization if the PHA file contains a lot of the slew/post-slew time interval.
- 3) For fits to more complicated models (e.g. a power-law over a cutoff power-law), the BAT team has decided to require a chi-square improvement of more than 6 for each extra dof.
Time averaged spectrum fit using the average DRM
Power-law model
Time interval is from  -10.116 sec. to   30.152 sec.

Spectral model in power-law:
------------------------------------------------------------
Parameters  : value       lower 90%   higher 90%
Photon index: -1.49938     ( -0.149719   0.148855 )
Norm@50keV  : 3.65147E-03    ( -0.000304542   0.000303812 )
------------------------------------------------------------
#Fit statistic : Chi-Squared =          51.26 using 59 PHA bins.
# Reduced chi-squared =         0.8993 for     57 degrees of freedom
# Null hypothesis probability =   6.892166e-01

Photon flux (15-150 keV)    in 40.27 sec: 0.455781 ( -0.04005  0.040251 ) ph/cm2/s
Energy fluence (15-150 keV)             : 1.39525e-06 ( -1.24317e-07  1.24991e-07 ) ergs/cm2
Cutoff power-law model
Time interval is from  -10.116 sec. to   30.152 sec.
Spectral model in the cutoff power-law:
------------------------------------------------------------
Parameters  : value       lower 90%   higher 90%
Photon index: -2.28209     ( -0.216804   0.588526 )
Epeak [keV] : 103.255      ( -400.262 -400.262 )
Norm@50keV  : 1.27031E-03    ( -0.00127008   0.000660853 )
------------------------------------------------------------
#Fit statistic : Chi-Squared =          49.95 using 59 PHA bins.
# Reduced chi-squared =         0.8919 for     56 degrees of freedom
# Null hypothesis probability =   7.020735e-01

Photon flux (15-150 keV)    in 40.27 sec: 0.453874 ( -0.041982  0.041492 ) ph/cm2/s
Energy fluence (15-150 keV)             : 1.38977e-06 ( -1.30575e-07  1.26207e-07 ) ergs/cm2
1-s peak spectrum fit
Power-law model

Time interval is from    0.376 sec. to    1.376 sec.

Spectral model in power-law:
------------------------------------------------------------
Parameters  : value       lower 90%   higher 90%
Photon index: -0.960651     ( -0.209985   0.219809 )
Norm@50keV  : 1.75182E-02    ( -0.00228435   0.00224853 )
------------------------------------------------------------
#Fit statistic : Chi-Squared =          76.01 using 59 PHA bins.
# Reduced chi-squared =          1.333 for     57 degrees of freedom
# Null hypothesis probability =   4.700213e-02

Photon flux (15-150 keV)    in 1 sec: 2.01336 ( -0.26496  0.26676 ) ph/cm2/s
Energy fluence (15-150 keV)             : 1.92163e-07 ( -2.3915e-08  2.39446e-08 ) ergs/cm2
Cutoff power-law model
Time interval is from    0.376 sec. to    1.376 sec.
Spectral model in the cutoff power-law:
------------------------------------------------------------
Parameters  : value       lower 90%   higher 90%
Photon index: -0.619933     ( -0.441938   0.948322 )
Epeak [keV] : 260.563      ( -260.536 -260.536 )
Norm@50keV  : 2.39079E-02    ( -0.00824636   0.0292633 )
------------------------------------------------------------
#Fit statistic : Chi-Squared =          75.48 using 59 PHA bins.
# Reduced chi-squared =          1.348 for     56 degrees of freedom
# Null hypothesis probability =   4.235876e-02

Photon flux (15-150 keV)    in 1 sec: 1.98440 ( -0.27331  0.27489 ) ph/cm2/s
Energy fluence (15-150 keV)             : 1.91448e-07 ( -2.42081e-08  2.41328e-08 ) ergs/cm2
Time-resolved spectra
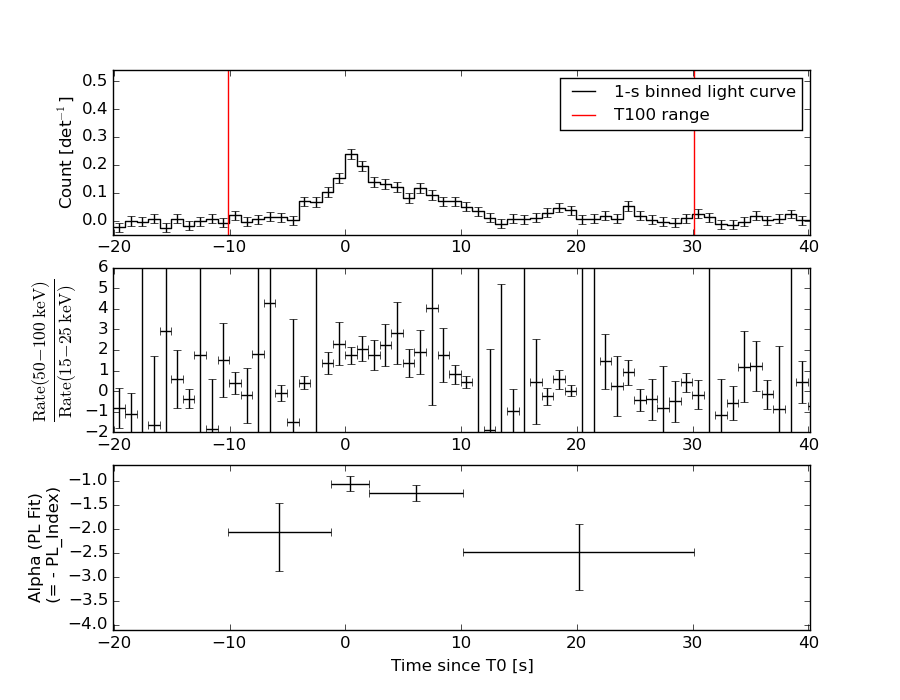
Distribution
T90 vs. Hardness ratio plot
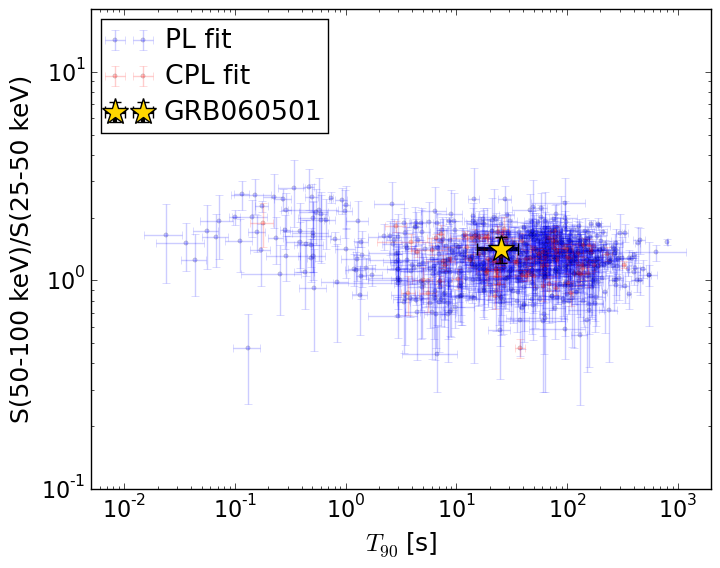
T90                                   = 25.628 sec.
Hardness ratio (energy fluence ratio) = 1.4148487997
S(15-50 keV) vs. S(50-150 keV) plot
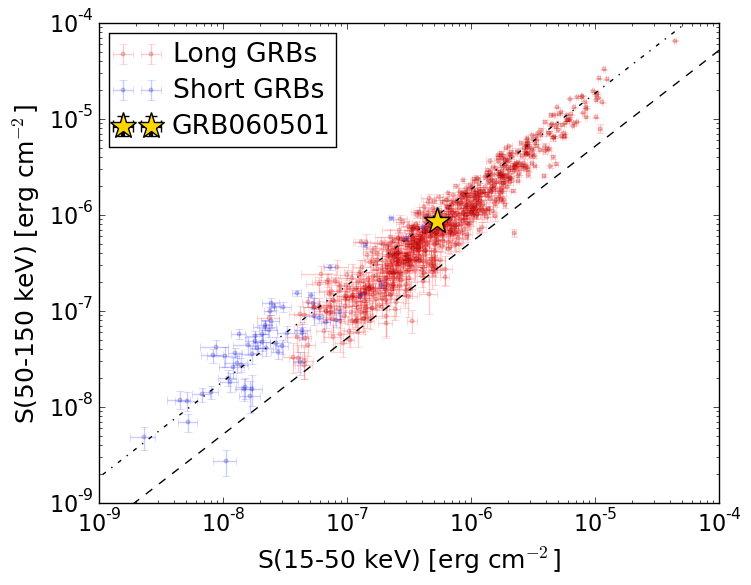
S(15-50 keV)  = 5.325977e-07
S(50-150 keV) = 8.626503e-07
The dash-dotted line and the dashed line traces the fluences calculated from the Band function with Epeak = 15 and 150 keV, respectively. Both lines assume a canonical values of alpha = -1 and beta = -2.5.
Mask shadow pattern
IMX = -1.084193585495419E+00, IMY = 1.863087079026394E-01
Spacecraft aspect plot
Bright source in the pre-burst/pre-slew/post-slew images
Pre-burst image of 15-350 keV band
Time interval of the image:
-204.531410 -10.116000

# RAcent  DECcent POSerr Theta    Phi  PeakCts   SNR AngSep     Name
#  [deg]    [deg]    ['] [deg]  [deg]                   [']
308.0740  40.9763    3.7  55.5  173.0  -2.2912  -3.2    2.2	Cyg X-3
326.1933  38.4692    4.5  43.9 -176.3   0.6152   2.6    8.9	Cyg X-2
330.4134   0.2673    3.0  19.4  120.7   0.6096   3.8 ------	UNKNOWN
  7.0632  44.8275    3.4  47.1 -132.8   1.7126   3.3 ------	UNKNOWN
 40.3599 -13.3735    4.2  51.9  -42.2   2.1821   2.7 ------	UNKNOWN
 39.4000 -11.2282    3.7  50.6  -44.7   2.4745   3.1 ------	UNKNOWN
Pre-slew background subtracted image of 15-350 keV band
Time interval of the image:
-10.116000 30.152000

# RAcent  DECcent POSerr Theta    Phi  PeakCts   SNR AngSep     Name
#  [deg]    [deg]    ['] [deg]  [deg]                   [']
308.1063  40.8830    8.5  55.4  172.9  -0.4333  -1.4    4.2	Cyg X-3
326.3366  38.3368    7.6  43.8 -176.3  -0.1539  -1.5    7.8	Cyg X-2
  7.4713 -27.0725    2.3  32.2   -0.0   0.3697   4.9 ------	UNKNOWN
 12.2701 -28.2507    2.8  35.7   -4.7   0.3336   4.1 ------	UNKNOWN
 26.6375 -41.3927    2.3  53.3   -3.6   0.9066   5.0 ------	UNKNOWN
328.3688  43.9999    0.7  47.7 -170.2   2.0547  17.6 ------	UNKNOWN
 36.3362 -35.4559    2.7  56.1  -14.9   1.0296   4.3 ------	UNKNOWN
 34.6312 -25.8687    2.1  50.5  -24.8   0.7965   5.4 ------	UNKNOWN
347.7961  53.4649    2.0  53.3 -150.9   1.2558   5.7 ------	UNKNOWN
Post-slew image of 15-350 keV band
Time interval of the image:
296.868600 963.088700

# RAcent  DECcent POSerr Theta    Phi  PeakCts   SNR AngSep     Name
#  [deg]    [deg]    ['] [deg]  [deg]                   [']
135.5314 -40.5438    0.3   9.9   93.6  11.5521  36.5    0.7	Vela X-1
170.0642 -60.6731   11.4  37.3  124.1  -0.8936  -1.0    8.0	Cen X-3
145.4657 -30.7092    2.3  19.2   56.8   1.7826   5.0 ------	UNKNOWN
144.2321   8.7224    3.0  49.8    7.2   3.3732   3.9 ------	UNKNOWN
128.3977 -15.8792    3.5  21.7   -7.3   1.1476   3.3 ------	UNKNOWN
126.6501  19.1022    5.2  56.3  -16.5   3.3894   2.2 ------	UNKNOWN