Analysis Summary
Notes:
- 1) No attempt has been made to eliminate the non-significant decimal places.
- 2) This batgrbproduct analysis is done using the HEASARC data.
- 3) This batgrbproduct analysis is using the flight position for the mask-weighting calculation.
======================================================================
BAT GRB EVENT DATA PROCESSING REPORT
Process Script Ver: batgrbproduct v2.46
Process Start Time: Wed Jun 24 18:36:01 EDT 2015
Host Name: bat1
Current Working Dir: /local/data/bat1/alien/Swift_3rdBATcatalog/event/batevent_reproc/trigger208169
======================================================================
Trigger: 00208169 Segment: 000
BAT Trigger Time: 168231813.312 [s; MET]
Trigger Stop: 168231814.336 [s; MET]
UTC: 2006-05-02T03:03:32.144320 [includes UTCF correction]
Where From?: TDRSS position message
BAT
RA: 240.857822844256 Dec: 66.5949806915925 [deg; J2000]
Catalogged Source?: NO
Point Source?: YES
GRB Indicated?: YES [ by BAT flight software ]
Image S/N Ratio: 12.69
Image Trigger?: NO
Rate S/N Ratio: 24.5560583156173 [ if not an image trigger ]
Image S/N Ratio: 12.69
Analysis Position: [ source = BAT ]
RA: 240.857822844256 Dec: 66.5949806915925 [deg; J2000]
Refined Position: [ source = BAT pre-slew burst ]
RA: 240.922839797869 Dec: 66.6032508130917 [deg; J2000]
{ 16h 03m 41.5s , +66d 36' 11.7" }
+/- 0.83881679747428 [arcmin] (estimated 90% radius based on SNR)
+/- 0.287361807740006 [arcmin] (formal 1-sigma fit error)
SNR: 39.0989732861164
Angular difference between the analysis and refined position is 1.626857 arcmin
Partial Coding Fraction: 0.4921875 [ including projection effects ]
Duration
T90: 28.4480000138283 +/- 9.86122264373695
Measured from: -3.71999999880791
to: 24.7280000150204 [s; relative to TRIGTIME]
T50: 10.660000026226 +/- 0.874720530519142
Measured from: 0.77199998497963
to: 11.4320000112057 [s; relative to TRIGTIME]
Fluence
Peak Flux (peak 1 second)
Measured from: -0.120000004768372
to: 0.879999995231628 [s; relative to TRIGTIME]
Total Fluence
Measured from: -5.64399999380112
to: 38.9839999973774 [s; relative to TRIGTIME]
Band 1 Band 2 Band 3 Band 4
15-25 25-50 50-100 100-350 keV
Total 0.818862 1.283236 1.058050 0.284004
0.046184 0.048230 0.041648 0.032582 [error]
Peak 0.031018 0.066998 0.087655 0.034737
0.007791 0.008302 0.008216 0.006213 [error]
[ fluence units of on-axis counts / fully illuminated detector ]
======================================================================
====== Table of the duration information =============================
Value tstart tstop
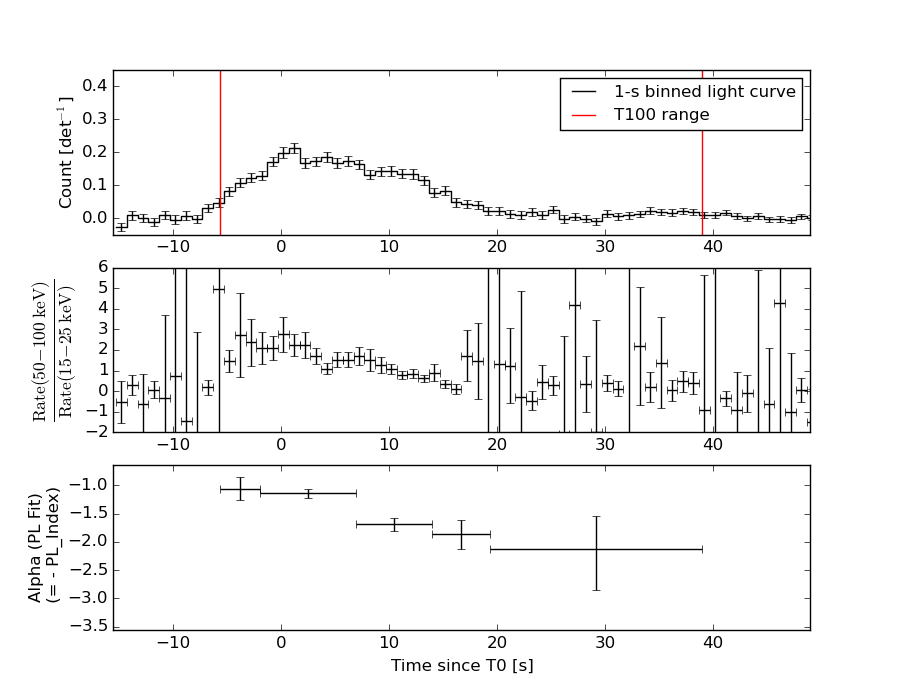
T100 44.628 -5.644 38.984
T90 28.448 -3.720 24.728
T50 10.660 0.772 11.432
Peak 1.000 -0.120 0.880
====== Spectral Analysis Summary =====================================
Model : spectral model: simple power-law (PL) and cutoff power-law (CPL)
Ph_index : photon index: E^{Ph_index}
Ph_90err : 90% error of the photon index
Epeak : Epeak in keV
Epeak_90err: 90% error of Epeak
Norm : normalization at 50 keV in both the PL model and CPL model
Nomr_90err : 90% error of the normalization
chi2 : Chi-Squared
dof : degree of freedo
=== Time-averaged spectral analysis ===
(Best model with acceptable fit: PL)
Model Ph_index Ph_90err_low Ph_90err_hi Epeak Epeak_90err_low Epeak_90err_hi Norm Nomr_90err_low Norm_90err_hi chi2 dof
PL -1.430 -0.073 0.073 - - - 5.44e-03 -2.26e-04 2.26e-04 43.910 57
CPL -1.119 -0.287 0.308 151.533 -50.062 800.880 7.65e-03 -2.02e-03 2.97e-03 40.460 56
=== 1-s peak spectral analysis ===
(Best model with acceptable fit: PL)
Model Ph_index Ph_90err_low Ph_90err_hi Epeak Epeak_90err_low Epeak_90err_hi Norm Nomr_90err_low Norm_90err_hi chi2 dof
PL -0.937 -0.198 0.206 - - - 1.51e-02 -1.79e-03 1.77e-03 52.110 57
CPL -0.846 -0.273 0.876 761.989 -761.989 -761.989 1.65e-02 -2.78e-03 2.09e-02 52.070 56
=== Fluence/Peak Flux Summary ===
Model Band1 Band2 Band3 Band4 Band5 Total
15-25 25-50 50-100 100-350 15-150 15-350 keV
Fluence PL 2.90e-07 5.57e-07 8.27e-07 2.64e-06 2.33e-06 4.32e-06 erg/cm2
90%_error_low -2.27e-08 -2.63e-08 -4.15e-08 -2.83e-07 -1.03e-07 -3.10e-07 erg/cm2
90%_error_hi 2.33e-08 2.62e-08 4.14e-08 3.05e-07 1.03e-07 3.28e-07 erg/cm2
Peak flux PL 3.63e-01 5.12e-01 5.35e-01 1.03e+00 1.73e+00 2.44e+00 ph/cm2/s
90%_error_low -8.74e-02 -7.93e-02 -6.31e-02 -2.43e-01 -2.07e-01 -2.95e-01 ph/cm2/s
90%_error_hi 9.57e-02 7.80e-02 6.27e-02 2.89e-01 2.08e-01 3.04e-01 ph/cm2/s
Fluence CPL 2.72e-07 5.72e-07 8.50e-07 1.73e-06 2.29e-06 3.42e-06 erg/cm2
90%_error_low -2.78e-08 -2.98e-08 -4.67e-08 -5.32e-07 -1.12e-07 -5.36e-07 erg/cm2
90%_error_hi 2.83e-08 3.02e-08 4.73e-08 8.25e-07 1.11e-07 8.16e-07 erg/cm2
Peak flux CPL 3.54e-01 5.14e-01 5.42e-01 9.39e-01 1.73e+00 2.35e+00 ph/cm2/s
90%_error_low -1.15e-01 -8.07e-02 -6.81e-02 -4.82e-01 -2.12e-01 -5.42e-01 ph/cm2/s
90%_error_hi 8.43e-02 8.14e-02 8.46e-02 1.84e-01 2.03e-01 3.67e-01 ph/cm2/s
======================================================================
Image
Pre-slew 15.0-350.0 keV image (Event data)
#   RAcent    DECcent   POSerr    Theta     Phi              Peak Cts       SNR   Name
  240.9228    66.6033   0.0049    34.9036  -131.7864         2.7730124     39.099 TRIG_00208169

Foreground time interval of the image:
 -5.644  11.389 (delta_t =  17.033 [sec])
Background time interval of the image:
-214.411  -5.644 (delta_t = 208.767 [sec])
Light Curves
Note: The mask-weighted lightcurves have units of either count/det or counts/sec/det, where a det is 0.4 x 0.4 = 0.16 sq cm.
Full-time range; 1 s binning
Other quick-look light curves:
- 64 ms binning (zoomed)
- 16 ms binning (zoomed)
- 8 ms binning (zoomed)
- 2 ms binning (zoomed)
- SN=5 or 10 s binning (full-time range)
- Raw light curve
Spectra
- 64 ms binning (zoomed)
- 16 ms binning (zoomed)
- 8 ms binning (zoomed)
- 2 ms binning (zoomed)
- SN=5 or 10 s binning (full-time range)
- Raw light curve
Spectra
Notes:
- 1) The fitting includes the systematic errors.
- 2) When the burst includes telescope slew time periods, the fitting uses an average response file made from multiple 5-s response files through out the slew time plus single time preiod for the non-slew times, and weighted by the total counts in the corresponding time period using addrmf. An average response file is needed becuase a spectral fit using the pre-slew DRM will introduce some errors in both a spectral shape and a normalization if the PHA file contains a lot of the slew/post-slew time interval.
- 3) For fits to more complicated models (e.g. a power-law over a cutoff power-law), the BAT team has decided to require a chi-square improvement of more than 6 for each extra dof.
Time averaged spectrum fit using the average DRM
Power-law model
Time interval is from   -5.644 sec. to   38.984 sec.

Spectral model in power-law:
------------------------------------------------------------
Parameters  : value       lower 90%   higher 90%
Photon index: -1.4296     ( -0.0732114   0.0734501 )
Norm@50keV  : 5.44215E-03    ( -0.000225624   0.000225615 )
------------------------------------------------------------
#Fit statistic : Chi-Squared =          43.91 using 59 PHA bins.
# Reduced chi-squared =         0.7703 for     57 degrees of freedom
# Null hypothesis probability =   8.982361e-01

Photon flux (15-150 keV)    in 44.63 sec: 0.667356 ( -0.0297  0.029768 ) ph/cm2/s
Energy fluence (15-150 keV)             : 2.33344e-06 ( -1.02915e-07  1.03176e-07 ) ergs/cm2
Cutoff power-law model
Time interval is from   -5.644 sec. to   38.984 sec.
Spectral model in the cutoff power-law:
------------------------------------------------------------
Parameters  : value       lower 90%   higher 90%
Photon index: -1.11875     ( -0.286698   0.307635 )
Epeak [keV] : 151.533      ( -50.0628 800.88 )
Norm@50keV  : 7.65234E-03    ( -0.00201859   0.00296819 )
------------------------------------------------------------
#Fit statistic : Chi-Squared =          40.46 using 59 PHA bins.
# Reduced chi-squared =         0.7225 for     56 degrees of freedom
# Null hypothesis probability =   9.414073e-01

Photon flux (15-150 keV)    in 44.63 sec: 0.656525 ( -0.031273  0.031313 ) ph/cm2/s
Energy fluence (15-150 keV)             : 2.28953e-06 ( -1.11637e-07  1.11107e-07 ) ergs/cm2
1-s peak spectrum fit
Power-law model
Time interval is from   -0.120 sec. to    0.880 sec.

Spectral model in power-law:
------------------------------------------------------------
Parameters  : value       lower 90%   higher 90%
Photon index: -0.937086     ( -0.198062   0.206425 )
Norm@50keV  : 1.51053E-02    ( -0.00179157   0.00177134 )
------------------------------------------------------------
#Fit statistic : Chi-Squared =          52.11 using 59 PHA bins.
# Reduced chi-squared =         0.9142 for     57 degrees of freedom
# Null hypothesis probability =   6.587642e-01

Photon flux (15-150 keV)    in 1 sec: 1.73480 ( -0.20673  0.20782 ) ph/cm2/s
Energy fluence (15-150 keV)             : 1.67155e-07 ( -1.98898e-08  1.99434e-08 ) ergs/cm2
Cutoff power-law model
Time interval is from   -0.120 sec. to    0.880 sec.
Spectral model in the cutoff power-law:
------------------------------------------------------------
Parameters  : value       lower 90%   higher 90%
Photon index: -0.845562     ( -0.273251   0.87617 )
Epeak [keV] : 761.989      ( -762.245 -762.245 )
Norm@50keV  : 1.65292E-02    ( -0.00278303   0.0209332 )
------------------------------------------------------------
#Fit statistic : Chi-Squared =          52.07 using 59 PHA bins.
# Reduced chi-squared =         0.9298 for     56 degrees of freedom
# Null hypothesis probability =   6.245034e-01

Photon flux (15-150 keV)    in 1 sec: 1.72928 ( -0.21177  0.20263 ) ph/cm2/s
Energy fluence (15-150 keV)             : 1.6674e-07 ( -2.03943e-08  2.00699e-08 ) ergs/cm2
Time-resolved spectra
Distribution
T90 vs. Hardness ratio plot
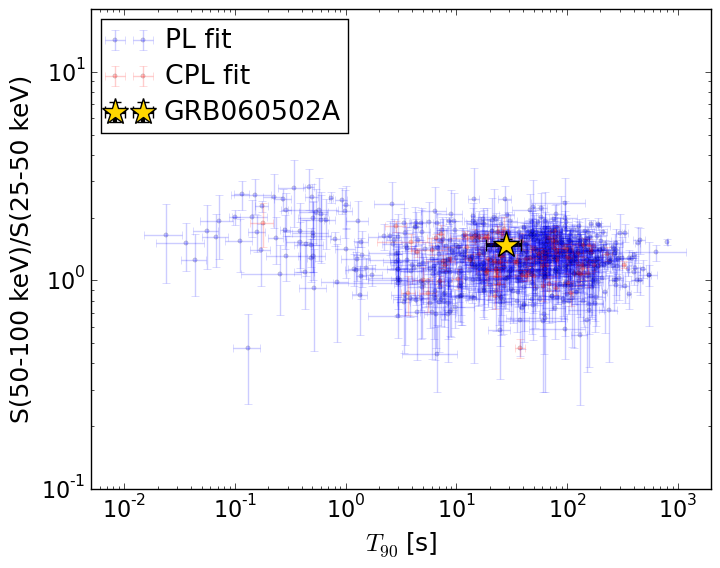
T90                                   = 28.448 sec.
Hardness ratio (energy fluence ratio) = 1.48497790353
S(15-50 keV) vs. S(50-150 keV) plot
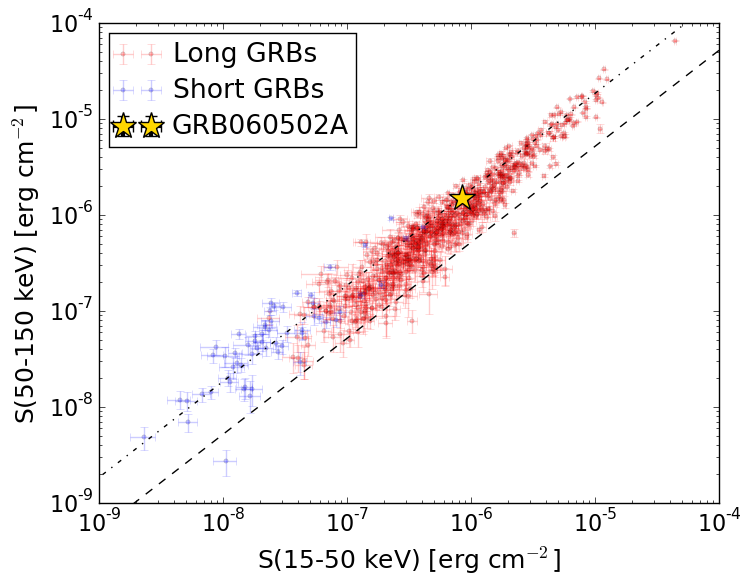
S(15-50 keV)  = 8.473295e-07
S(50-150 keV) = 1.4861344e-06
The dash-dotted line and the dashed line traces the fluences calculated from the Band function with Epeak = 15 and 150 keV, respectively. Both lines assume a canonical values of alpha = -1 and beta = -2.5.
Mask shadow pattern
IMX = -4.649187605341465E-01, IMY = 5.202310314464613E-01
Spacecraft aspect plot
Bright source in the pre-burst/pre-slew/post-slew images
Pre-burst image of 15-350 keV band
Time interval of the image:
-214.411400 -5.644000

# RAcent  DECcent POSerr Theta    Phi  PeakCts   SNR AngSep     Name
#  [deg]    [deg]    ['] [deg]  [deg]                   [']
254.4531  35.3365    0.8   2.7 -131.7   2.0461  13.7    0.4	Her X-1
268.4312  -1.5394    8.2  36.5   35.0   0.3786   1.4    6.4	SW J1753.5-0127
288.8058  10.9268    0.9  37.9   -4.8   2.7933  12.3    1.2	GRS 1915+105
299.5967  35.2001    0.3  36.8  -48.6   8.5765  34.7    0.3	Cyg X-1
308.0142  40.7732    6.8  42.6  -58.7  -0.8280  -1.7   11.6	Cyg X-3
180.8074  51.8358    2.7  55.5 -168.3   2.2940   4.3 ------	UNKNOWN
227.8944  62.4154    2.6  34.3 -144.0   0.9266   4.5 ------	UNKNOWN
295.8252  65.8005    3.5  41.1  -98.0   2.4990   3.3 ------	UNKNOWN
Pre-slew background subtracted image of 15-350 keV band
Time interval of the image:
-5.644000 11.388600

# RAcent  DECcent POSerr Theta    Phi  PeakCts   SNR AngSep     Name
#  [deg]    [deg]    ['] [deg]  [deg]                   [']
254.7100  35.3896    7.8   2.7 -127.1   0.0590   1.5   12.7	Her X-1
268.3293  -1.5814    7.8  36.5   35.1  -0.1093  -1.5    8.1	SW J1753.5-0127
288.8042  10.9510   59.6  37.9   -4.8  -0.0116  -0.2    0.5	GRS 1915+105
299.5033  35.2510   77.7  36.7  -48.7   0.0103   0.1    5.2	Cyg X-1
308.2260  40.8637    8.2  42.7  -58.9  -0.2079  -1.4    7.5	Cyg X-3
271.1077   5.5079    2.4  31.1   25.6   0.2776   4.8 ------	UNKNOWN
186.7048  45.3496    2.1  52.9 -177.0   0.6435   5.4 ------	UNKNOWN
299.7808   2.9171    2.2  51.4   -6.3   0.5512   5.3 ------	UNKNOWN
240.9229  66.6032    0.3  34.9 -131.8   2.7729  39.1 ------	UNKNOWN
Post-slew image of 15-350 keV band
Time interval of the image:
65.188600 535.988600

# RAcent  DECcent POSerr Theta    Phi  PeakCts   SNR AngSep     Name
#  [deg]    [deg]    ['] [deg]  [deg]                   [']
254.4355  35.3577    1.0  32.2   48.0   4.9536  11.8    1.4	Her X-1
299.5985  35.2044    0.3  45.8   -8.1  16.9574  35.4    0.4	Cyg X-1
308.1543  41.1145    7.4  44.0  -20.5  -0.7067  -1.6    9.9	Cyg X-3
326.1550  38.3479    6.8  53.5  -34.5   2.1003   1.7    1.8	Cyg X-2
131.6316  41.8038    3.1  59.1 -166.2   9.3776   3.7 ------	UNKNOWN
343.2379  74.7274    4.2  30.4  -80.4   1.1816   2.8 ------	UNKNOWN
318.8689  28.9381    2.8  58.9  -22.7   7.0234   4.1 ------	UNKNOWN
 99.8254  59.1959    3.7  51.0 -135.5   5.5426   3.2 ------	UNKNOWN