Analysis Summary
Notes:
- 1) No attempt has been made to eliminate the non-significant decimal places.
- 2) This batgrbproduct analysis is done using the HEASARC data.
- 3) This batgrbproduct analysis is using the flight position for the mask-weighting calculation.
======================================================================
BAT GRB EVENT DATA PROCESSING REPORT
Process Script Ver: batgrbproduct v2.46
Process Start Time: Wed Jan 22 16:43:47 EST 2014
Host Name: batevent1
Current Working Dir: /local/data/batevent/batevent_reproc/trigger208275
======================================================================
Trigger: 00208275 Segment: 000
BAT Trigger Time: 168283482.204 [s; MET]
Trigger Stop: 168283482.268 [s; MET]
UTC: 2006-05-02T17:24:41.035100 [includes UTCF correction]
Where From?: (*SHORT BURST*) TDRSS scaled map message
BAT
RA: 278.935719107924 Dec: 52.6321691479945 [deg; J2000]
Catalogged Source?: NO
Point Source?: YES
GRB Indicated?: YES [ by BAT flight software ]
Image S/N Ratio: 11.47
Image Trigger?: NO
Rate S/N Ratio: 32.9696830436691 [ if not an image trigger ]
Image S/N Ratio: 11.47
Analysis Position: [ source = BAT ]
RA: 278.935719107924 Dec: 52.6321691479945 [deg; J2000]
Refined Position: [ source = BAT pre-slew burst ]
RA: 278.961492631607 Dec: 52.6269420502663 [deg; J2000]
{ 18h 35m 50.8s , +52d 37' 37.0" }
+/- 1.75428350816523 [arcmin] (estimated 90% radius based on SNR)
+/- 0.708716180793054 [arcmin] (formal 1-sigma fit error)
SNR: 13.6271302706973
Angular difference between the analysis and refined position is 0.989630 arcmin
Partial Coding Fraction: 0.921875 [ including projection effects ]
Duration
T90: 0.143999993801117 +/- 0.0505964225831327
Measured from: -0.00400000810623169
to: 0.139999985694885 [s; relative to TRIGTIME]
T50: 0.0479999780654907 +/- 0.0160000026226044
Measured from: 0.0119999945163727
to: 0.0599999725818634 [s; relative to TRIGTIME]
Fluence
Peak Flux (peak 1 second)
Measured from: -0.407999992370605
to: 0.592000007629395 [s; relative to TRIGTIME]
Total Fluence
Measured from: -0.00400000810623169
to: 0.171999990940094 [s; relative to TRIGTIME]
Band 1 Band 2 Band 3 Band 4
15-25 25-50 50-100 100-350 keV
Total 0.009132 0.023403 0.026429 0.008236
0.002475 0.002833 0.002766 0.002246 [error]
Peak 0.011024 0.022911 0.032944 0.017131
0.005164 0.005578 0.004995 0.004490 [error]
[ fluence units of on-axis counts / fully illuminated detector ]
======================================================================
====== Table of the duration information =============================
Value tstart tstop
T100 0.176 -0.004 0.172
T90 0.144 -0.004 0.140
T50 0.048 0.012 0.060
Peak 1.000 -0.408 0.592
====== Spectral Analysis Summary =====================================
Model : spectral model: simple power-law (PL) and cutoff power-law (CPL)
Ph_index : photon index: E^{Ph_index}
Ph_90err : 90% error of the photon index
Epeak : Epeak in keV
Epeak_90err: 90% error of Epeak
Norm : normalization at 50 keV in both the PL model and CPL model
Nomr_90err : 90% error of the normalization
chi2 : Chi-Squared
dof : degree of freedo
=== Time-averaged spectral analysis ===
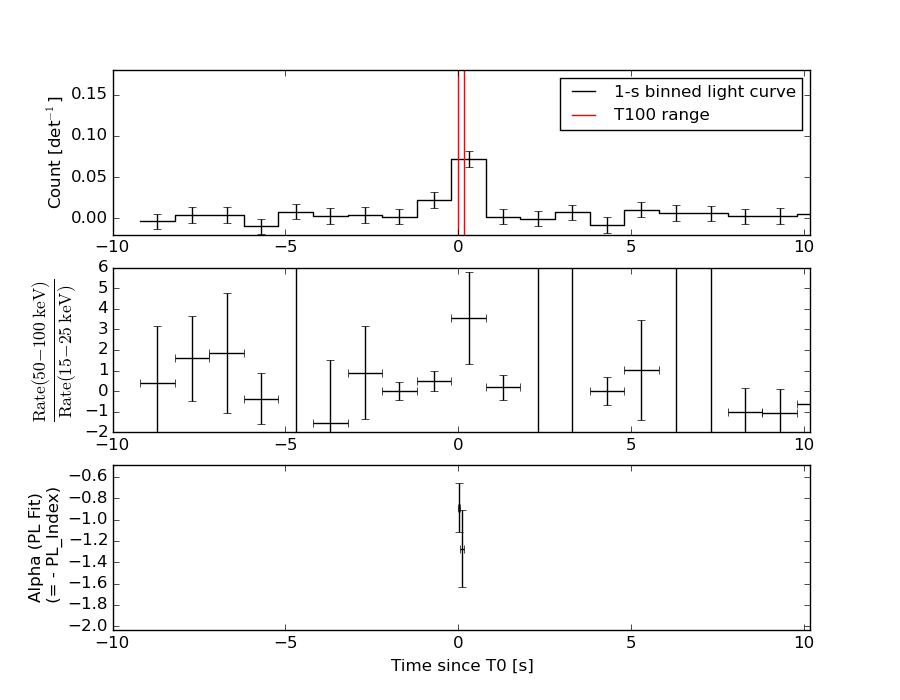
(Best model with acceptable fit: PL)
Model Ph_index Ph_90err_low Ph_90err_hi Epeak Epeak_90err_low Epeak_90err_hi Norm Nomr_90err_low Norm_90err_hi chi2 dof
PL -0.985 -0.198 0.205 - - - 2.57e-02 -3.14e-03 3.14e-03 56.960 57
CPL -0.105 -0.887 1.178 117.949 -39.490 -117.949 6.62e-02 -4.08e-02 1.57e-01 54.260 56
=== 1-s peak spectral analysis ===
(Best model with acceptable fit: PL)
Model Ph_index Ph_90err_low Ph_90err_hi Epeak Epeak_90err_low Epeak_90err_hi Norm Nomr_90err_low Norm_90err_hi chi2 dof
PL -0.815 -0.342 0.379 - - - 5.35e-03 -1.12e-03 1.09e-03 65.160 57
CPL -0.401 -0.696 2.105 231.430 -231.430 -231.430 8.01e-03 -3.64e-03 4.71e-02 64.940 56
=== Fluence/Peak Flux Summary ===
Model Band1 Band2 Band3 Band4 Band5 Total
15-25 25-50 50-100 100-350 15-150 15-350 keV
Fluence PL 3.57e-09 9.01e-09 1.82e-08 9.26e-08 4.92e-08 1.23e-07 erg/cm2
90%_error_low -8.16e-10 -1.32e-09 -2.45e-09 -2.47e-08 -6.45e-09 -2.65e-08 erg/cm2
90%_error_hi 8.75e-10 1.30e-09 2.43e-09 3.05e-08 6.49e-09 3.14e-08 erg/cm2
Peak flux PL 1.15e-01 1.74e-01 1.98e-01 4.29e-01 6.15e-01 9.15e-01 ph/cm2/s
90%_error_low -4.73e-02 -4.84e-02 -3.89e-02 -1.61e-01 -1.24e-01 -1.91e-01 ph/cm2/s
90%_error_hi 5.63e-02 4.73e-02 3.86e-02 2.24e-01 1.25e-01 2.11e-01 ph/cm2/s
Fluence CPL 2.96e-09 9.72e-09 1.98e-08 3.18e-08 4.67e-08 6.43e-08 erg/cm2
90%_error_low -1.00e-09 -1.56e-09 -2.96e-09 -1.95e-08 -7.27e-09 -2.03e-08 erg/cm2
90%_error_hi 1.06e-09 1.63e-09 3.05e-09 6.23e-08 7.12e-09 6.03e-08 erg/cm2
Peak flux CPL 1.01e-01 1.76e-01 2.08e-01 2.88e-01 6.04e-01 7.74e-01 ph/cm2/s
90%_error_low -6.09e-02 -5.12e-02 -4.66e-02 -2.88e-01 -1.31e-01 -2.64e-01 ph/cm2/s
90%_error_hi 6.65e-02 5.17e-02 5.32e-02 1.92e-01 1.28e-01 2.87e-01 ph/cm2/s
======================================================================
Image
Pre-slew 15.0-350.0 keV image (Event data)
#   RAcent    DECcent   POSerr    Theta     Phi              Peak Cts       SNR   Name
  278.9615    52.6269   0.0142    23.1736    -2.2798         0.0691768     13.627 TRIG_00208275

Foreground time interval of the image:
 -0.004   0.172 (delta_t =   0.176 [sec])
Background time interval of the image:
-239.204  -0.004 (delta_t = 239.200 [sec])
Light Curves
Note: The mask-weighted lightcurves have units of either count/det or counts/sec/det, where a det is 0.4 x 0.4 = 0.16 sq cm.
Full-time range; 1 s binning
Other quick-look light curves:
- 64 ms binning (zoomed)
- 16 ms binning (zoomed)
- 8 ms binning (zoomed)
- 2 ms binning (zoomed)
- SN=5 or 10 s binning (full-time range)
- Raw light curve
Spectra
- 64 ms binning (zoomed)
- 16 ms binning (zoomed)
- 8 ms binning (zoomed)
- 2 ms binning (zoomed)
- SN=5 or 10 s binning (full-time range)
- Raw light curve
Spectra
Notes:
- 1) The fitting includes the systematic errors.
- 2) When the burst includes telescope slew time periods, the fitting uses an average response file made from multiple 5-s response files through out the slew time plus single time preiod for the non-slew times, and weighted by the total counts in the corresponding time period using addrmf. An average response file is needed becuase a spectral fit using the pre-slew DRM will introduce some errors in both a spectral shape and a normalization if the PHA file contains a lot of the slew/post-slew time interval.
- 3) For fits to more complicated models (e.g. a power-law over a cutoff power-law), the BAT team has decided to require a chi-square improvement of more than 6 for each extra dof.
Time averaged spectrum fit using the average DRM
Power-law model
Time interval is from   -0.004 sec. to    0.172 sec.

Spectral model in power-law:
------------------------------------------------------------
Parameters  : value       lower 90%   higher 90%
Photon index: -0.984509     ( -0.197722   0.205259 )
Norm@50keV  : 2.56841E-02    ( -0.00314486   0.00313586 )
------------------------------------------------------------
#Fit statistic : Chi-Squared =          56.96 using 59 PHA bins.
# Reduced chi-squared =         0.9993 for     57 degrees of freedom
# Null hypothesis probability =   4.766408e-01

Photon flux (15-150 keV)    in 0.176 sec: 2.95473 ( -0.36602  0.36674 ) ph/cm2/s
Energy fluence (15-150 keV)             : 4.91579e-08 ( -6.44952e-09  6.48926e-09 ) ergs/cm2
Cutoff power-law model
Time interval is from   -0.004 sec. to    0.172 sec.
Spectral model in the cutoff power-law:
------------------------------------------------------------
Parameters  : value       lower 90%   higher 90%
Photon index: -0.105205     ( -0.886987   1.17757 )
Epeak [keV] : 117.949      ( -39.4884 -117.948 )
Norm@50keV  : 6.61776E-02    ( -0.0407555   0.157348 )
------------------------------------------------------------
#Fit statistic : Chi-Squared =          54.26 using 59 PHA bins.
# Reduced chi-squared =         0.9688 for     56 degrees of freedom
# Null hypothesis probability =   5.411845e-01

Photon flux (15-150 keV)    in 0.176 sec: 2.87306 ( -0.38053  0.37854 ) ph/cm2/s
Energy fluence (15-150 keV)             : 4.67211e-08 ( -7.26972e-09  7.12476e-09 ) ergs/cm2
1-s peak spectrum fit
Power-law model
Time interval is from   -0.408 sec. to    0.592 sec.

Spectral model in power-law:
------------------------------------------------------------
Parameters  : value       lower 90%   higher 90%
Photon index: -0.81469     ( -0.342204   0.378748 )
Norm@50keV  : 5.35001E-03    ( -0.00112329   0.00109114 )
------------------------------------------------------------
#Fit statistic : Chi-Squared =          65.16 using 59 PHA bins.
# Reduced chi-squared =          1.143 for     57 degrees of freedom
# Null hypothesis probability =   2.141249e-01

Photon flux (15-150 keV)    in 1 sec: 0.614591 ( -0.123743  0.124867 ) ph/cm2/s
Energy fluence (15-150 keV)             : 6.21427e-08 ( -1.24903e-08  1.25761e-08 ) ergs/cm2
Cutoff power-law model
Time interval is from   -0.408 sec. to    0.592 sec.
Spectral model in the cutoff power-law:
------------------------------------------------------------
Parameters  : value       lower 90%   higher 90%
Photon index: -0.400811     ( -0.697057   2.10383 )
Epeak [keV] : 231.430      ( -230.764 -230.764 )
Norm@50keV  : 8.00821E-03    ( -0.00365104   0.0470928 )
------------------------------------------------------------
#Fit statistic : Chi-Squared =          64.94 using 59 PHA bins.
# Reduced chi-squared =          1.160 for     56 degrees of freedom
# Null hypothesis probability =   1.933528e-01

Photon flux (15-150 keV)    in 1 sec: 0.603705 ( -0.13115  0.127525 ) ph/cm2/s
Energy fluence (15-150 keV)             : 6.09495e-08 ( -1.39655e-08  1.32259e-08 ) ergs/cm2
Time-resolved spectra
Distribution
T90 vs. Hardness ratio plot
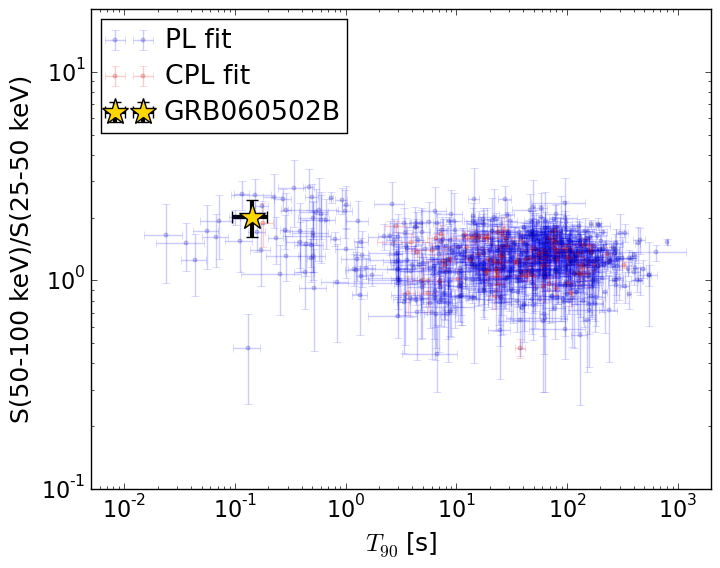
T90                                   = 0.144 sec.
Hardness ratio (energy fluence ratio) = 2.02162380414
S(15-50 keV) vs. S(50-150 keV) plot
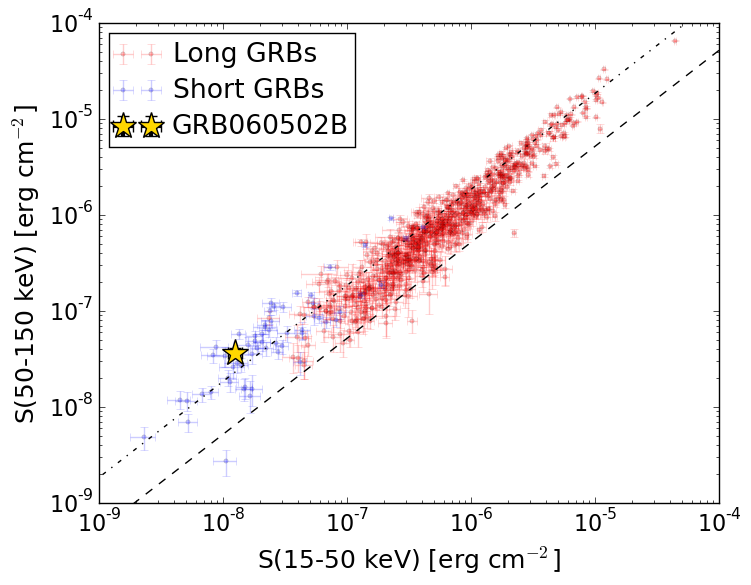
S(15-50 keV)  = 1.2579953e-08
S(50-150 keV) = 3.65777e-08
The dash-dotted line and the dashed line traces the fluences calculated from the Band function with Epeak = 15 and 150 keV, respectively. Both lines assume a canonical values of alpha = -1 and beta = -2.5.
Mask shadow pattern
IMX = 4.277172360753796E-01, IMY = 1.702765592760256E-02
Spacecraft aspect plot
Bright source in the pre-burst/pre-slew/post-slew images
Pre-burst image of 15-350 keV band
Time interval of the image:
-239.204000 -0.004000

# RAcent  DECcent POSerr Theta    Phi  PeakCts   SNR AngSep     Name
#  [deg]    [deg]    ['] [deg]  [deg]                   [']
254.5182  35.3604    2.0  32.2   48.5   1.7895   5.9    3.2	Her X-1
299.5934  35.1977    0.5  45.7   -7.5   7.6849  23.4    0.3	Cyg X-1
308.2401  41.1354    0.0  44.0  -20.1  -0.3293  -1.1   12.4	Cyg X-3
326.2671  38.1966    0.0  53.6  -33.9   0.4770   0.5    8.8	Cyg X-2
 14.8768  68.8429    3.1  40.9  -87.1   3.2845   3.7 ------	UNKNOWN
Pre-slew background subtracted image of 15-350 keV band
Time interval of the image:
-0.004000 0.172000

# RAcent  DECcent POSerr Theta    Phi  PeakCts   SNR AngSep     Name
#  [deg]    [deg]    ['] [deg]  [deg]                   [']
254.4158  35.2768   11.4  32.3   48.6   0.0088   1.0    4.4	Her X-1
299.7345  35.1788   14.1  45.8   -7.6  -0.0075  -0.8    7.2	Cyg X-1
307.9743  40.8321  152.1  44.2  -19.6   0.0007   0.1    9.5	Cyg X-3
326.2043  38.2853   30.7  53.5  -33.9  -0.0080  -0.4    2.7	Cyg X-2
278.9615  52.6269    0.8  23.2   -2.3   0.0692  13.6 ------	UNKNOWN
139.8548  43.8415    2.6  54.5 -170.9   0.0651   4.4 ------	UNKNOWN
Post-slew image of 15-350 keV band
Time interval of the image:
54.496590 962.846800

# RAcent  DECcent POSerr Theta    Phi  PeakCts   SNR AngSep     Name
#  [deg]    [deg]    ['] [deg]  [deg]                   [']
254.4447  35.3133    0.9  24.5   88.6   8.5507  12.3    1.9	Her X-1
288.8186  10.9581    1.1  42.4   19.4  10.2839  10.8    1.4	GRS 1915+105
299.5900  35.2024    0.2  22.7  -14.4  32.8112  66.3    0.1	Cyg X-1
307.9242  40.9284    5.9  22.8  -37.0   0.9911   2.0    8.6	Cyg X-3
326.1975  38.3245    4.3  35.3  -51.6   1.9256   2.7    1.2	Cyg X-2
254.8539  26.6079    2.6  31.6   77.9   4.1894   4.4 ------	UNKNOWN
140.6897  63.8636    3.2  59.1 -166.2  14.1297   3.7 ------	UNKNOWN
106.7038  80.0343    2.9  47.3 -148.0   4.6771   3.9 ------	UNKNOWN