Analysis Summary
Notes:
- 1) No attempt has been made to eliminate the non-significant decimal places.
- 2) This batgrbproduct analysis is done using the HEASARC data.
- 3) This batgrbproduct analysis is using the flight position for the mask-weighting calculation.
======================================================================
                  BAT GRB EVENT DATA PROCESSING REPORT
    Process Script Ver: batgrbproduct v2.46
    Process Start Time: Wed Jan 22 16:39:19 EST 2014
             Host Name: batevent1
   Current Working Dir: /local/data/batevent/batevent_reproc/trigger208870
======================================================================

  Trigger: 00208870      Segment: 000

  BAT Trigger Time: 168659593.408   [s; MET]
      Trigger Stop: 168659594.432   [s; MET]
               UTC: 2006-05-07T01:53:12.230320    [includes UTCF correction]
       Where From?: TDRSS position message

  BAT
    RA: 89.9718765738037   Dec: 75.2369661619308  [deg; J2000]

     Catalogged Source?: NO
     Point Source?:      YES
     GRB Indicated?:     YES    [ by BAT flight software ]
     Image S/N Ratio:    7.19
     Image Trigger?:     NO
     Rate S/N Ratio:     13.9283882771841  [ if not an image trigger ]
     Image S/N Ratio:    7.19

  Analysis Position:   [ source = BAT ]
    RA: 89.9718765738037   Dec: 75.2369661619308  [deg; J2000]

  Refined Position:   [ source = BAT pre-slew burst ]
    RA: 89.9170795434187   Dec: 75.2445670373931  [deg; J2000]
        { 05h 59m 40.1s , +75d 14' 40.4" }
         +/- 1.16688567696737 [arcmin] (estimated 90% radius based on SNR)
         +/- 0.356029995276097 [arcmin] (formal 1-sigma fit error)
    SNR: 24.3985295294464

  Angular difference between the analysis and refined position is 0.953706 arcmin

  Partial Coding Fraction: 0.328125    [ including projection effects ]

  Duration
     T90: 183.307999998331 +/- 6.56904864953299
        Measured from: -3.47599998116493
                   to: 179.832000017166     [s; relative to TRIGTIME]
     T50: 114.351999998093 +/- 7.59182822267909
        Measured from: 13.9080000221729
                   to: 128.260000020266     [s; relative to TRIGTIME]


  Fluence
     Peak Flux  (peak 1 second)
        Measured from: 1.24400001764297
                   to: 2.24400001764297     [s; relative to TRIGTIME]
     Total Fluence
        Measured from: -11.0239999890327
                   to: 192.351999998093     [s; relative to TRIGTIME]

             Band 1     Band 2     Band 3     Band 4
              15-25      25-50     50-100    100-350     keV
 Total     2.561571   2.946703   1.841847   0.393402
           0.107108   0.113480   0.099974   0.084487 [error]
 Peak      0.048339   0.051640   0.042969   0.005518
           0.008201   0.008814   0.008155   0.006240 [error]

     [ fluence units of on-axis counts / fully illuminated detector ]

======================================================================


====== Table of the duration information =============================

        Value   tstart    tstop
T100  203.376  -11.024  192.352
T90   183.308   -3.476  179.832
T50   114.352   13.908  128.260
Peak    1.000    1.244    2.244


====== Spectral Analysis Summary =====================================

Model      : spectral model: simple power-law (PL) and cutoff power-law (CPL)
Ph_index   : photon index: E^{Ph_index}
Ph_90err   : 90% error of the photon index
Epeak      : Epeak in keV
Epeak_90err: 90% error of Epeak
Norm       : normalization at 50 keV in both the PL model and CPL model
Nomr_90err : 90% error of the normalization
chi2       : Chi-Squared
dof        : degree of freedo

=== Time-averaged spectral analysis ===
(Best model with acceptable fit: PL)

Model Ph_index Ph_90err_low Ph_90err_hi  Epeak  Epeak_90err_low  Epeak_90err_hi  Norm       Nomr_90err_low    Norm_90err_hi    chi2    dof
PL      -1.807    -0.086      0.085       -           -               -         2.41e-03     -1.20e-04          1.20e-04      56.540   57
CPL     -1.445    -0.335      0.364       72.423     -16.446       216.286      3.74e-03     -1.21e-03          2.02e-03      53.110   56


=== 1-s peak spectral analysis ===
(Best model with acceptable fit: PL)

Model Ph_index Ph_90err_low Ph_90err_hi  Epeak  Epeak_90err_low  Epeak_90err_hi  Norm       Nomr_90err_low    Norm_90err_hi    chi2    dof
PL      -1.664     -0.286     0.271       -           -               -         9.83e-03     -1.80e-03          1.76e-03      52.780   57
CPL     -0.937     -0.602     1.477       68.114     -35.691       -68.114      2.43e-02     -2.43e-02          1.24e-01      51.610   56


=== Fluence/Peak Flux Summary ===

              Model    Band1     Band2     Band3     Band4     Band5     Total
                       15-25     25-50    50-100    100-350    15-150    15-350    keV
Fluence         PL   8.37e-07  1.28e-06  1.46e-06  3.18e-06  4.52e-06  6.75e-06   erg/cm2
      90%_error_low -6.31e-08 -5.95e-08 -9.86e-08 -4.31e-07 -2.29e-07 -5.20e-07   erg/cm2
      90%_error_hi   6.45e-08  5.94e-08  9.87e-08  4.75e-07  2.31e-07  5.53e-07   erg/cm2
Peak flux       PL   4.73e-01  4.32e-01  2.73e-01  2.64e-01  1.29e+00  1.44e+00   ph/cm2/s
      90%_error_low -1.15e-01 -7.18e-02 -6.33e-02 -1.03e-01 -2.12e-01 -2.41e-01   ph/cm2/s
      90%_error_hi   1.21e-01  7.16e-02  6.29e-02  1.34e-01  2.12e-01  2.43e-01   ph/cm2/s

Fluence        CPL   8.53e-07  1.16e-06  1.22e-06  2.83e-06  3.99e-06  5.99e-06   erg/cm2
      90%_error_low -7.03e-08 -1.09e-07 -1.09e-07 -1.70e-06 -3.91e-07 -4.51e-07   erg/cm2
      90%_error_hi   5.40e-08  5.04e-08  8.85e-08  2.13e-07  1.47e-07  3.88e-07   erg/cm2
Peak flux      CPL   4.30e-01  4.71e-01  2.85e-01  1.17e-01  1.26e+00  1.30e+00   ph/cm2/s
      90%_error_low -1.38e-01 -9.26e-02 -7.14e-02 -1.17e-01 -2.17e-01 -2.42e-01   ph/cm2/s
      90%_error_hi   1.38e-01  9.79e-02  7.28e-02  1.88e-01  2.16e-01  3.10e-01   ph/cm2/s

======================================================================
Image
Pre-slew 15.0-350.0 keV image (Event data)
#   RAcent    DECcent   POSerr    Theta     Phi              Peak Cts       SNR   Name
   89.9171    75.2446   0.0079    32.6125   -84.7124         6.7780321     24.399 TRIG_00208870

Foreground time interval of the image:
-11.024 171.693 (delta_t = 182.717 [sec])
Background time interval of the image:
-239.408 -11.024 (delta_t = 228.384 [sec])
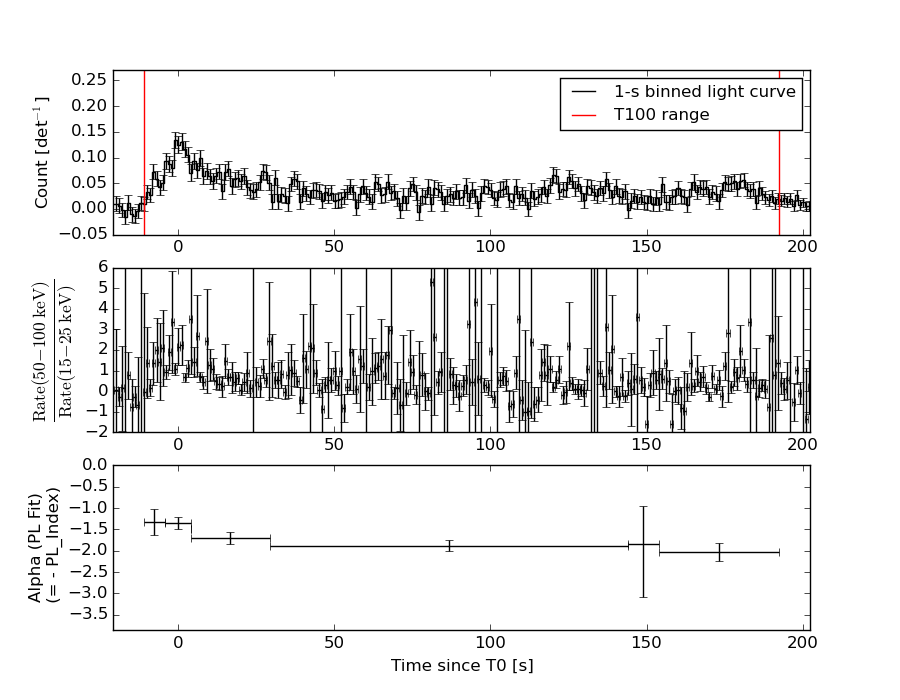
Light Curves
Note: The mask-weighted lightcurves have units of either count/det or counts/sec/det, where a det is 0.4 x 0.4 = 0.16 sq cm.
Full-time range; 1 s binning
Other quick-look light curves:
- 64 ms binning (zoomed)
- 16 ms binning (zoomed)
- 8 ms binning (zoomed)
- 2 ms binning (zoomed)
- SN=5 or 10 s binning (full-time range)
- Raw light curve
Spectra
- 64 ms binning (zoomed)
- 16 ms binning (zoomed)
- 8 ms binning (zoomed)
- 2 ms binning (zoomed)
- SN=5 or 10 s binning (full-time range)
- Raw light curve
Spectra
Notes:
- 1) The fitting includes the systematic errors.
- 2) When the burst includes telescope slew time periods, the fitting uses an average response file made from multiple 5-s response files through out the slew time plus single time preiod for the non-slew times, and weighted by the total counts in the corresponding time period using addrmf. An average response file is needed becuase a spectral fit using the pre-slew DRM will introduce some errors in both a spectral shape and a normalization if the PHA file contains a lot of the slew/post-slew time interval.
- 3) For fits to more complicated models (e.g. a power-law over a cutoff power-law), the BAT team has decided to require a chi-square improvement of more than 6 for each extra dof.
Time averaged spectrum fit using the average DRM
Power-law model
Time interval is from  -11.024 sec. to  192.352 sec.

Spectral model in power-law:
------------------------------------------------------------
Parameters  : value       lower 90%   higher 90%
Photon index: -1.80731     ( -0.086164   0.0850524 )
Norm@50keV  : 2.41326E-03    ( -0.000120432   0.000119689 )
------------------------------------------------------------
#Fit statistic : Chi-Squared =          56.54 using 59 PHA bins.
# Reduced chi-squared =         0.9920 for     57 degrees of freedom
# Null hypothesis probability =   4.921891e-01

Photon flux (15-150 keV)    in 203.4 sec: 0.333506 ( -0.015893  0.015921 ) ph/cm2/s
Energy fluence (15-150 keV)             : 4.51847e-06 ( -2.29224e-07  2.30517e-07 ) ergs/cm2
Cutoff power-law model
Time interval is from  -11.024 sec. to  192.352 sec.
Spectral model in the cutoff power-law:
------------------------------------------------------------
Parameters  : value       lower 90%   higher 90%
Photon index: -1.44502     ( -0.334836   0.364359 )
Epeak [keV] : 72.4230      ( -16.446 216.286 )
Norm@50keV  : 3.73635E-03    ( -0.00121314   0.00201607 )
------------------------------------------------------------
#Fit statistic : Chi-Squared =          53.11 using 59 PHA bins.
# Reduced chi-squared =         0.9483 for     56 degrees of freedom
# Null hypothesis probability =   5.851219e-01

Photon flux (15-150 keV)    in 203.4 sec: 0.326674 ( -0.017057  0.017061 ) ph/cm2/s
Energy fluence (15-150 keV)             : 3.98511e-06 ( -3.90512e-07  1.46511e-07 ) ergs/cm2
1-s peak spectrum fit
Power-law model
Time interval is from    1.244 sec. to    2.244 sec.

Spectral model in power-law:
------------------------------------------------------------
Parameters  : value       lower 90%   higher 90%
Photon index: -1.66395     ( -0.285897   0.270811 )
Norm@50keV  : 9.82698E-03    ( -0.00179843   0.00175761 )
------------------------------------------------------------
#Fit statistic : Chi-Squared =          52.78 using 59 PHA bins.
# Reduced chi-squared =         0.9259 for     57 degrees of freedom
# Null hypothesis probability =   6.341612e-01

Photon flux (15-150 keV)    in 1 sec: 1.28918 ( -0.21182  0.21189 ) ph/cm2/s
Energy fluence (15-150 keV)             : 9.1283e-08 ( -1.74195e-08  1.7738e-08 ) ergs/cm2
Cutoff power-law model
Time interval is from    1.244 sec. to    2.244 sec.
Spectral model in the cutoff power-law:
------------------------------------------------------------
Parameters  : value       lower 90%   higher 90%
Photon index: -0.937324     ( -0.601563   1.47665 )
Epeak [keV] : 68.1139      ( -35.6903 -68.1138 )
Norm@50keV  : 2.42502E-02    ( -0.0242503   0.123548 )
------------------------------------------------------------
#Fit statistic : Chi-Squared =          51.61 using 59 PHA bins.
# Reduced chi-squared =         0.9217 for     56 degrees of freedom
# Null hypothesis probability =   6.414745e-01

Photon flux (15-150 keV)    in 1 sec: 1.26370 ( -0.21703  0.2162 ) ph/cm2/s
Energy fluence (15-150 keV)             : 8.66583e-08 ( -1.85923e-08  1.91915e-08 ) ergs/cm2
Time-resolved spectra
Distribution
T90 vs. Hardness ratio plot
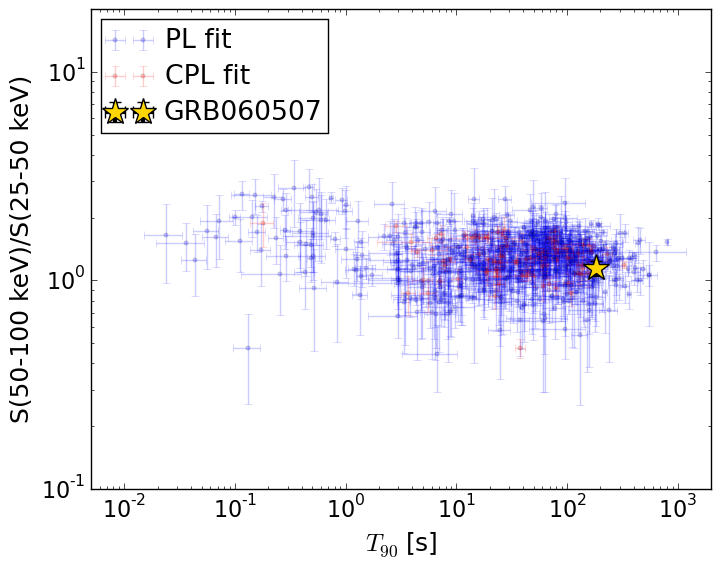
T90                                   = 183.308 sec.
Hardness ratio (energy fluence ratio) = 1.14293160967
S(15-50 keV) vs. S(50-150 keV) plot
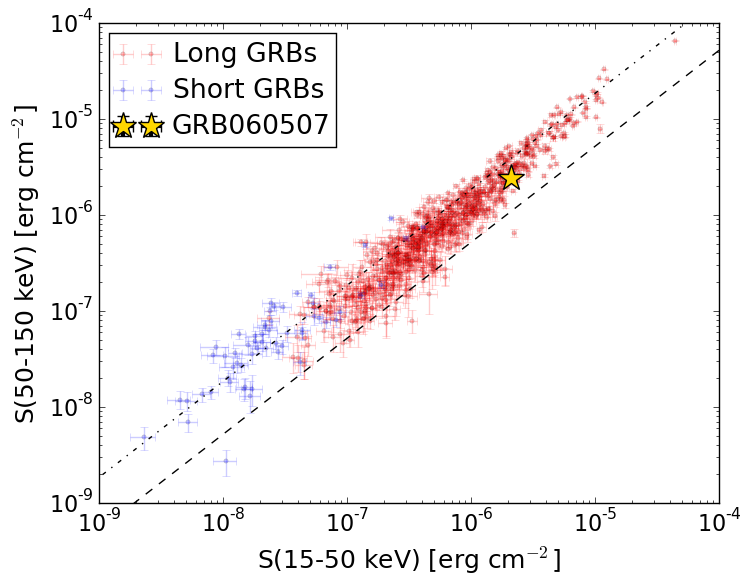
S(15-50 keV)  = 2.1127274e-06
S(50-150 keV) = 2.4057355e-06
The dash-dotted line and the dashed line traces the fluences calculated from the Band function with Epeak = 15 and 150 keV, respectively. Both lines assume a canonical values of alpha = -1 and beta = -2.5.
Mask shadow pattern
IMX = 5.896374236559877E-02, IMY = 6.371114541575648E-01
Spacecraft aspect plot
Bright source in the pre-burst/pre-slew/post-slew images
Pre-burst image of 15-350 keV band
Time interval of the image:
-239.408000 -11.024000

# RAcent  DECcent POSerr Theta    Phi  PeakCts   SNR AngSep     Name
#  [deg]    [deg]    ['] [deg]  [deg]                   [']
254.4108  35.3162    3.4  47.8   36.5   1.8523   3.4    2.8	Her X-1
160.9200  29.3155    2.2  38.3  165.2   1.0817   5.2 ------	UNKNOWN
Pre-slew background subtracted image of 15-350 keV band
Time interval of the image:
-11.024000 171.692590

# RAcent  DECcent POSerr Theta    Phi  PeakCts   SNR AngSep     Name
#  [deg]    [deg]    ['] [deg]  [deg]                   [']
254.3551  35.3002    5.8  47.8   36.6  -1.1482  -2.0    5.6	Her X-1
321.7722  67.1972    2.4  45.4  -33.2   1.5418   4.9 ------	UNKNOWN
 89.9171  75.2446    0.5  32.6  -84.7   6.7775  24.4 ------	UNKNOWN
Post-slew image of 15-350 keV band
Time interval of the image:
241.692590 962.618200

# RAcent  DECcent POSerr Theta    Phi  PeakCts   SNR AngSep     Name
#  [deg]    [deg]    ['] [deg]  [deg]                   [']
299.5852  35.2085    0.4  37.9   53.2  31.8157  32.6    0.5	Cyg X-1
308.2252  40.8226    8.1  29.3   49.8   0.8026   1.4    9.4	Cyg X-3
325.9958  38.3224   78.4  24.0   20.8  -0.0584  -0.1    8.3	Cyg X-2
306.7455  69.8740    2.2  19.4  121.2   2.0881   5.1 ------	UNKNOWN
 51.8479  41.5999    3.1  43.8 -116.1   7.0435   3.7 ------	UNKNOWN