Analysis Summary
Notes:
- 1) No attempt has been made to eliminate the non-significant decimal places.
- 2) This batgrbproduct analysis is done using the HEASARC data.
- 3) This batgrbproduct analysis is using the flight position for the mask-weighting calculation.
======================================================================
BAT GRB EVENT DATA PROCESSING REPORT
Process Script Ver: batgrbproduct v2.46
Process Start Time: Wed Jan 22 16:09:07 EST 2014
Host Name: batevent1
Current Working Dir: /local/data/batevent/batevent_reproc/trigger211117
======================================================================
Trigger: 00211117 Segment: 000
BAT Trigger Time: 169956680 [s; MET]
Trigger Stop: 169956744 [s; MET]
UTC: 2006-05-22T02:11:18.792140 [includes UTCF correction]
Where From?: TDRSS position message
BAT
RA: 322.950749367837 Dec: 2.87593922853813 [deg; J2000]
Catalogged Source?: NO
Point Source?: YES
GRB Indicated?: YES [ by BAT flight software ]
Image S/N Ratio: 13.36
Image Trigger?: YES
Rate S/N Ratio: 0 [ if not an image trigger ]
Image S/N Ratio: 13.36
Analysis Position: [ source = BAT ]
RA: 322.950749367837 Dec: 2.87593922853813 [deg; J2000]
Refined Position: [ source = BAT pre-slew burst ]
RA: 322.956577961755 Dec: 2.89145191205485 [deg; J2000]
{ 21h 31m 49.6s , +02d 53' 29.2" }
+/- 1.48640386183072 [arcmin] (estimated 90% radius based on SNR)
+/- 0.463445783359746 [arcmin] (formal 1-sigma fit error)
SNR: 17.2666716352673
Angular difference between the analysis and refined position is 0.994137 arcmin
Partial Coding Fraction: 0.75 [ including projection effects ]
Duration
T90: 69.1240000128746 +/- 5.89661600721078
Measured from: 3.09200000762939
to: 72.216000020504 [s; relative to TRIGTIME]
T50: 42.0640000104904 +/- 9.0776994944415
Measured from: 16.7960000038147
to: 58.8600000143051 [s; relative to TRIGTIME]
Fluence
Peak Flux (peak 1 second)
Measured from: 4.40799999237061
to: 5.40799999237061 [s; relative to TRIGTIME]
Total Fluence
Measured from: 0.164000004529953
to: 77.3280000090599 [s; relative to TRIGTIME]
Band 1 Band 2 Band 3 Band 4
15-25 25-50 50-100 100-350 keV
Total 0.456651 0.742537 0.443528 0.110681
0.049265 0.052034 0.047935 0.048128 [error]
Peak 0.019105 0.027572 0.010208 0.007058
0.005838 0.006116 0.005385 0.005386 [error]
[ fluence units of on-axis counts / fully illuminated detector ]
======================================================================
====== Table of the duration information =============================
Value tstart tstop
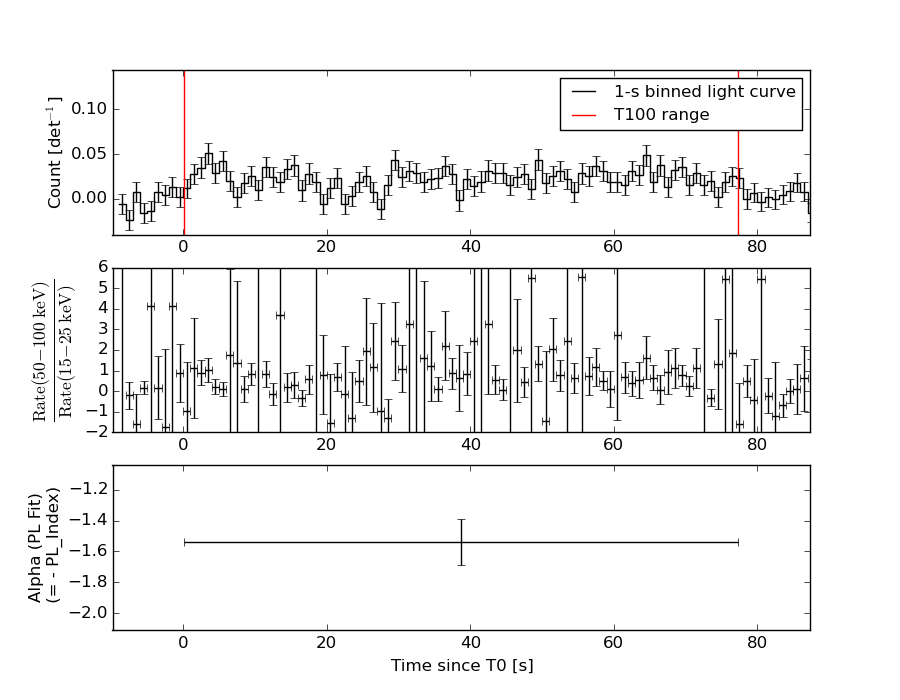
T100 77.164 0.164 77.328
T90 69.124 3.092 72.216
T50 42.064 16.796 58.860
Peak 1.000 4.408 5.408
====== Spectral Analysis Summary =====================================
Model : spectral model: simple power-law (PL) and cutoff power-law (CPL)
Ph_index : photon index: E^{Ph_index}
Ph_90err : 90% error of the photon index
Epeak : Epeak in keV
Epeak_90err: 90% error of Epeak
Norm : normalization at 50 keV in both the PL model and CPL model
Nomr_90err : 90% error of the normalization
chi2 : Chi-Squared
dof : degree of freedo
=== Time-averaged spectral analysis ===
(Best model with acceptable fit: PL)
Model Ph_index Ph_90err_low Ph_90err_hi Epeak Epeak_90err_low Epeak_90err_hi Norm Nomr_90err_low Norm_90err_hi chi2 dof
PL -1.537 -0.151 0.149 - - - 1.55e-03 -1.39e-04 1.39e-04 65.740 57
CPL -0.699 -0.688 0.837 73.310 -16.817 110.885 4.27e-03 -2.38e-03 7.39e-03 61.300 56
=== 1-s peak spectral analysis ===
(Best model with acceptable fit: PL)
Model Ph_index Ph_90err_low Ph_90err_hi Epeak Epeak_90err_low Epeak_90err_hi Norm Nomr_90err_low Norm_90err_hi chi2 dof
PL -1.927 -0.525 0.461 - - - 3.70e-03 -1.30e-03 1.24e-03 45.930 57
CPL 0.206 -2.210 4.429 40.194 -40.194 -40.194 7.09e-02 -7.09e-02 3.19e+01 43.970 56
=== Fluence/Peak Flux Summary ===
Model Band1 Band2 Band3 Band4 Band5 Total
15-25 25-50 50-100 100-350 15-150 15-350 keV
Fluence PL 1.58e-07 2.84e-07 3.92e-07 1.12e-06 1.13e-06 1.96e-06 erg/cm2
90%_error_low -2.19e-08 -2.49e-08 -4.63e-08 -2.56e-07 -1.10e-07 -2.99e-07 erg/cm2
90%_error_hi 2.26e-08 2.49e-08 4.63e-08 3.03e-07 1.12e-07 3.37e-07 erg/cm2
Peak flux PL 2.30e-01 1.80e-01 9.47e-02 7.22e-02 5.38e-01 5.77e-01 ph/cm2/s
90%_error_low -8.25e-02 -4.93e-02 -4.07e-02 -4.54e-02 -1.47e-01 -1.60e-01 ph/cm2/s
90%_error_hi 8.73e-02 4.93e-02 4.28e-02 7.62e-02 1.47e-01 1.62e-01 ph/cm2/s
Fluence CPL 1.40e-07 3.10e-07 3.99e-07 3.46e-07 1.04e-06 1.20e-06 erg/cm2
90%_error_low -2.65e-08 -3.28e-08 -5.24e-08 -2.00e-07 -1.29e-07 -2.37e-07 erg/cm2
90%_error_hi 2.69e-08 3.42e-08 5.18e-08 5.28e-07 1.32e-07 5.31e-07 erg/cm2
Peak flux CPL 1.93e-01 2.29e-01 8.02e-02 5.32e-03 5.08e-01 5.08e-01 ph/cm2/s
90%_error_low -1.93e-01 -7.61e-02 -5.08e-02 -5.32e-03 -1.45e-01 -1.45e-01 ph/cm2/s
90%_error_hi 1.01e-01 7.77e-02 5.43e-02 8.49e-02 1.48e-01 1.51e-01 ph/cm2/s
======================================================================
Image
Pre-slew 15.0-350.0 keV image (Event data)
#   RAcent    DECcent   POSerr    Theta     Phi              Peak Cts       SNR   Name
  322.9566     2.8915   0.0111    31.8761   177.1278         1.8654981     17.267 TRIG_00211117

Foreground time interval of the image:
  0.164  73.101 (delta_t =  72.937 [sec])
Background time interval of the image:
-239.000   0.164 (delta_t = 239.164 [sec])
Light Curves
Note: The mask-weighted lightcurves have units of either count/det or counts/sec/det, where a det is 0.4 x 0.4 = 0.16 sq cm.
Full-time range; 1 s binning
Other quick-look light curves:
- 64 ms binning (zoomed)
- 16 ms binning (zoomed)
- 8 ms binning (zoomed)
- 2 ms binning (zoomed)
- SN=5 or 10 s binning (full-time range)
- Raw light curve
Spectra
- 64 ms binning (zoomed)
- 16 ms binning (zoomed)
- 8 ms binning (zoomed)
- 2 ms binning (zoomed)
- SN=5 or 10 s binning (full-time range)
- Raw light curve
Spectra
Notes:
- 1) The fitting includes the systematic errors.
- 2) When the burst includes telescope slew time periods, the fitting uses an average response file made from multiple 5-s response files through out the slew time plus single time preiod for the non-slew times, and weighted by the total counts in the corresponding time period using addrmf. An average response file is needed becuase a spectral fit using the pre-slew DRM will introduce some errors in both a spectral shape and a normalization if the PHA file contains a lot of the slew/post-slew time interval.
- 3) For fits to more complicated models (e.g. a power-law over a cutoff power-law), the BAT team has decided to require a chi-square improvement of more than 6 for each extra dof.
Time averaged spectrum fit using the average DRM
Power-law model
Time interval is from    0.164 sec. to   77.328 sec.

Spectral model in power-law:
------------------------------------------------------------
Parameters  : value       lower 90%   higher 90%
Photon index: -1.53701     ( -0.150573   0.148746 )
Norm@50keV  : 1.55070E-03    ( -0.000139417   0.000138496 )
------------------------------------------------------------
#Fit statistic : Chi-Squared =          65.74 using 59 PHA bins.
# Reduced chi-squared =          1.153 for     57 degrees of freedom
# Null hypothesis probability =   1.998362e-01

Photon flux (15-150 keV)    in 77.16 sec: 0.195584 ( -0.016894  0.01691 ) ph/cm2/s
Energy fluence (15-150 keV)             : 1.12871e-06 ( -1.10491e-07  1.11975e-07 ) ergs/cm2
Cutoff power-law model
Time interval is from    0.164 sec. to   77.328 sec.
Spectral model in the cutoff power-law:
------------------------------------------------------------
Parameters  : value       lower 90%   higher 90%
Photon index: -0.698635     ( -0.688198   0.837219 )
Epeak [keV] : 73.3104      ( -16.8143 110.887 )
Norm@50keV  : 4.27218E-03    ( -0.00238145   0.00739319 )
------------------------------------------------------------
#Fit statistic : Chi-Squared =          61.30 using 59 PHA bins.
# Reduced chi-squared =          1.095 for     56 degrees of freedom
# Null hypothesis probability =   2.916255e-01

Photon flux (15-150 keV)    in 77.16 sec: 0.187935 ( -0.018158  0.01806 ) ph/cm2/s
Energy fluence (15-150 keV)             : 1.04287e-06 ( -1.28922e-07  1.31626e-07 ) ergs/cm2
1-s peak spectrum fit
Power-law model
Time interval is from    4.408 sec. to    5.408 sec.

Spectral model in power-law:
------------------------------------------------------------
Parameters  : value       lower 90%   higher 90%
Photon index: -1.92669     ( -0.525245   0.4612 )
Norm@50keV  : 3.70260E-03    ( -0.00129636   0.00124296 )
------------------------------------------------------------
#Fit statistic : Chi-Squared =          45.93 using 59 PHA bins.
# Reduced chi-squared =         0.8058 for     57 degrees of freedom
# Null hypothesis probability =   8.528986e-01

Photon flux (15-150 keV)    in 1 sec: 0.537521 ( -0.14656  0.14656 ) ph/cm2/s
Energy fluence (15-150 keV)             : 3.40604e-08 ( -1.10793e-08  1.17454e-08 ) ergs/cm2
Cutoff power-law model
Time interval is from    4.408 sec. to    5.408 sec.
Spectral model in the cutoff power-law:
------------------------------------------------------------
Parameters  : value       lower 90%   higher 90%
Photon index: 0.206253     ( -2.34068   4.29849 )
Epeak [keV] : 40.1944      ( -40.0091 -40.0091 )
Norm@50keV  : 7.08762E-02    ( -0.0924895   31.8611 )
------------------------------------------------------------
#Fit statistic : Chi-Squared =          43.97 using 59 PHA bins.
# Reduced chi-squared =         0.7852 for     56 degrees of freedom
# Null hypothesis probability =   8.781263e-01

Photon flux (15-150 keV)    in 1 sec: 0.508090 ( -0.144975  0.147808 ) ph/cm2/s
Energy fluence (15-150 keV)             : 2.82273e-08 ( -8.95604e-09  1.26178e-08 ) ergs/cm2
Time-resolved spectra
Distribution
T90 vs. Hardness ratio plot
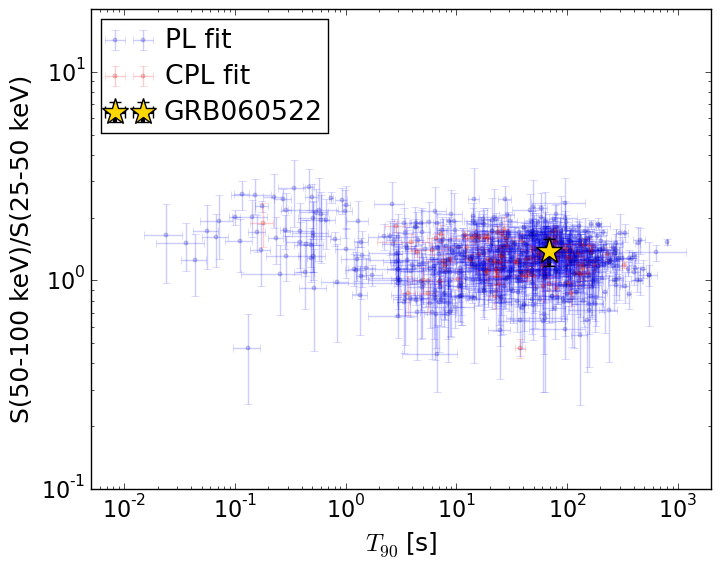
T90                                   = 69.124 sec.
Hardness ratio (energy fluence ratio) = 1.37847829139
S(15-50 keV) vs. S(50-150 keV) plot
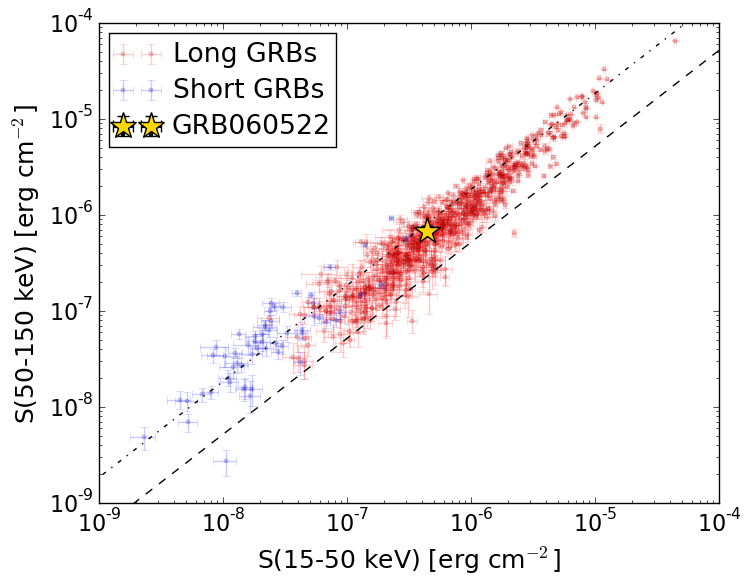
S(15-50 keV)  = 4.423427e-07
S(50-150 keV) = 6.863775e-07
The dash-dotted line and the dashed line traces the fluences calculated from the Band function with Epeak = 15 and 150 keV, respectively. Both lines assume a canonical values of alpha = -1 and beta = -2.5.
Mask shadow pattern
IMX = -6.210847846077263E-01, IMY = -3.116077551905699E-02
Spacecraft aspect plot
Bright source in the pre-burst/pre-slew/post-slew images
Pre-burst image of 15-350 keV band
Time interval of the image:
-239.000000 0.164000

# RAcent  DECcent POSerr Theta    Phi  PeakCts   SNR AngSep     Name
#  [deg]    [deg]    ['] [deg]  [deg]                   [']
299.4426 -39.8369    2.4  29.3   71.4   1.2879   4.8 ------	UNKNOWN
323.4684   3.5706    2.8  32.4  178.4   0.7951   4.1 ------	UNKNOWN
344.6202 -22.2876    3.2  12.8  -98.6   0.6362   3.6 ------	UNKNOWN
Pre-slew background subtracted image of 15-350 keV band
Time interval of the image:
0.164000 73.100600

# RAcent  DECcent POSerr Theta    Phi  PeakCts   SNR AngSep     Name
#  [deg]    [deg]    ['] [deg]  [deg]                   [']
322.9566   2.8915    0.7  31.9  177.1   1.8655  17.3 ------	UNKNOWN
339.8633  20.7092    2.8  49.1 -156.0   0.8951   4.2 ------	UNKNOWN
Post-slew image of 15-350 keV band
Time interval of the image:
125.900600 963.092000

# RAcent  DECcent POSerr Theta    Phi  PeakCts   SNR AngSep     Name
#  [deg]    [deg]    ['] [deg]  [deg]                   [']
288.7847  10.9329    1.4  34.8  125.8   7.0143   8.2    1.1	GRS 1915+105
299.5882  35.2014    0.4  38.9  169.6  21.4959  28.2    0.1	Cyg X-1
308.0573  40.9460    1.6  40.4 -176.8   4.5064   7.2    2.4	Cyg X-3
326.2253  38.3191    3.6  35.6 -154.9   1.8559   3.2    2.5	Cyg X-2
315.6653  37.8487    2.5  35.6 -169.2   2.2795   4.7 ------	UNKNOWN
310.1979  58.7630    2.0  56.8 -167.2   9.7141   5.6 ------	UNKNOWN
  3.4163  11.3530    4.3  41.0  -83.3   6.3184   2.7 ------	UNKNOWN