Analysis Summary
Notes:
- 1) No attempt has been made to eliminate the non-significant decimal places.
- 2) This batgrbproduct analysis is done using the HEASARC data.
- 3) This batgrbproduct analysis is using the flight position for the mask-weighting calculation.
======================================================================
                  BAT GRB EVENT DATA PROCESSING REPORT
    Process Script Ver: batgrbproduct v2.46
    Process Start Time: Wed Jan 22 15:47:34 EST 2014
             Host Name: batevent1
   Current Working Dir: /local/data/batevent/batevent_reproc/trigger213486
======================================================================

  Trigger: 00213486      Segment: 000

  BAT Trigger Time: 171137941.248   [s; MET]
      Trigger Stop: 171137945.344   [s; MET]
               UTC: 2006-06-04T18:19:00.012500    [includes UTCF correction]
       Where From?: TDRSS position message

  BAT
    RA: 337.242167553083   Dec: -10.9050195742294  [deg; J2000]

     Catalogged Source?: NO
     Point Source?:      YES
     GRB Indicated?:     YES    [ by BAT flight software ]
     Image S/N Ratio:    6.78
     Image Trigger?:     NO
     Rate S/N Ratio:     12.4899959967968  [ if not an image trigger ]
     Image S/N Ratio:    6.78

  Analysis Position:   [ source = BAT ]
    RA: 337.242167553083   Dec: -10.9050195742294  [deg; J2000]

  Refined Position:   [ source = BAT pre-slew burst ]
    RA: 337.242   Dec: -10.905  [deg; J2000]
        { 22h 28m 58.1s , -10d -54' -18.0" }
        +/- 2.54465264693 [arcmin] (estimated 90% radius based on SNR)
    SNR: 8.01135359129


  Angular difference between the analysis and refined position is 0.009941 arcmin

  Partial Coding Fraction: 0.7265625    [ including projection effects ]

  Duration
     T90: 96 +/- 22.6274169979695
        Measured from: -63.2479999959469
                   to: 32.7520000040531     [s; relative to TRIGTIME]
     T50: 48 +/- 16
        Measured from: -47.2479999959469
                   to: 0.752000004053116     [s; relative to TRIGTIME]


  Fluence
     Peak Flux  (peak 1 second)
        Measured from: 8.25200000405312
                   to: 9.25200000405312     [s; relative to TRIGTIME]
     Total Fluence
        Measured from: -63.2479999959469
                   to: 32.7520000040531     [s; relative to TRIGTIME]

             Band 1     Band 2     Band 3     Band 4
              15-25      25-50     50-100    100-350     keV
 Total     0.271914   0.279691   0.142609   0.053713
           0.051406   0.051975   0.045582   0.040479 [error]
 Peak      0.002520   0.004688  -0.000435  -0.000359
           0.005332   0.005247   0.004591   0.004181 [error]

     [ fluence units of on-axis counts / fully illuminated detector ]

======================================================================


====== Table of the duration information =============================

        Value   tstart    tstop
T100   96.000  -63.248   32.752
T90    96.000  -63.248   32.752
T50    48.000  -47.248    0.752
Peak    1.000    8.252    9.252


====== Spectral Analysis Summary =====================================

Model      : spectral model: simple power-law (PL) and cutoff power-law (CPL)
Ph_index   : photon index: E^{Ph_index}
Ph_90err   : 90% error of the photon index
Epeak      : Epeak in keV
Epeak_90err: 90% error of Epeak
Norm       : normalization at 50 keV in both the PL model and CPL model
Nomr_90err : 90% error of the normalization
chi2       : Chi-Squared
dof        : degree of freedo

=== Time-averaged spectral analysis ===
(Best model with acceptable fit: PL)

Model Ph_index Ph_90err_low Ph_90err_hi  Epeak  Epeak_90err_low  Epeak_90err_hi  Norm       Nomr_90err_low    Norm_90err_hi    chi2    dof
PL      -2.054    -0.453      0.393       -           -               -         4.23e-04     -1.25e-04          1.18e-04      41.520   57
CPL     -2.120    -0.142      1.738       74.506      N/A           N/A         3.86e-04        N/A               N/A         41.510   56


=== 1-s peak spectral analysis ===
(Best model with acceptable fit: N/A)

Model Ph_index Ph_90err_low Ph_90err_hi  Epeak  Epeak_90err_low  Epeak_90err_hi  Norm       Nomr_90err_low    Norm_90err_hi    chi2    dof
PL      -9.446      9.446     9.446       -           -               -         1.92e-07     -1.92e-07          -1.92e-07      52.730   57
CPL     -1.428      N/A       N/A          16.169      N/A           N/A         1.50e-03        N/A               N/A         53.460   56


=== Fluence/Peak Flux Summary ===

              Model    Band1     Band2     Band3     Band4     Band5     Total
                       15-25     25-50    50-100    100-350    15-150    15-350    keV
Fluence         PL   8.74e-08  1.15e-07  1.11e-07  1.90e-07  3.76e-07  5.03e-07   erg/cm2
      90%_error_low -2.36e-08 -2.45e-08 -4.25e-08 -1.12e-07 -9.67e-08 -1.71e-07   erg/cm2
      90%_error_hi   2.43e-08  2.40e-08  4.52e-08  1.88e-07  1.02e-07  2.31e-07   erg/cm2
Peak flux       PL   2.54e-02  1.99e-04  1.07e-06  2.42e-09  2.46e-02  2.45e-02   ph/cm2/s
      90%_error_low -2.54e-02 -1.99e-04 -1.07e-06 -2.42e-09 -2.46e-02 -2.45e-02   ph/cm2/s
      90%_error_hi   8.12e-02  5.13e-02  2.77e-02  -2.42e-09  1.30e-01  1.34e-01   ph/cm2/s

Fluence        CPL   8.78e-08  1.14e-07  1.11e-07  2.20e-07  3.79e-07  5.29e-07   erg/cm2
      90%_error_low -2.00e-08    N/A       N/A    -1.41e-07 -1.45e-07    N/A      erg/cm2
      90%_error_hi   2.43e-08    N/A       N/A     9.23e-08  9.81e-08    N/A      erg/cm2
Peak flux      CPL   3.79e-03  3.71e-02  1.02e-02  2.66e-06  4.81e-02  4.68e-02   ph/cm2/s
      90%_error_low     N/A   -3.71e-02 -1.02e-02 -2.66e-06 -4.81e-02     N/A     ph/cm2/s
      90%_error_hi      N/A    3.04e-02  4.39e-02  2.14e-02  1.08e-01     N/A     ph/cm2/s

======================================================================
Image
Pre-slew 15.0-50.0 keV image (Event data)
#RAcent DECcent POSerr Theta  Phi  Peak_Cts  SNR Name
337.242 -10.905 0.000 25.123 148.851 0.123 8.011 TRIG_00213486

Image time interval: 0.000 to 4.096 [sec]
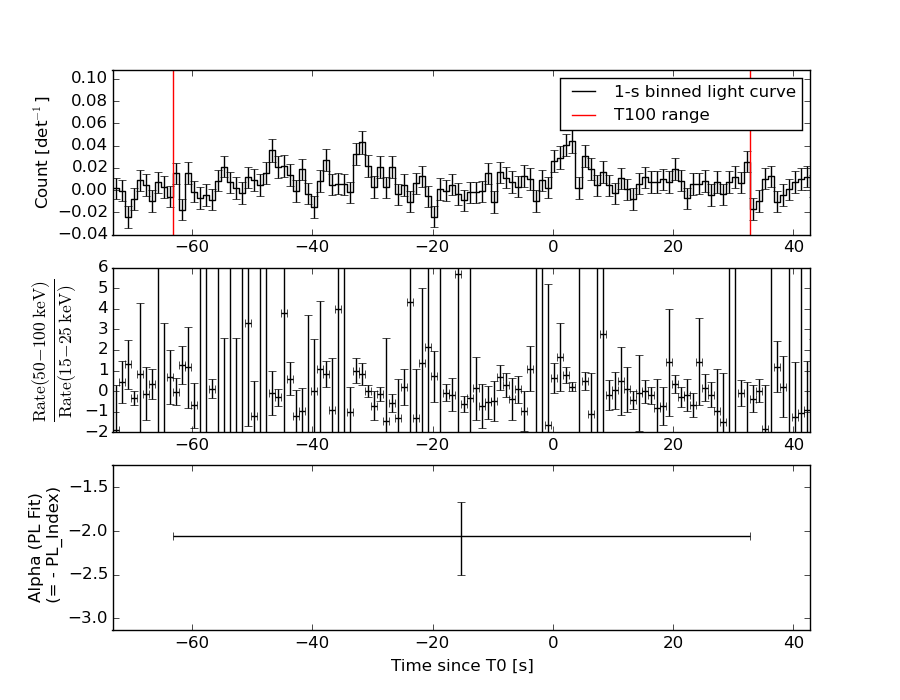
Light Curves
Note: The mask-weighted lightcurves have units of either count/det or counts/sec/det, where a det is 0.4 x 0.4 = 0.16 sq cm.
Full-time range; 1 s binning
Other quick-look light curves:
- 64 ms binning (zoomed)
- 16 ms binning (zoomed)
- 8 ms binning (zoomed)
- 2 ms binning (zoomed)
- SN=5 or 10 s binning (full-time range)
- Raw light curve
Spectra
- 64 ms binning (zoomed)
- 16 ms binning (zoomed)
- 8 ms binning (zoomed)
- 2 ms binning (zoomed)
- SN=5 or 10 s binning (full-time range)
- Raw light curve
Spectra
Notes:
- 1) The fitting includes the systematic errors.
- 2) When the burst includes telescope slew time periods, the fitting uses an average response file made from multiple 5-s response files through out the slew time plus single time preiod for the non-slew times, and weighted by the total counts in the corresponding time period using addrmf. An average response file is needed becuase a spectral fit using the pre-slew DRM will introduce some errors in both a spectral shape and a normalization if the PHA file contains a lot of the slew/post-slew time interval.
- 3) For fits to more complicated models (e.g. a power-law over a cutoff power-law), the BAT team has decided to require a chi-square improvement of more than 6 for each extra dof.
Time averaged spectrum fit using the average DRM
Power-law model
Time interval is from  -63.248 sec. to   32.752 sec.

Spectral model in power-law:
------------------------------------------------------------
Parameters  : value       lower 90%   higher 90%
Photon index: -2.05392     ( -0.453088   0.393319 )
Norm@50keV  : 4.22780E-04    ( -0.000124944   0.000118021 )
------------------------------------------------------------
#Fit statistic : Chi-Squared =          41.52 using 59 PHA bins.
# Reduced chi-squared =         0.7285 for     57 degrees of freedom
# Null hypothesis probability =   9.385169e-01

Photon flux (15-150 keV)    in 96 sec: 6.50467E-02 ( -0.0131132  0.0131141 ) ph/cm2/s
Energy fluence (15-150 keV)             : 3.75657e-07 ( -9.66902e-08  1.01973e-07 ) ergs/cm2
Cutoff power-law model

Time interval is from  -63.248 sec. to   32.752 sec.
Spectral model in the cutoff power-law:
------------------------------------------------------------
Parameters  : value       lower 90%   higher 90%
Photon index: -2.12004     ( -0.14252   1.73748 )
Epeak [keV] : 74.5059      (   )
Norm@50keV  : 3.86265E-04    (     )
------------------------------------------------------------
#Fit statistic : Chi-Squared =          41.51 using 59 PHA bins.
# Reduced chi-squared =         0.7413 for     56 degrees of freedom
# Null hypothesis probability =   9.256368e-01

Photon flux (15-150 keV)    in 96 sec: 6.51723E-02 (    ) ph/cm2/s
Energy fluence (15-150 keV)             : 3.79351e-07 ( -1.45154e-07  9.81034e-08 ) ergs/cm2
1-s peak spectrum fit
Power-law model
Time interval is from    8.252 sec. to    9.252 sec.

Spectral model in power-law:
------------------------------------------------------------
Parameters  : value       lower 90%   higher 90%
Photon index: -10     ( 10   10 )
Norm@50keV  : 9.92330E-08    ( -9.82667e-08   -9.82667e-08 )
------------------------------------------------------------
#Fit statistic : Chi-Squared =          52.68 using 59 PHA bins.
# Reduced chi-squared =         0.9243 for     57 degrees of freedom
# Null hypothesis probability =   6.375550e-01

Photon flux (15-150 keV)    in 1 sec: 2.46472E-02 2.78353E-02 (    ) ph/cm2/s
Energy fluence (15-150 keV)             : 7.60834e-10 ( 1  8.36179e-09 ) ergs/cm2
Cutoff power-law model
Time interval is from    8.252 sec. to    9.252 sec.
Spectral model in the cutoff power-law:
------------------------------------------------------------
Parameters  : value       lower 90%   higher 90%
Photon index: 4.16288     (       )
Epeak [keV] : 4.10350      (   )
Norm@50keV  : 9.06251E+09    (     )
------------------------------------------------------------
#Fit statistic : Chi-Squared =          52.43 using 59 PHA bins.
# Reduced chi-squared =         0.9363 for     56 degrees of freedom
# Null hypothesis probability =   6.106958e-01

Photon flux (15-150 keV)    in 1 sec: 4.81353E-02 ( -0.0481353  0.10823 ) ph/cm2/s
Energy fluence (15-150 keV)             : 1.98226e-10 ( 0  0 ) ergs/cm2
Time-resolved spectra
Distribution
T90 vs. Hardness ratio plot
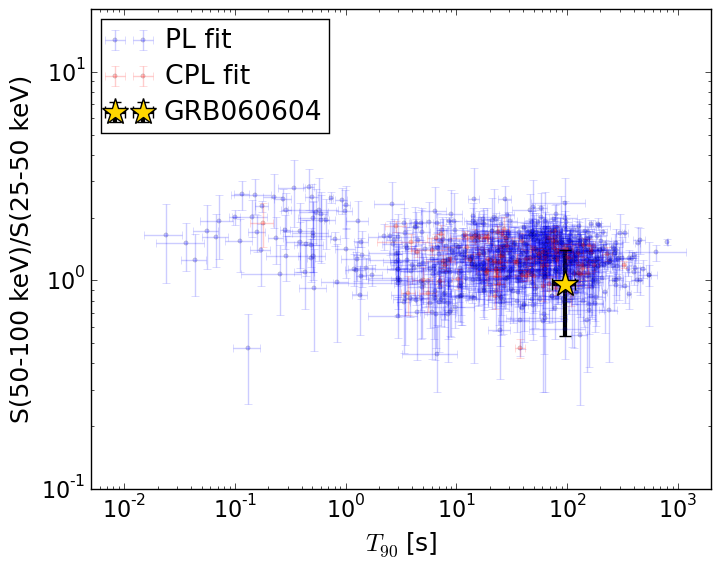
T90                                   = 96.0 sec.
Hardness ratio (energy fluence ratio) = 0.963341200651
S(15-50 keV) vs. S(50-150 keV) plot
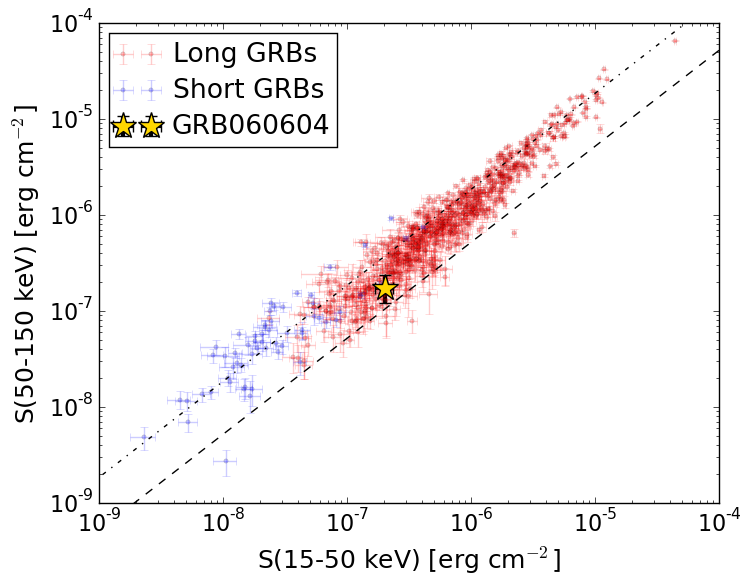
S(15-50 keV)  = 2.0223706e-07
S(50-150 keV) = 1.7342215e-07
The dash-dotted line and the dashed line traces the fluences calculated from the Band function with Epeak = 15 and 150 keV, respectively. Both lines assume a canonical values of alpha = -1 and beta = -2.5.
Mask shadow pattern
IMX = -0.401323066356, IMY = -0.242564705896
Spacecraft aspect plot
Bright source in the pre-burst/pre-slew/post-slew images
Pre-burst image of 15-350 keV band
Time interval of the image:
-90.747400 -63.248000

# RAcent  DECcent POSerr Theta    Phi  PeakCts   SNR AngSep     Name
#  [deg]    [deg]    ['] [deg]  [deg]                   [']
313.3389 -19.0665    2.2  40.9  113.2   0.9922   5.3 ------	UNKNOWN
 15.9772  -1.9235    3.0  31.4 -121.0   0.2349   3.9 ------	UNKNOWN
  4.4140  28.0471    2.3  56.2 -151.5   1.0963   5.1 ------	UNKNOWN
Pre-slew background subtracted image of 15-350 keV band
Time interval of the image:
-63.248000 32.752000

# RAcent  DECcent POSerr Theta    Phi  PeakCts   SNR AngSep     Name
#  [deg]    [deg]    ['] [deg]  [deg]                   [']
340.8480 -68.0528    2.2  41.5   29.9   1.7879   5.2 ------	UNKNOWN
333.2556 -41.9486    2.4  24.1   68.3   1.0568   4.7 ------	UNKNOWN
Post-slew image of 15-350 keV band
Time interval of the image:
97.852600 274.852600

# RAcent  DECcent POSerr Theta    Phi  PeakCts   SNR AngSep     Name
#  [deg]    [deg]    ['] [deg]  [deg]                   [']
326.0490  38.2929    6.8  50.3 -170.1   0.5268   1.7    6.0	Cyg X-2
307.2726 -30.6007    2.8  34.1   71.5   1.1758   4.2 ------	UNKNOWN
345.1280 -43.2068    2.7  33.0   10.8   0.7012   4.3 ------	UNKNOWN
331.3574  48.2172    3.0  59.4 -163.2   3.4898   3.9 ------	UNKNOWN
 29.8313 -44.0363    2.3  55.9  -22.2   2.1923   5.0 ------	UNKNOWN