Analysis Summary
Notes:
- 1) No attempt has been made to eliminate the non-significant decimal places.
- 2) This batgrbproduct analysis is done using the HEASARC data.
- 3) This batgrbproduct analysis is using the flight position for the mask-weighting calculation.
======================================================================
BAT GRB EVENT DATA PROCESSING REPORT
Process Script Ver: batgrbproduct v2.46
Process Start Time: Wed Jan 22 15:37:02 EST 2014
Host Name: batevent1
Current Working Dir: /local/data/batevent/batevent_reproc/trigger213823
======================================================================
Trigger: 00213823 Segment: 000
BAT Trigger Time: 171349934.592 [s; MET]
Trigger Stop: 171349935.616 [s; MET]
UTC: 2006-06-07T05:12:13.351500 [includes UTCF correction]
Where From?: TDRSS position message
BAT
RA: 329.711869958478 Dec: -22.5057942155925 [deg; J2000]
Catalogged Source?: NO
Point Source?: YES
GRB Indicated?: YES [ by BAT flight software ]
Image S/N Ratio: 14.77
Image Trigger?: NO
Rate S/N Ratio: 32.6190128606002 [ if not an image trigger ]
Image S/N Ratio: 14.77
Analysis Position: [ source = BAT ]
RA: 329.711869958478 Dec: -22.5057942155925 [deg; J2000]
Refined Position: [ source = BAT pre-slew burst ]
RA: 329.707777024863 Dec: -22.4962840417586 [deg; J2000]
{ 21h 58m 49.9s , -22d 29' 46.6" }
+/- 0.835024732101444 [arcmin] (estimated 90% radius based on SNR)
+/- 0.255878345470247 [arcmin] (formal 1-sigma fit error)
SNR: 39.3528751236418
Angular difference between the analysis and refined position is 0.614061 arcmin
Partial Coding Fraction: 0.9921875 [ including projection effects ]
Duration
T90: 103.032000005245 +/- 28.06195686723
Measured from: -7.21200001239777
to: 95.8199999928474 [s; relative to TRIGTIME]
T50: 25.2439999878407 +/- 2.38332286908109
Measured from: 1.60400000214577
to: 26.8479999899864 [s; relative to TRIGTIME]
Fluence
Peak Flux (peak 1 second)
Measured from: -0.967999994754791
to: 0.0320000052452087 [s; relative to TRIGTIME]
Total Fluence
Measured from: -23.6280000209808
to: 102.252000004053 [s; relative to TRIGTIME]
Band 1 Band 2 Band 3 Band 4
15-25 25-50 50-100 100-350 keV
Total 1.065426 1.533541 1.190820 0.278994
0.050391 0.052550 0.046582 0.039896 [error]
Peak 0.035444 0.064478 0.060752 0.020808
0.004990 0.005590 0.005118 0.004126 [error]
[ fluence units of on-axis counts / fully illuminated detector ]
======================================================================
====== Table of the duration information =============================
Value tstart tstop
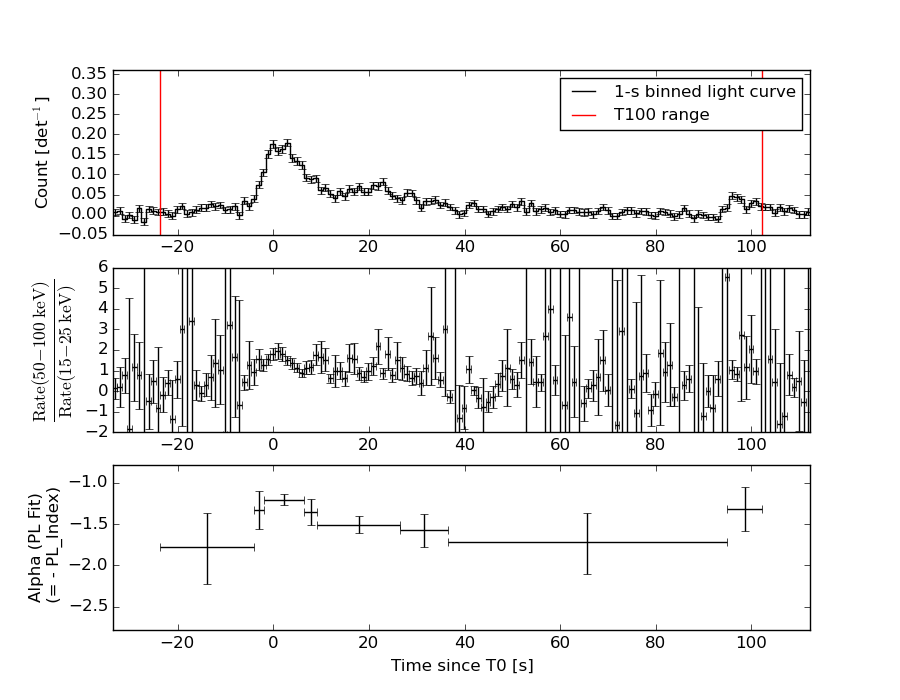
T100 125.880 -23.628 102.252
T90 103.032 -7.212 95.820
T50 25.244 1.604 26.848
Peak 1.000 -0.968 0.032
====== Spectral Analysis Summary =====================================
Model : spectral model: simple power-law (PL) and cutoff power-law (CPL)
Ph_index : photon index: E^{Ph_index}
Ph_90err : 90% error of the photon index
Epeak : Epeak in keV
Epeak_90err: 90% error of Epeak
Norm : normalization at 50 keV in both the PL model and CPL model
Nomr_90err : 90% error of the normalization
chi2 : Chi-Squared
dof : degree of freedo
=== Time-averaged spectral analysis ===
(Best model with acceptable fit: PL)
Model Ph_index Ph_90err_low Ph_90err_hi Epeak Epeak_90err_low Epeak_90err_hi Norm Nomr_90err_low Norm_90err_hi chi2 dof
PL -1.444 -0.073 0.073 - - - 2.13e-03 -8.50e-05 8.49e-05 43.580 57
CPL -1.147 -0.283 0.303 149.843 -50.709 1148.327 2.96e-03 -7.77e-04 1.15e-03 40.370 56
=== 1-s peak spectral analysis ===
(Best model with acceptable fit: PL)
Model Ph_index Ph_90err_low Ph_90err_hi Epeak Epeak_90err_low Epeak_90err_hi Norm Nomr_90err_low Norm_90err_hi chi2 dof
PL -1.078 -0.156 0.159 - - - 1.21e-02 -1.07e-03 1.07e-03 31.870 57
CPL -0.958 -0.264 0.565 485.583 -485.583 -485.583 1.38e-02 -2.65e-03 1.05e-02 31.890 56
=== Fluence/Peak Flux Summary ===
Model Band1 Band2 Band3 Band4 Band5 Total
15-25 25-50 50-100 100-350 15-150 15-350 keV
Fluence PL 3.25e-07 6.17e-07 9.08e-07 2.86e-06 2.57e-06 4.71e-06 erg/cm2
90%_error_low -2.39e-08 -2.70e-08 -4.64e-08 -3.14e-07 -1.12e-07 -3.46e-07 erg/cm2
90%_error_hi 2.45e-08 2.69e-08 4.63e-08 3.40e-07 1.13e-07 3.67e-07 erg/cm2
Peak flux PL 3.34e-01 4.32e-01 4.09e-01 6.86e-01 1.40e+00 1.86e+00 ph/cm2/s
90%_error_low -5.82e-02 -4.71e-02 -4.08e-02 -1.38e-01 -1.27e-01 -1.78e-01 ph/cm2/s
90%_error_hi 6.16e-02 4.63e-02 4.04e-02 1.59e-01 1.27e-01 1.82e-01 ph/cm2/s
Fluence CPL 3.05e-07 6.32e-07 9.25e-07 1.86e-06 2.51e-06 3.72e-06 erg/cm2
90%_error_low -2.95e-08 -3.06e-08 -5.01e-08 -5.93e-07 -1.27e-07 -6.02e-07 erg/cm2
90%_error_hi 3.01e-08 3.10e-08 5.07e-08 9.38e-07 1.26e-07 9.35e-07 erg/cm2
Peak flux CPL 3.39e-01 4.34e-01 4.12e-01 6.85e-01 1.40e+00 1.84e+00 ph/cm2/s
90%_error_low -8.48e-02 -4.83e-02 -4.24e-02 -3.40e-01 -1.31e-01 -3.54e-01 ph/cm2/s
90%_error_hi 4.44e-02 5.03e-02 4.96e-02 9.01e-02 1.29e-01 1.94e-01 ph/cm2/s
======================================================================
Image
Pre-slew 15.0-350.0 keV image (Event data)
#   RAcent    DECcent   POSerr    Theta     Phi              Peak Cts       SNR   Name
  329.7078   -22.4963   0.0049    17.9464    -9.3044         2.3592734     39.353 TRIG_00213823

Foreground time interval of the image:
-23.628  15.109 (delta_t =  38.737 [sec])
Background time interval of the image:
-239.592 -23.628 (delta_t = 215.964 [sec])
Light Curves
Note: The mask-weighted lightcurves have units of either count/det or counts/sec/det, where a det is 0.4 x 0.4 = 0.16 sq cm.
Full-time range; 1 s binning
Other quick-look light curves:
- 64 ms binning (zoomed)
- 16 ms binning (zoomed)
- 8 ms binning (zoomed)
- 2 ms binning (zoomed)
- SN=5 or 10 s binning (full-time range)
- Raw light curve
Spectra
- 64 ms binning (zoomed)
- 16 ms binning (zoomed)
- 8 ms binning (zoomed)
- 2 ms binning (zoomed)
- SN=5 or 10 s binning (full-time range)
- Raw light curve
Spectra
Notes:
- 1) The fitting includes the systematic errors.
- 2) When the burst includes telescope slew time periods, the fitting uses an average response file made from multiple 5-s response files through out the slew time plus single time preiod for the non-slew times, and weighted by the total counts in the corresponding time period using addrmf. An average response file is needed becuase a spectral fit using the pre-slew DRM will introduce some errors in both a spectral shape and a normalization if the PHA file contains a lot of the slew/post-slew time interval.
- 3) For fits to more complicated models (e.g. a power-law over a cutoff power-law), the BAT team has decided to require a chi-square improvement of more than 6 for each extra dof.
Time averaged spectrum fit using the average DRM
Power-law model

Time interval is from  -23.628 sec. to  102.252 sec.

Spectral model in power-law:
------------------------------------------------------------
Parameters  : value       lower 90%   higher 90%
Photon index: -1.44382     ( -0.0733218   0.0732599 )
Norm@50keV  : 2.12799E-03    ( -8.49749e-05   8.49152e-05 )
------------------------------------------------------------
#Fit statistic : Chi-Squared =          43.58 using 59 PHA bins.
# Reduced chi-squared =         0.7646 for     57 degrees of freedom
# Null hypothesis probability =   9.045238e-01

Photon flux (15-150 keV)    in 125.9 sec: 0.261852 ( -0.010871  0.010891 ) ph/cm2/s
Energy fluence (15-150 keV)             : 2.567e-06 ( -1.12316e-07  1.1282e-07 ) ergs/cm2
Cutoff power-law model
Time interval is from  -23.628 sec. to  102.252 sec.
Spectral model in the cutoff power-law:
------------------------------------------------------------
Parameters  : value       lower 90%   higher 90%
Photon index: -1.14735     ( -0.282896   0.30272 )
Epeak [keV] : 149.843      ( -50.7091 1148.32 )
Norm@50keV  : 2.95869E-03    ( -0.000776691   0.00114575 )
------------------------------------------------------------
#Fit statistic : Chi-Squared =          40.37 using 59 PHA bins.
# Reduced chi-squared =         0.7209 for     56 degrees of freedom
# Null hypothesis probability =   9.426960e-01

Photon flux (15-150 keV)    in 125.9 sec: 0.257113 ( -0.011729  0.011738 ) ph/cm2/s
Energy fluence (15-150 keV)             : 2.5069e-06 ( -1.26628e-07  1.26255e-07 ) ergs/cm2
1-s peak spectrum fit
Power-law model
Time interval is from   -0.968 sec. to    0.032 sec.

Spectral model in power-law:
------------------------------------------------------------
Parameters  : value       lower 90%   higher 90%
Photon index: -1.07759     ( -0.155819   0.158922 )
Norm@50keV  : 1.21353E-02    ( -0.00107184   0.00107005 )
------------------------------------------------------------
#Fit statistic : Chi-Squared =          31.87 using 59 PHA bins.
# Reduced chi-squared =         0.5591 for     57 degrees of freedom
# Null hypothesis probability =   9.971518e-01

Photon flux (15-150 keV)    in 1 sec: 1.40471 ( -0.12701  0.12727 ) ph/cm2/s
Energy fluence (15-150 keV)             : 1.27812e-07 ( -1.24481e-08  1.25405e-08 ) ergs/cm2
Cutoff power-law model

Time interval is from   -0.968 sec. to    0.032 sec.
Spectral model in the cutoff power-law:
------------------------------------------------------------
Parameters  : value       lower 90%   higher 90%
Photon index: -1.07236     ( -0.230559   0.59825 )
Epeak [keV] : 9995.70      ( -9994.78 -9994.78 )
Norm@50keV  : 1.22030E-02    ( -0.00107225   0.0121089 )
------------------------------------------------------------
#Fit statistic : Chi-Squared =          31.87 using 59 PHA bins.
# Reduced chi-squared =         0.5690 for     56 degrees of freedom
# Null hypothesis probability =   9.961140e-01

Photon flux (15-150 keV)    in 1 sec: 1.40205 ( -0.13121  0.12886 ) ph/cm2/s
Energy fluence (15-150 keV)             : 1.27359e-07 ( -1.30764e-08  1.28804e-08 ) ergs/cm2
Time-resolved spectra
Distribution
T90 vs. Hardness ratio plot
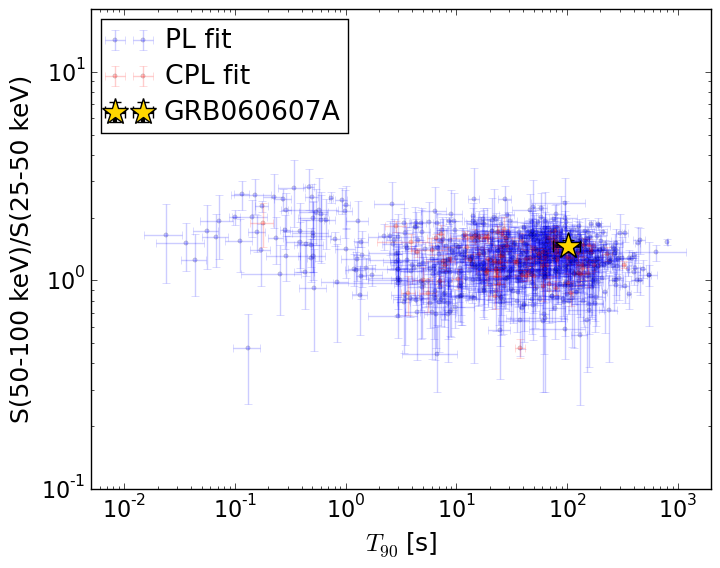
T90                                   = 103.032 sec.
Hardness ratio (energy fluence ratio) = 1.47041555626
S(15-50 keV) vs. S(50-150 keV) plot
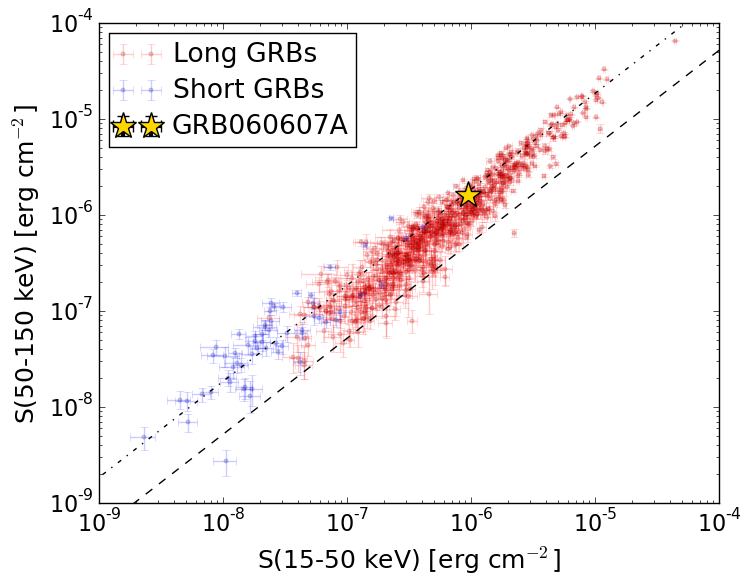
S(15-50 keV)  = 9.417812e-07
S(50-150 keV) = 1.6252369e-06
The dash-dotted line and the dashed line traces the fluences calculated from the Band function with Epeak = 15 and 150 keV, respectively. Both lines assume a canonical values of alpha = -1 and beta = -2.5.
Mask shadow pattern
IMX = 3.196239141052718E-01, IMY = 5.236545093759146E-02
Spacecraft aspect plot
Bright source in the pre-burst/pre-slew/post-slew images
Pre-burst image of 15-350 keV band
Time interval of the image:
-239.592000 -23.628000

# RAcent  DECcent POSerr Theta    Phi  PeakCts   SNR AngSep     Name
#  [deg]    [deg]    ['] [deg]  [deg]                   [']
288.7982  10.9099    3.3  37.3  130.7   1.2280   3.5    2.1	GRS 1915+105
299.5626  35.2038    1.0  46.5  168.0   4.0633  11.5    1.4	Cyg X-1
308.0766  40.9971    4.9  48.8  179.6   0.7166   2.3    3.1	Cyg X-3
325.9712  38.4338   10.1  44.6 -162.1  -0.3118  -1.1   11.6	Cyg X-2
Pre-slew background subtracted image of 15-350 keV band
Time interval of the image:
-23.628000 15.108600

# RAcent  DECcent POSerr Theta    Phi  PeakCts   SNR AngSep     Name
#  [deg]    [deg]    ['] [deg]  [deg]                   [']
288.8520  10.9959   11.2  37.3  130.9   0.1362   1.0    4.4	GRS 1915+105
299.6126  35.2006   14.8  46.4  168.1  -0.1073  -0.8    1.1	Cyg X-1
308.0713  40.9830    4.2  48.8  179.6  -0.4010  -2.7    2.5	Cyg X-3
326.0079  38.3509    8.7  44.6 -162.0   0.1465   1.3    7.9	Cyg X-2
296.5371   9.8991    2.3  30.1  135.6   0.4307   4.9 ------	UNKNOWN
309.1658 -36.6919    2.2  32.9   33.2   0.5000   5.3 ------	UNKNOWN
329.7078 -22.4963    0.3  17.9   -9.3   2.3592  39.4 ------	UNKNOWN
341.7371  13.5561    2.8  27.6 -121.7   0.3081   4.1 ------	UNKNOWN
Post-slew image of 15-350 keV band
Time interval of the image:
54.508600 962.478700

# RAcent  DECcent POSerr Theta    Phi  PeakCts   SNR AngSep     Name
#  [deg]    [deg]    ['] [deg]  [deg]                   [']
359.4347  11.5653    3.6  44.8 -119.9   6.1565   3.2 ------	UNKNOWN