Analysis Summary
Notes:
- 1) No attempt has been made to eliminate the non-significant decimal places.
- 2) This batgrbproduct analysis is done using the HEASARC data.
- 3) This batgrbproduct analysis is using the flight position for the mask-weighting calculation.
======================================================================
                  BAT GRB EVENT DATA PROCESSING REPORT
    Process Script Ver: batgrbproduct v2.46
    Process Start Time: Wed Jan 22 15:26:57 EST 2014
             Host Name: batevent1
   Current Working Dir: /local/data/batevent/batevent_reproc/trigger213934
======================================================================

  Trigger: 00213934      Segment: 000

  BAT Trigger Time: 171415965.376   [s; MET]
      Trigger Stop: 171415966.4   [s; MET]
               UTC: 2006-06-07T23:32:44.133940    [includes UTCF correction]
       Where From?: TDRSS position message

  BAT
    RA: 42.0330569109095   Dec: 14.73591271934  [deg; J2000]

     Catalogged Source?: NO
     Point Source?:      YES
     GRB Indicated?:     YES    [ by BAT flight software ]
     Image S/N Ratio:    7.37
     Image Trigger?:     NO
     Rate S/N Ratio:     12.8840987267251  [ if not an image trigger ]
     Image S/N Ratio:    7.37

  Analysis Position:   [ source = BAT ]
    RA: 42.0330569109095   Dec: 14.73591271934  [deg; J2000]

  Refined Position:   [ source = BAT pre-slew burst ]
    RA: 42.0408507361237   Dec: 14.7512567609117  [deg; J2000]
        { 02h 48m 09.8s , +14d 45' 04.5" }
         +/- 1.1604289855167 [arcmin] (estimated 90% radius based on SNR)
         +/- 0.467097443946193 [arcmin] (formal 1-sigma fit error)
    SNR: 24.5926959079537

  Angular difference between the analysis and refined position is 1.025718 arcmin

  Partial Coding Fraction: 0.3515625    [ including projection effects ]

  Duration
     T90: 31.5839999914169 +/- 4.28340660161194
        Measured from: 0.572000026702881
                   to: 32.1560000181198     [s; relative to TRIGTIME]
     T50: 12.8720000088215 +/- 2.6445574324452
        Measured from: 5.60400000214577
                   to: 18.4760000109673     [s; relative to TRIGTIME]


  Fluence
     Peak Flux  (peak 1 second)
        Measured from: 8.64000001549721
                   to: 9.64000001549721     [s; relative to TRIGTIME]
     Total Fluence
        Measured from: -0.755999982357025
                   to: 37.0960000157356     [s; relative to TRIGTIME]

             Band 1     Band 2     Band 3     Band 4
              15-25      25-50     50-100    100-350     keV
 Total     0.683316   0.966649   0.723507   0.161877
           0.051828   0.054819   0.049187   0.043217 [error]
 Peak      0.042153   0.046638   0.066916   0.009486
           0.008721   0.009612   0.008987   0.007168 [error]

     [ fluence units of on-axis counts / fully illuminated detector ]

======================================================================


====== Table of the duration information =============================

        Value   tstart    tstop
T100   37.852   -0.756   37.096
T90    31.584    0.572   32.156
T50    12.872    5.604   18.476
Peak    1.000    8.640    9.640


====== Spectral Analysis Summary =====================================

Model      : spectral model: simple power-law (PL) and cutoff power-law (CPL)
Ph_index   : photon index: E^{Ph_index}
Ph_90err   : 90% error of the photon index
Epeak      : Epeak in keV
Epeak_90err: 90% error of Epeak
Norm       : normalization at 50 keV in both the PL model and CPL model
Nomr_90err : 90% error of the normalization
chi2       : Chi-Squared
dof        : degree of freedo

=== Time-averaged spectral analysis ===
(Best model with acceptable fit: PL)

Model Ph_index Ph_90err_low Ph_90err_hi  Epeak  Epeak_90err_low  Epeak_90err_hi  Norm       Nomr_90err_low    Norm_90err_hi    chi2    dof
PL      -1.623    -0.116      0.115       -           -               -         4.69e-03     -3.13e-04          3.11e-04      55.230   57
CPL     -1.519    -0.210      0.437      229.627    -229.627      -229.627      5.30e-03     -1.29e-03          3.42e-03      55.040   56


=== 1-s peak spectral analysis ===
(Best model with acceptable fit: PL)

Model Ph_index Ph_90err_low Ph_90err_hi  Epeak  Epeak_90err_low  Epeak_90err_hi  Norm       Nomr_90err_low    Norm_90err_hi    chi2    dof
PL      -1.377     -0.273     0.271       -           -               -         1.21e-02     -1.96e-03          1.96e-03      67.730   57
CPL     -0.530     -0.963     1.432       99.033     -29.491       -99.033      2.91e-02     -1.81e-02          8.38e-02      65.970   56


=== Fluence/Peak Flux Summary ===

              Model    Band1     Band2     Band3     Band4     Band5     Total
                       15-25     25-50    50-100    100-350    15-150    15-350    keV
Fluence         PL   2.54e-07  4.33e-07  5.63e-07  1.48e-06  1.65e-06  2.73e-06   erg/cm2
      90%_error_low -2.76e-08 -2.90e-08 -4.95e-08 -2.60e-07 -1.17e-07 -3.03e-07   erg/cm2
      90%_error_hi   2.84e-08  2.89e-08  4.94e-08  2.96e-07  1.18e-07  3.30e-07   erg/cm2
Peak flux       PL   4.43e-01  4.80e-01  3.70e-01  4.66e-01  1.47e+00  1.76e+00   ph/cm2/s
      90%_error_low -1.23e-01 -8.79e-02 -7.12e-02 -1.62e-01 -2.45e-01 -2.88e-01   ph/cm2/s
      90%_error_hi   1.35e-01  8.65e-02  7.00e-02  2.03e-01  2.46e-01  2.90e-01   ph/cm2/s

Fluence        CPL   2.31e-07  3.09e-07  3.17e-07  7.29e-07  1.03e-06  1.53e-06   erg/cm2
      90%_error_low -3.14e-08 -4.86e-08 -4.41e-08 -1.11e-07 -1.59e-07 -2.77e-07   erg/cm2
      90%_error_hi   1.82e-08  4.47e-08  3.83e-08  6.90e-08  1.52e-07  2.11e-07   erg/cm2
Peak flux      CPL   3.56e-01  5.02e-01  4.10e-01  2.43e-01  1.41e+00  1.51e+00   ph/cm2/s
      90%_error_low -1.60e-01 -9.86e-02 -8.80e-02 -1.38e-01 -2.59e-01 -3.11e-01   ph/cm2/s
      90%_error_hi   1.71e-01  9.95e-02  9.26e-02  3.01e-01  2.57e-01  4.14e-01   ph/cm2/s

======================================================================
Image
Pre-slew 15.0-350.0 keV image (Event data)
#   RAcent    DECcent   POSerr    Theta     Phi              Peak Cts       SNR   Name
   42.0409    14.7513   0.0078    40.8451   -42.2657         2.7397407     24.593 TRIG_00213934

Foreground time interval of the image:
 -0.756  37.096 (delta_t =  37.852 [sec])
Background time interval of the image:
-239.376  -0.756 (delta_t = 238.620 [sec])
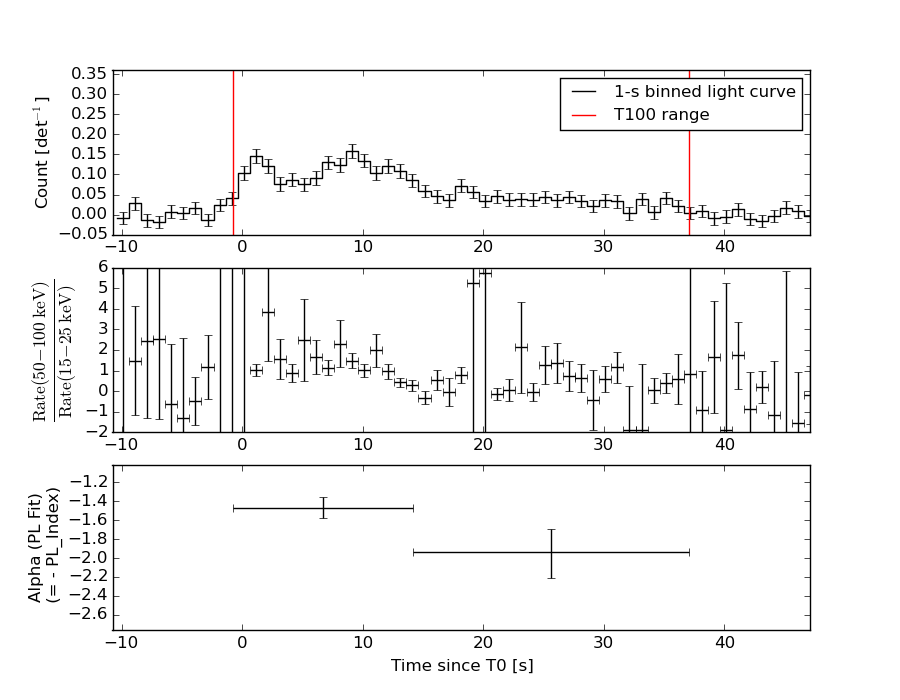
Light Curves
Note: The mask-weighted lightcurves have units of either count/det or counts/sec/det, where a det is 0.4 x 0.4 = 0.16 sq cm.
Full-time range; 1 s binning
Other quick-look light curves:
- 64 ms binning (zoomed)
- 16 ms binning (zoomed)
- 8 ms binning (zoomed)
- 2 ms binning (zoomed)
- SN=5 or 10 s binning (full-time range)
- Raw light curve
Spectra
- 64 ms binning (zoomed)
- 16 ms binning (zoomed)
- 8 ms binning (zoomed)
- 2 ms binning (zoomed)
- SN=5 or 10 s binning (full-time range)
- Raw light curve
Spectra
Notes:
- 1) The fitting includes the systematic errors.
- 2) When the burst includes telescope slew time periods, the fitting uses an average response file made from multiple 5-s response files through out the slew time plus single time preiod for the non-slew times, and weighted by the total counts in the corresponding time period using addrmf. An average response file is needed becuase a spectral fit using the pre-slew DRM will introduce some errors in both a spectral shape and a normalization if the PHA file contains a lot of the slew/post-slew time interval.
- 3) For fits to more complicated models (e.g. a power-law over a cutoff power-law), the BAT team has decided to require a chi-square improvement of more than 6 for each extra dof.
Time averaged spectrum fit using the average DRM
Power-law model
Time interval is from   -0.756 sec. to   37.096 sec.

Spectral model in power-law:
------------------------------------------------------------
Parameters  : value       lower 90%   higher 90%
Photon index: -1.62314     ( -0.116286   0.115142 )
Norm@50keV  : 4.68594E-03    ( -0.000312567   0.000311 )
------------------------------------------------------------
#Fit statistic : Chi-Squared =          55.23 using 59 PHA bins.
# Reduced chi-squared =         0.9689 for     57 degrees of freedom
# Null hypothesis probability =   5.418840e-01

Photon flux (15-150 keV)    in 37.85 sec: 0.606583 ( -0.04022  0.040287 ) ph/cm2/s
Energy fluence (15-150 keV)             : 1.65446e-06 ( -1.1738e-07  1.18164e-07 ) ergs/cm2
Cutoff power-law model
Time interval is from   -0.756 sec. to   37.096 sec.
Spectral model in the cutoff power-law:
------------------------------------------------------------
Parameters  : value       lower 90%   higher 90%
Photon index: -1.51887     ( -0.209864   0.436629 )
Epeak [keV] : 229.627      ( -229.629 -229.629 )
Norm@50keV  : 5.29553E-03    ( -0.00128878   0.00341516 )
------------------------------------------------------------
#Fit statistic : Chi-Squared =          55.04 using 59 PHA bins.
# Reduced chi-squared =         0.9828 for     56 degrees of freedom
# Null hypothesis probability =   5.113657e-01

Photon flux (15-150 keV)    in 37.85 sec: 0.603508 ( -0.041902  0.041861 ) ph/cm2/s
Energy fluence (15-150 keV)             : 1.03485e-06 ( -1.59346e-07  1.5195e-07 ) ergs/cm2
1-s peak spectrum fit
Power-law model
Time interval is from    8.640 sec. to    9.640 sec.

Spectral model in power-law:
------------------------------------------------------------
Parameters  : value       lower 90%   higher 90%
Photon index: -1.37694     ( -0.273358   0.270636 )
Norm@50keV  : 1.21225E-02    ( -0.00196005   0.00195783 )
------------------------------------------------------------
#Fit statistic : Chi-Squared =          67.73 using 59 PHA bins.
# Reduced chi-squared =          1.188 for     57 degrees of freedom
# Null hypothesis probability =   1.562446e-01

Photon flux (15-150 keV)    in 1 sec: 1.46878 ( -0.24495  0.24592 ) ph/cm2/s
Energy fluence (15-150 keV)             : 1.17717e-07 ( -2.06034e-08  2.07639e-08 ) ergs/cm2
Cutoff power-law model
Time interval is from    8.640 sec. to    9.640 sec.
Spectral model in the cutoff power-law:
------------------------------------------------------------
Parameters  : value       lower 90%   higher 90%
Photon index: -0.530363     ( -0.962911   1.4322 )
Epeak [keV] : 99.0331      ( -29.53 -99.0722 )
Norm@50keV  : 2.90880E-02    ( -0.0180585   0.0838093 )
------------------------------------------------------------
#Fit statistic : Chi-Squared =          65.97 using 59 PHA bins.
# Reduced chi-squared =          1.178 for     56 degrees of freedom
# Null hypothesis probability =   1.701442e-01

Photon flux (15-150 keV)    in 1 sec: 1.41316 ( -0.2586  0.25708 ) ph/cm2/s
Energy fluence (15-150 keV)             : 1.14665e-07 ( -2.10706e-08  2.12414e-08 ) ergs/cm2
Time-resolved spectra
Distribution
T90 vs. Hardness ratio plot
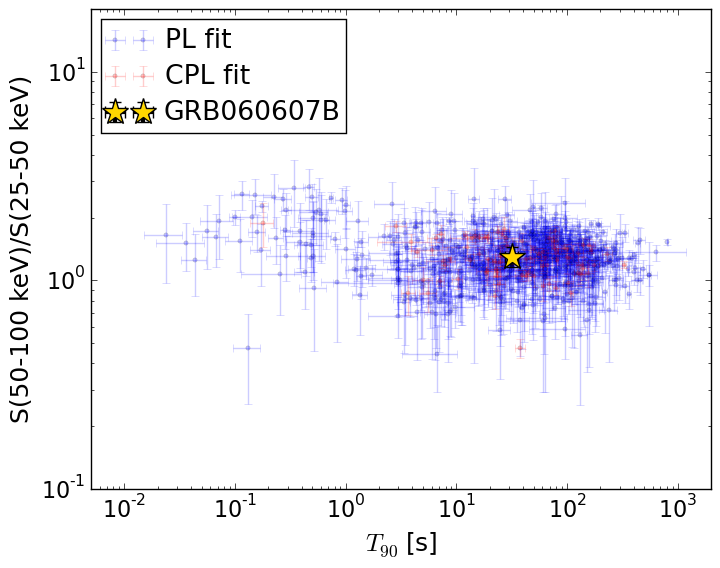
T90                                   = 31.584 sec.
Hardness ratio (energy fluence ratio) = 1.29855388158
S(15-50 keV) vs. S(50-150 keV) plot
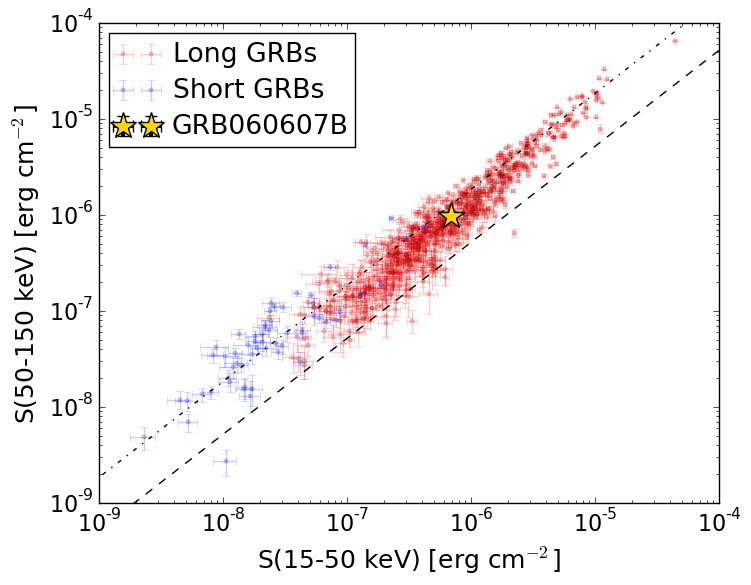
S(15-50 keV)  = 6.876082e-07
S(50-150 keV) = 9.668756e-07
The dash-dotted line and the dashed line traces the fluences calculated from the Band function with Epeak = 15 and 150 keV, respectively. Both lines assume a canonical values of alpha = -1 and beta = -2.5.
Mask shadow pattern
IMX = 6.397969315378035E-01, IMY = 5.814696975838327E-01
Spacecraft aspect plot
Bright source in the pre-burst/pre-slew/post-slew images
Pre-burst image of 15-350 keV band
Time interval of the image:
-239.376000 -0.756000

# RAcent  DECcent POSerr Theta    Phi  PeakCts   SNR AngSep     Name
#  [deg]    [deg]    ['] [deg]  [deg]                   [']
326.1747  38.3672    5.3  32.4  105.1   0.6584   2.2    2.7	Cyg X-2
  1.8166  -5.1477    2.3  50.3   20.6   2.6963   5.0  327.5	UNKNOWN
 19.2680   0.2904    3.0  45.3   -3.2   1.1075   3.9 ------	UNKNOWN
212.9160  76.0105    3.0  58.3 -175.5   3.7405   3.8 ------	UNKNOWN
Pre-slew background subtracted image of 15-350 keV band
Time interval of the image:
-0.756000 37.096000

# RAcent  DECcent POSerr Theta    Phi  PeakCts   SNR AngSep     Name
#  [deg]    [deg]    ['] [deg]  [deg]                   [']
326.3373  38.3967    7.5  32.3  105.0  -0.1736  -1.5    9.0	Cyg X-2
 42.0408  14.7512    0.5  40.8  -42.3   2.7401  24.6 ------	UNKNOWN
Post-slew image of 15-350 keV band
Time interval of the image:
376.024600 962.687300

# RAcent  DECcent POSerr Theta    Phi  PeakCts   SNR AngSep     Name
#  [deg]    [deg]    ['] [deg]  [deg]                   [']
135.5667 -40.5447    1.5  42.9  165.9   5.1313   7.6    1.8	Vela X-1
110.4684 -29.6773    2.4  47.9 -162.1   2.9952   4.8 ------	UNKNOWN