Analysis Summary
Notes:
- 1) No attempt has been made to eliminate the non-significant decimal places.
- 2) This batgrbproduct analysis is done using the HEASARC data.
- 3) This batgrbproduct analysis is using the flight position for the mask-weighting calculation.
======================================================================
                  BAT GRB EVENT DATA PROCESSING REPORT
    Process Script Ver: batgrbproduct v2.46
    Process Start Time: Wed Jan 22 15:22:50 EST 2014
             Host Name: batevent1
   Current Working Dir: /local/data/batevent/batevent_reproc/trigger214805
======================================================================

  Trigger: 00214805      Segment: 000

  BAT Trigger Time: 171981829.76   [s; MET]
      Trigger Stop: 171981830.784   [s; MET]
               UTC: 2006-06-14T12:43:48.504600    [includes UTCF correction]
       Where From?: TDRSS position message

  BAT
    RA: 320.86249529876   Dec: -53.034119723373  [deg; J2000]

     Catalogged Source?: NO
     Point Source?:      YES
     GRB Indicated?:     YES    [ by BAT flight software ]
     Image S/N Ratio:    18.45
     Image Trigger?:     NO
     Rate S/N Ratio:     68.3885955404847  [ if not an image trigger ]
     Image S/N Ratio:    18.45

  Analysis Position:   [ source = BAT ]
    RA: 320.86249529876   Dec: -53.034119723373  [deg; J2000]

  Refined Position:   [ source = BAT pre-slew burst ]
    RA: 320.875176367126   Dec: -53.0260861931081  [deg; J2000]
        { 21h 23m 30.0s , -53d 01' 33.9" }
         +/- 0.903491612900429 [arcmin] (estimated 90% radius based on SNR)
         +/- 0.382501394688967 [arcmin] (formal 1-sigma fit error)
    SNR: 35.1628376245641

  Angular difference between the analysis and refined position is 0.664616 arcmin

  Partial Coding Fraction: 0.15625    [ including projection effects ]

  Duration
     T90: 109.104000002146 +/- 3.37283737294577
        Measured from: 0.332000017166138
                   to: 109.436000019312     [s; relative to TRIGTIME]
     T50: 43.2360000312328 +/- 0.772155427209394
        Measured from: 21.1159999966621
                   to: 64.352000027895     [s; relative to TRIGTIME]


  Fluence
     Peak Flux  (peak 1 second)
        Measured from: -1.32400000095367
                   to: -0.324000000953674     [s; relative to TRIGTIME]
     Total Fluence
        Measured from: -1.49599999189377
                   to: 179.080000013113     [s; relative to TRIGTIME]

             Band 1     Band 2     Band 3     Band 4
              15-25      25-50     50-100    100-350     keV
 Total    14.977030  14.255113   7.805486   1.689761
           0.120756   0.124966   0.107231   0.081957 [error]
 Peak      0.309654   0.492137   0.363293   0.109238
           0.021436   0.025371   0.023206   0.016656 [error]

     [ fluence units of on-axis counts / fully illuminated detector ]

======================================================================


====== Table of the duration information =============================

        Value   tstart    tstop
T100  180.576   -1.496  179.080
T90   109.104    0.332  109.436
T50    43.236   21.116   64.352
Peak    1.000   -1.324   -0.324


====== Spectral Analysis Summary =====================================

Model      : spectral model: simple power-law (PL) and cutoff power-law (CPL)
Ph_index   : photon index: E^{Ph_index}
Ph_90err   : 90% error of the photon index
Epeak      : Epeak in keV
Epeak_90err: 90% error of Epeak
Norm       : normalization at 50 keV in both the PL model and CPL model
Nomr_90err : 90% error of the normalization
chi2       : Chi-Squared
dof        : degree of freedo

=== Time-averaged spectral analysis ===
(Best model with acceptable fit: CPL)

Model Ph_index Ph_90err_low Ph_90err_hi  Epeak  Epeak_90err_low  Epeak_90err_hi  Norm       Nomr_90err_low    Norm_90err_hi    chi2    dof
PL      -2.037    -0.037      0.037       -           -               -         1.24e-02     -2.09e-04          2.09e-04      48.380   57
CPL     -2.225    -0.229      0.025       98.520      -3.531        59.765      1.03e-02     -1.68e-03          2.56e-04      35.780   56


=== 1-s peak spectral analysis ===
(Best model with acceptable fit: PL)

Model Ph_index Ph_90err_low Ph_90err_hi  Epeak  Epeak_90err_low  Epeak_90err_hi  Norm       Nomr_90err_low    Norm_90err_hi    chi2    dof
PL      -1.598     -0.104     0.102       -           -               -         8.95e-02     -5.44e-03          5.42e-03      52.440   57
CPL     -1.382     -0.269     0.430      147.910     -67.123      -147.910      1.15e-01     -2.93e-02          7.06e-02      51.600   56


=== Fluence/Peak Flux Summary ===

              Model    Band1     Band2     Band3     Band4     Band5     Total
                       15-25     25-50    50-100    100-350    15-150    15-350    keV
Fluence         PL   4.76e-06  6.31e-06  6.16e-06  1.07e-05  2.08e-05  2.80e-05   erg/cm2
      90%_error_low -1.79e-07 -1.30e-07 -1.32e-07 -5.45e-07 -3.51e-07 -5.93e-07   erg/cm2
      90%_error_hi   1.82e-07  1.30e-07  1.32e-07  5.65e-07  3.51e-07  6.03e-07   erg/cm2
Peak flux       PL   4.05e+00  3.84e+00  2.54e+00  2.61e+00  1.15e+01  1.30e+01   ph/cm2/s
      90%_error_low -4.08e-01 -2.44e-01 -1.93e-01 -3.84e-01 -7.04e-01 -7.70e-01   ph/cm2/s
      90%_error_hi   4.21e-01  2.43e-01  1.92e-01  4.20e-01  7.05e-01  7.71e-01   ph/cm2/s

Fluence        CPL   5.04e-06  5.85e-06  5.09e-06  9.72e-06  1.88e-05  2.73e-05   erg/cm2
      90%_error_low -2.11e-07 -3.10e-07 -6.12e-07 -2.48e-06 -1.33e-06 -4.93e-06   erg/cm2
      90%_error_hi   2.18e-07  3.28e-07  6.89e-07  1.77e-06  1.46e-06  1.05e-06   erg/cm2
Peak flux      CPL   3.88e+00  3.92e+00  2.60e+00  2.06e+00  1.14e+01  1.25e+01   ph/cm2/s
      90%_error_low -5.00e-01 -2.80e-01 -2.19e-01 -7.20e-01 -7.26e-01 -1.07e+00   ph/cm2/s
      90%_error_hi   5.11e-01  2.86e-01  2.23e-01  6.83e-01  7.29e-01  1.09e+00   ph/cm2/s

======================================================================
Image
Pre-slew 15.0-350.0 keV image (Event data)
#   RAcent    DECcent   POSerr    Theta     Phi              Peak Cts       SNR   Name
  320.8752   -53.0261   0.0055    44.1310    34.1709         7.4414648     35.163 TRIG_00214805

Foreground time interval of the image:
 -1.496  14.941 (delta_t =  16.437 [sec])
Background time interval of the image:
-239.760  -1.496 (delta_t = 238.264 [sec])
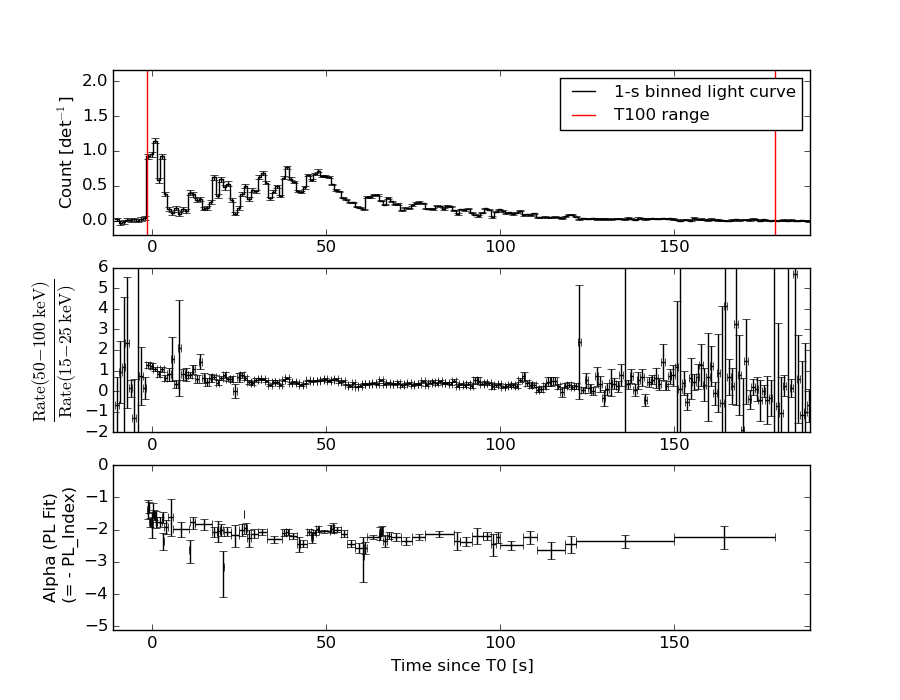
Light Curves
Note: The mask-weighted lightcurves have units of either count/det or counts/sec/det, where a det is 0.4 x 0.4 = 0.16 sq cm.
Full-time range; 1 s binning
Other quick-look light curves:
- 64 ms binning (zoomed)
- 16 ms binning (zoomed)
- 8 ms binning (zoomed)
- 2 ms binning (zoomed)
- SN=5 or 10 s binning (full-time range)
- Raw light curve
Spectra
- 64 ms binning (zoomed)
- 16 ms binning (zoomed)
- 8 ms binning (zoomed)
- 2 ms binning (zoomed)
- SN=5 or 10 s binning (full-time range)
- Raw light curve
Spectra
Notes:
- 1) The fitting includes the systematic errors.
- 2) When the burst includes telescope slew time periods, the fitting uses an average response file made from multiple 5-s response files through out the slew time plus single time preiod for the non-slew times, and weighted by the total counts in the corresponding time period using addrmf. An average response file is needed becuase a spectral fit using the pre-slew DRM will introduce some errors in both a spectral shape and a normalization if the PHA file contains a lot of the slew/post-slew time interval.
- 3) For fits to more complicated models (e.g. a power-law over a cutoff power-law), the BAT team has decided to require a chi-square improvement of more than 6 for each extra dof.
Time averaged spectrum fit using the average DRM
Power-law model
Time interval is from   -1.496 sec. to  179.080 sec.

Spectral model in power-law:
------------------------------------------------------------
Parameters  : value       lower 90%   higher 90%
Photon index: -2.03655     ( -0.0367046   0.0365574 )
Norm@50keV  : 1.24314E-02    ( -0.000209102   0.000209085 )
------------------------------------------------------------
#Fit statistic : Chi-Squared =          48.38 using 59 PHA bins.
# Reduced chi-squared =         0.8488 for     57 degrees of freedom
# Null hypothesis probability =   7.848226e-01

Photon flux (15-150 keV)    in 180.6 sec: 1.89689 ( -0.04454  0.04494 ) ph/cm2/s
Energy fluence (15-150 keV)             : 2.07538e-05 ( -3.50655e-07  3.50801e-07 ) ergs/cm2
Cutoff power-law model
Time interval is from   -1.496 sec. to  179.080 sec.
Spectral model in the cutoff power-law:
------------------------------------------------------------
Parameters  : value       lower 90%   higher 90%
Photon index: -2.33242     ( -0.105842   0.148298 )
Epeak [keV] : 134.112      ( -39.0985 24.1974 )
Norm@50keV  : 9.47830E-03    ( -0.000861786   0.00107307 )
------------------------------------------------------------
#Fit statistic : Chi-Squared =          33.99 using 59 PHA bins.
# Reduced chi-squared =         0.6069 for     56 degrees of freedom
# Null hypothesis probability =   9.912074e-01

Photon flux (15-150 keV)    in 180.6 sec: 1.83976 ( -0.07162  0.07295 ) ph/cm2/s
Energy fluence (15-150 keV)             : 1.88286e-05 ( -1.33147e-06  1.45556e-06 ) ergs/cm2
1-s peak spectrum fit
Power-law model
Time interval is from   -1.324 sec. to   -0.324 sec.

Spectral model in power-law:
------------------------------------------------------------
Parameters  : value       lower 90%   higher 90%
Photon index: -1.59796     ( -0.10353   0.10219 )
Norm@50keV  : 8.94811E-02    ( -0.00544234   0.00542329 )
------------------------------------------------------------
#Fit statistic : Chi-Squared =          52.44 using 59 PHA bins.
# Reduced chi-squared =         0.9201 for     57 degrees of freedom
# Null hypothesis probability =   6.464515e-01

Photon flux (15-150 keV)    in 1 sec: 11.4918 ( -0.7037  0.7048 ) ph/cm2/s
Energy fluence (15-150 keV)             : 8.37163e-07 ( -5.42022e-08  5.44163e-08 ) ergs/cm2
Cutoff power-law model
Time interval is from   -1.324 sec. to   -0.324 sec.
Spectral model in the cutoff power-law:
------------------------------------------------------------
Parameters  : value       lower 90%   higher 90%
Photon index: -1.38245     ( -0.269338   0.429706 )
Epeak [keV] : 147.910      ( -67.1274 -147.914 )
Norm@50keV  : 0.114506    ( -0.0292836   0.0705796 )
------------------------------------------------------------
#Fit statistic : Chi-Squared =          51.60 using 59 PHA bins.
# Reduced chi-squared =         0.9214 for     56 degrees of freedom
# Null hypothesis probability =   6.420733e-01

Photon flux (15-150 keV)    in 1 sec: 11.3880 ( -0.7259  0.7292 ) ph/cm2/s
Energy fluence (15-150 keV)             : 8.27504e-07 ( -5.76648e-08  5.73263e-08 ) ergs/cm2
Time-resolved spectra
Distribution
T90 vs. Hardness ratio plot
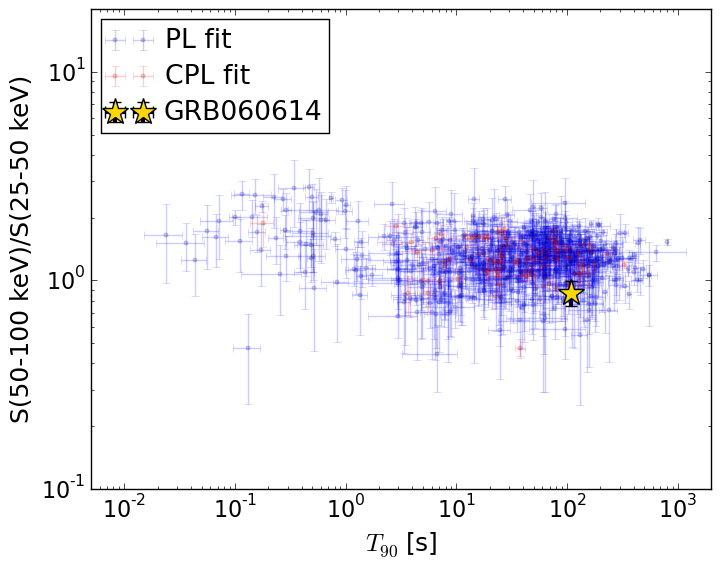
T90                                   = 109.104 sec.
Hardness ratio (energy fluence ratio) = 0.870542377426
S(15-50 keV) vs. S(50-150 keV) plot
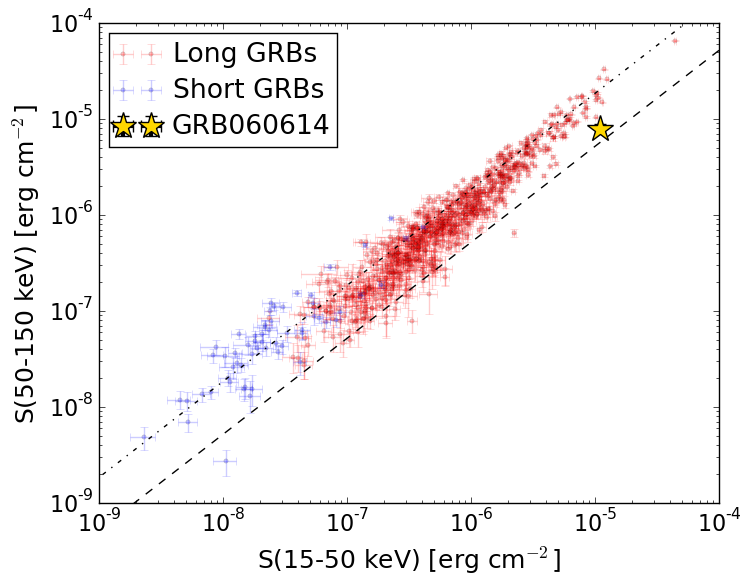
S(15-50 keV)  = 1.0886427e-05
S(50-150 keV) = 7.912057e-06
The dash-dotted line and the dashed line traces the fluences calculated from the Band function with Epeak = 15 and 150 keV, respectively. Both lines assume a canonical values of alpha = -1 and beta = -2.5.
Mask shadow pattern
IMX = 8.026413408118448E-01, IMY = -5.448789100544709E-01
Spacecraft aspect plot
Bright source in the pre-burst/pre-slew/post-slew images
Pre-burst image of 15-350 keV band
Time interval of the image:
-239.760000 -1.496000

# RAcent  DECcent POSerr Theta    Phi  PeakCts   SNR AngSep     Name
#  [deg]    [deg]    ['] [deg]  [deg]                   [']
326.2800  38.3693    9.4  50.3 -171.2   0.4745   1.2    5.8	Cyg X-2
300.0699 -29.6653    2.8  39.4   76.0   2.4648   4.2 ------	UNKNOWN
 28.8172 -50.6670    2.8  57.8  -15.9   3.1134   4.1 ------	UNKNOWN
 29.8613 -28.4624    3.4  52.1  -42.2   3.0662   3.4 ------	UNKNOWN
Pre-slew background subtracted image of 15-350 keV band
Time interval of the image:
-1.496000 14.940590

# RAcent  DECcent POSerr Theta    Phi  PeakCts   SNR AngSep     Name
#  [deg]    [deg]    ['] [deg]  [deg]                   [']
326.2619  38.3674    8.9  50.3 -171.2  -0.1299  -1.3    5.1	Cyg X-2
297.0859  21.6184    3.6  51.1  149.6   0.7025   3.2 ------	UNKNOWN
320.8752 -53.0261    0.3  44.1   34.2   7.4416  35.2 ------	UNKNOWN
303.5568   4.8176    2.8  37.1  133.4   0.4816   4.1 ------	UNKNOWN
349.8328  32.6791    2.5  45.2 -145.0   0.3397   4.6 ------	UNKNOWN
  6.8129  23.4731    2.2  44.9 -120.1   0.8123   5.2 ------	UNKNOWN
Post-slew image of 15-350 keV band
Time interval of the image:
80.340590 482.320000

# RAcent  DECcent POSerr Theta    Phi  PeakCts   SNR AngSep     Name
#  [deg]    [deg]    ['] [deg]  [deg]                   [']
264.7984 -44.4279   13.8  36.9   69.3   1.9539   0.8    2.7	4U 1735-44
276.1027 -30.4229   15.0  39.4   96.1  -2.4561  -0.8    9.8	H1820-303
285.0043 -25.0440   10.3  38.7  111.2  -2.9865  -1.1    7.6	HT1900.1-2455
264.4403 -59.0110    2.6  31.1   45.3   5.4591   4.3 ------	UNKNOWN
217.8149 -71.2094    2.3  44.5   15.7   8.3265   5.0 ------	UNKNOWN
320.9232 -53.0304    1.6   0.1 -122.1   5.1790   7.2 ------	UNKNOWN
250.2160 -85.8225    4.1  35.7   -4.2   2.7881   2.9 ------	UNKNOWN
 47.5577 -83.2779    2.3  37.1  -22.1   4.9517   5.1 ------	UNKNOWN
 11.7357 -30.1810    2.2  43.2 -112.1  14.3766   5.2 ------	UNKNOWN