Analysis Summary
Notes:
- 1) No attempt has been made to eliminate the non-significant decimal places.
- 2) This batgrbproduct analysis is done using the HEASARC data.
- 3) This batgrbproduct analysis is using the flight position for the mask-weighting calculation.
======================================================================
BAT GRB EVENT DATA PROCESSING REPORT
Process Script Ver: batgrbproduct v2.46
Process Start Time: Wed Jan 22 15:14:31 EST 2014
Host Name: batevent1
Current Working Dir: /local/data/batevent/batevent_reproc/trigger217805
======================================================================
Trigger: 00217805 Segment: 000
BAT Trigger Time: 174053760.32 [s; MET]
Trigger Stop: 174053760.832 [s; MET]
UTC: 2006-07-08T12:15:59.016080 [includes UTCF correction]
Where From?: TDRSS position message
BAT
RA: 7.79827043596902 Dec: -33.7296918247416 [deg; J2000]
Catalogged Source?: NO
Point Source?: YES
GRB Indicated?: YES [ by BAT flight software ]
Image S/N Ratio: 8.22
Image Trigger?: NO
Rate S/N Ratio: 18.1383571472171 [ if not an image trigger ]
Image S/N Ratio: 8.22
Analysis Position: [ source = BAT ]
RA: 7.79827043596902 Dec: -33.7296918247416 [deg; J2000]
Refined Position: [ source = BAT pre-slew burst ]
RA: 7.82161075809609 Dec: -33.7481150416323 [deg; J2000]
{ 00h 31m 17.2s , -33d 44' 53.2" }
+/- 1.00848487799393 [arcmin] (estimated 90% radius based on SNR)
+/- 0.338829369407037 [arcmin] (formal 1-sigma fit error)
SNR: 30.0522085242426
Angular difference between the analysis and refined position is 1.605642 arcmin
Partial Coding Fraction: 1 [ including projection effects ]
Duration
T90: 10.027999997139 +/- 3.67214813462298
Measured from: 0.15200001001358
to: 10.1800000071526 [s; relative to TRIGTIME]
T50: 3.27200001478195 +/- 0.551144267679184
Measured from: 1.34000000357628
to: 4.61200001835823 [s; relative to TRIGTIME]
Fluence
Peak Flux (peak 1 second)
Measured from: 1.12000000476837
to: 2.12000000476837 [s; relative to TRIGTIME]
Total Fluence
Measured from: -0.259999990463257
to: 14.1759999990463 [s; relative to TRIGTIME]
Band 1 Band 2 Band 3 Band 4
15-25 25-50 50-100 100-350 keV
Total 0.264268 0.326090 0.225649 0.047052
0.017672 0.018340 0.016054 0.013494 [error]
Peak 0.050126 0.098873 0.073393 0.020221
0.005198 0.005891 0.005180 0.003898 [error]
[ fluence units of on-axis counts / fully illuminated detector ]
======================================================================
====== Table of the duration information =============================
Value tstart tstop
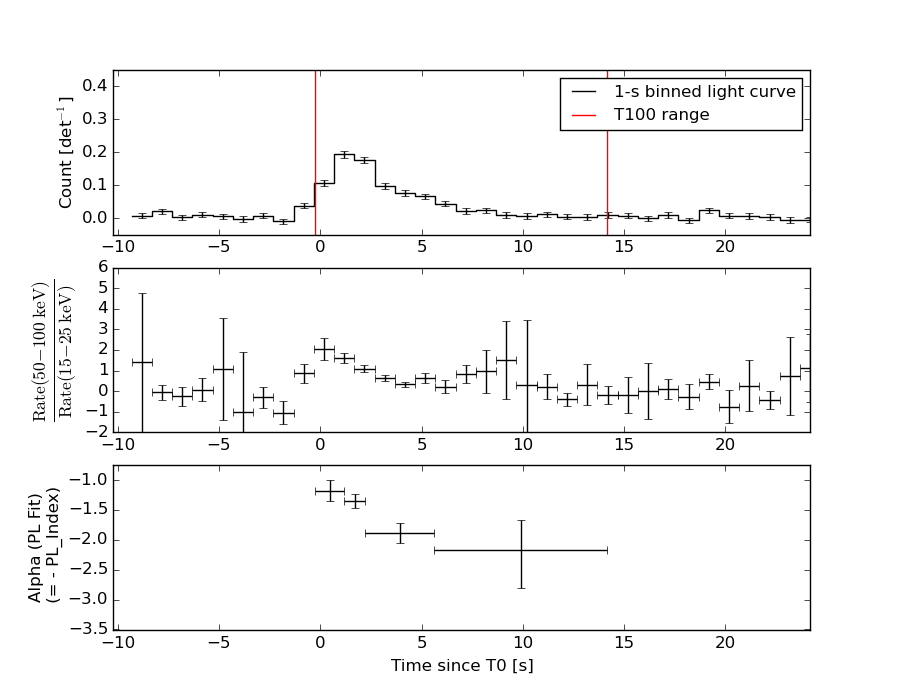
T100 14.436 -0.260 14.176
T90 10.028 0.152 10.180
T50 3.272 1.340 4.612
Peak 1.000 1.120 2.120
====== Spectral Analysis Summary =====================================
Model : spectral model: simple power-law (PL) and cutoff power-law (CPL)
Ph_index : photon index: E^{Ph_index}
Ph_90err : 90% error of the photon index
Epeak : Epeak in keV
Epeak_90err: 90% error of Epeak
Norm : normalization at 50 keV in both the PL model and CPL model
Nomr_90err : 90% error of the normalization
chi2 : Chi-Squared
dof : degree of freedo
=== Time-averaged spectral analysis ===
(Best model with acceptable fit: PL)
Model Ph_index Ph_90err_low Ph_90err_hi Epeak Epeak_90err_low Epeak_90err_hi Norm Nomr_90err_low Norm_90err_hi chi2 dof
PL -1.641 -0.118 0.117 - - - 3.71e-03 -2.58e-04 2.56e-04 60.900 57
CPL -1.220 -0.442 0.495 88.948 -25.802 -88.948 6.14e-03 -2.48e-03 4.82e-03 58.290 56
=== 1-s peak spectral analysis ===
(Best model with acceptable fit: PL)
Model Ph_index Ph_90err_low Ph_90err_hi Epeak Epeak_90err_low Epeak_90err_hi Norm Nomr_90err_low Norm_90err_hi chi2 dof
PL -1.331 -0.118 0.118 - - - 1.59e-02 -1.12e-03 1.12e-03 59.820 57
CPL -0.845 -0.470 0.527 121.922 -39.508 1108.528 2.78e-02 -1.13e-02 2.23e-02 56.680 56
=== Fluence/Peak Flux Summary ===
Model Band1 Band2 Band3 Band4 Band5 Total
15-25 25-50 50-100 100-350 15-150 15-350 keV
Fluence PL 7.80e-08 1.32e-07 1.69e-07 4.35e-07 4.99e-07 8.14e-07 erg/cm2
90%_error_low -8.17e-09 -8.65e-09 -1.58e-08 -8.00e-08 -3.70e-08 -9.46e-08 erg/cm2
90%_error_hi 8.40e-09 8.64e-09 1.58e-08 9.15e-08 3.74e-08 1.04e-07 erg/cm2
Peak flux PL 5.57e-01 6.20e-01 4.93e-01 6.49e-01 1.91e+00 2.32e+00 ph/cm2/s
90%_error_low -6.84e-02 -4.82e-02 -4.19e-02 -1.07e-01 -1.36e-01 -1.68e-01 ph/cm2/s
90%_error_hi 7.10e-02 4.79e-02 4.16e-02 1.19e-01 1.36e-01 1.69e-01 ph/cm2/s
Fluence CPL 7.32e-08 1.37e-07 1.71e-07 2.29e-07 4.80e-07 6.11e-07 erg/cm2
90%_error_low -9.67e-09 -1.06e-08 -1.68e-08 -1.06e-07 -4.15e-08 -1.15e-07 erg/cm2
90%_error_hi 9.77e-09 1.09e-08 1.70e-08 2.19e-07 4.18e-08 2.24e-07 erg/cm2
Peak flux CPL 5.09e-01 6.49e-01 5.16e-01 3.82e-01 1.88e+00 2.06e+00 ph/cm2/s
90%_error_low -8.15e-02 -5.62e-02 -4.79e-02 -1.48e-01 -1.40e-01 -2.08e-01 ph/cm2/s
90%_error_hi 8.39e-02 5.77e-02 4.87e-02 2.59e-01 1.40e-01 2.80e-01 ph/cm2/s
======================================================================
Image
Pre-slew 15.0-350.0 keV image (Event data)
#   RAcent    DECcent   POSerr    Theta     Phi              Peak Cts       SNR   Name
    7.8216   -33.7481   0.0064    18.5157   -12.0979         0.8527661     30.052 TRIG_00217805

Foreground time interval of the image:
 -0.260  10.181 (delta_t =  10.441 [sec])
Background time interval of the image:
-239.320  -0.260 (delta_t = 239.060 [sec])
Light Curves
Note: The mask-weighted lightcurves have units of either count/det or counts/sec/det, where a det is 0.4 x 0.4 = 0.16 sq cm.
Full-time range; 1 s binning
Other quick-look light curves:
- 64 ms binning (zoomed)
- 16 ms binning (zoomed)
- 8 ms binning (zoomed)
- 2 ms binning (zoomed)
- SN=5 or 10 s binning (full-time range)
- Raw light curve
Spectra
- 64 ms binning (zoomed)
- 16 ms binning (zoomed)
- 8 ms binning (zoomed)
- 2 ms binning (zoomed)
- SN=5 or 10 s binning (full-time range)
- Raw light curve
Spectra
Notes:
- 1) The fitting includes the systematic errors.
- 2) When the burst includes telescope slew time periods, the fitting uses an average response file made from multiple 5-s response files through out the slew time plus single time preiod for the non-slew times, and weighted by the total counts in the corresponding time period using addrmf. An average response file is needed becuase a spectral fit using the pre-slew DRM will introduce some errors in both a spectral shape and a normalization if the PHA file contains a lot of the slew/post-slew time interval.
- 3) For fits to more complicated models (e.g. a power-law over a cutoff power-law), the BAT team has decided to require a chi-square improvement of more than 6 for each extra dof.
Time averaged spectrum fit using the average DRM
Power-law model
Time interval is from   -0.260 sec. to   14.176 sec.

Spectral model in power-law:
------------------------------------------------------------
Parameters  : value       lower 90%   higher 90%
Photon index: -1.64057     ( -0.118324   0.116532 )
Norm@50keV  : 3.70845E-03    ( -0.000257961   0.000255974 )
------------------------------------------------------------
#Fit statistic : Chi-Squared =          60.90 using 59 PHA bins.
# Reduced chi-squared =          1.068 for     57 degrees of freedom
# Null hypothesis probability =   3.373225e-01

Photon flux (15-150 keV)    in 14.44 sec: 0.482756 ( -0.03163  0.031659 ) ph/cm2/s
Energy fluence (15-150 keV)             : 4.98583e-07 ( -3.70133e-08  3.7383e-08 ) ergs/cm2
Cutoff power-law model
Time interval is from   -0.260 sec. to   14.176 sec.
Spectral model in the cutoff power-law:
------------------------------------------------------------
Parameters  : value       lower 90%   higher 90%
Photon index: -1.21956     ( -0.441972   0.495065 )
Epeak [keV] : 88.9476      ( -25.8019 -88.9476 )
Norm@50keV  : 6.14165E-03    ( -0.00247883   0.00482136 )
------------------------------------------------------------
#Fit statistic : Chi-Squared =          58.29 using 59 PHA bins.
# Reduced chi-squared =          1.041 for     56 degrees of freedom
# Null hypothesis probability =   3.910468e-01

Photon flux (15-150 keV)    in 14.44 sec: 0.472595 ( -0.033385  0.033364 ) ph/cm2/s
Energy fluence (15-150 keV)             : 4.80404e-07 ( -4.14825e-08  4.18321e-08 ) ergs/cm2
1-s peak spectrum fit
Power-law model
Time interval is from    1.120 sec. to    2.120 sec.

Spectral model in power-law:
------------------------------------------------------------
Parameters  : value       lower 90%   higher 90%
Photon index: -1.33091     ( -0.118322   0.118367 )
Norm@50keV  : 1.59181E-02    ( -0.00111959   0.00111841 )
------------------------------------------------------------
#Fit statistic : Chi-Squared =          59.82 using 59 PHA bins.
# Reduced chi-squared =          1.049 for     57 degrees of freedom
# Null hypothesis probability =   3.737892e-01

Photon flux (15-150 keV)    in 1 sec: 1.91033 ( -0.13601  0.13613 ) ph/cm2/s
Energy fluence (15-150 keV)             : 1.56167e-07 ( -1.22176e-08  1.22981e-08 ) ergs/cm2
Cutoff power-law model
Time interval is from    1.120 sec. to    2.120 sec.
Spectral model in the cutoff power-law:
------------------------------------------------------------
Parameters  : value       lower 90%   higher 90%
Photon index: -0.844645     ( -0.469738   0.526871 )
Epeak [keV] : 121.922      ( -39.5077 1108.53 )
Norm@50keV  : 2.77833E-02    ( -0.0113414   0.02231 )
------------------------------------------------------------
#Fit statistic : Chi-Squared =          56.68 using 59 PHA bins.
# Reduced chi-squared =          1.012 for     56 degrees of freedom
# Null hypothesis probability =   4.493155e-01

Photon flux (15-150 keV)    in 1 sec: 1.87576 ( -0.14025  0.14017 ) ph/cm2/s
Energy fluence (15-150 keV)             : 6.89446e-08 ( -1.3761e-08  1.25014e-08 ) ergs/cm2
Time-resolved spectra
Distribution
T90 vs. Hardness ratio plot
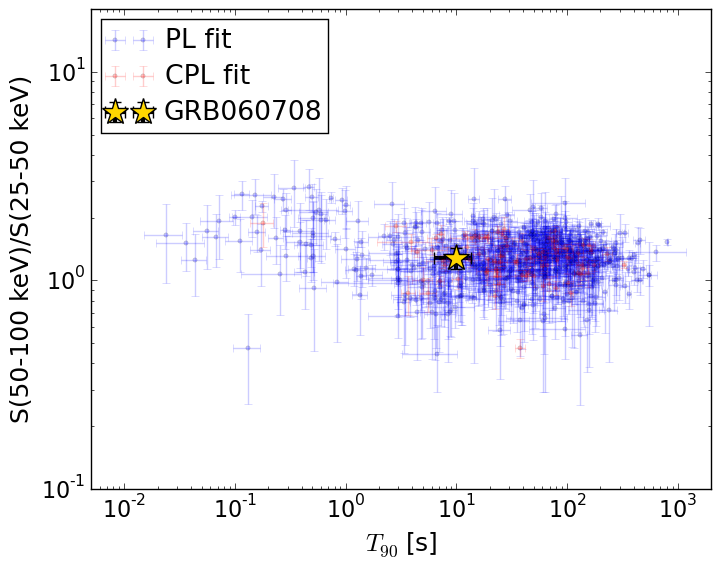
T90                                   = 10.028 sec.
Hardness ratio (energy fluence ratio) = 1.28295089641
S(15-50 keV) vs. S(50-150 keV) plot
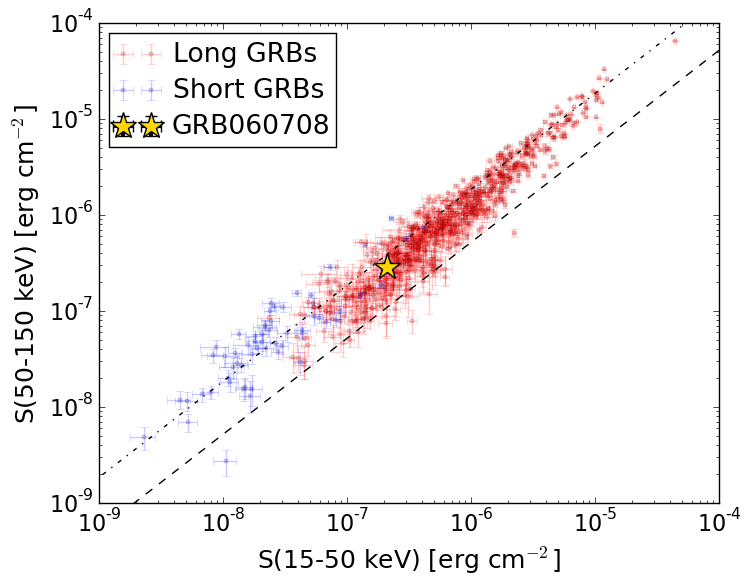
S(15-50 keV)  = 2.096344e-07
S(50-150 keV) = 2.889557e-07
The dash-dotted line and the dashed line traces the fluences calculated from the Band function with Epeak = 15 and 150 keV, respectively. Both lines assume a canonical values of alpha = -1 and beta = -2.5.
Mask shadow pattern
IMX = 3.274621348539180E-01, IMY = 7.018943057258914E-02
Spacecraft aspect plot
Bright source in the pre-burst/pre-slew/post-slew images
Pre-burst image of 15-350 keV band
Time interval of the image:
-239.320000 -0.260000

# RAcent  DECcent POSerr Theta    Phi  PeakCts   SNR AngSep     Name
#  [deg]    [deg]    ['] [deg]  [deg]                   [']
333.5886  24.9389    2.3  48.6  168.2   1.8946   5.0 ------	UNKNOWN
 19.3824 -69.5483    2.7  53.4    7.5   2.6420   4.2 ------	UNKNOWN
  8.1104 -10.2665    3.0  13.1 -107.1   0.5442   3.8 ------	UNKNOWN
356.8363  41.4005    3.9  59.3 -163.2   3.4776   3.0 ------	UNKNOWN
Pre-slew background subtracted image of 15-350 keV band
Time interval of the image:
-0.260000 10.180600

# RAcent  DECcent POSerr Theta    Phi  PeakCts   SNR AngSep     Name
#  [deg]    [deg]    ['] [deg]  [deg]                   [']
  7.8217 -33.7481    0.4  18.5  -12.1   0.8526  30.0 ------	UNKNOWN
Post-slew image of 15-350 keV band
Time interval of the image:
51.380600 408.280600

# RAcent  DECcent POSerr Theta    Phi  PeakCts   SNR AngSep     Name
#  [deg]    [deg]    ['] [deg]  [deg]                   [']
339.8295 -75.4756    3.1  43.8   24.0   1.6843   3.8 ------	UNKNOWN
 66.3741 -81.4291    2.6  52.1    4.9   2.5906   4.5 ------	UNKNOWN
 27.6975 -65.2923    2.5  33.8   -0.6   1.2640   4.7 ------	UNKNOWN
 36.5486 -58.2088    2.4  31.1  -15.2   0.9895   4.8 ------	UNKNOWN
 51.2481 -65.6604    2.3  41.0  -11.4   1.4287   5.1 ------	UNKNOWN
 91.7792 -58.7525    2.9  58.7  -22.9   5.3874   3.9 ------	UNKNOWN
 50.7217 -25.6886    3.0  37.9  -76.4   2.0149   3.9 ------	UNKNOWN