Analysis Summary
Notes:
- 1) No attempt has been made to eliminate the non-significant decimal places.
- 2) This batgrbproduct analysis is done using the HEASARC data.
- 3) This batgrbproduct analysis is using the flight position for the mask-weighting calculation.
======================================================================
BAT GRB EVENT DATA PROCESSING REPORT
Process Script Ver: batgrbproduct v2.46
Process Start Time: Sat May 9 19:42:43 EDT 2015
Host Name: bat1
Current Working Dir: /local/data/bat1/alien/Swift_3rdBATcatalog/event/batevent_reproc/trigger218582
======================================================================
Trigger: 00218582 Segment: 000
BAT Trigger Time: 174431265.024 [s; MET]
Trigger Stop: 174431291.904 [s; MET]
UTC: 2006-07-12T21:07:43.711080 [includes UTCF correction]
Where From?: TDRSS position message
BAT
RA: 184.061047100022 Dec: 35.5596913631098 [deg; J2000]
Catalogged Source?: NO
Point Source?: YES
GRB Indicated?: YES [ by BAT flight software ]
Image S/N Ratio: 6.67
Image Trigger?: NO
Rate S/N Ratio: 10.3923048454133 [ if not an image trigger ]
Image S/N Ratio: 6.67
Analysis Position: [ source = BAT ]
RA: 184.061047100022 Dec: 35.5596913631098 [deg; J2000]
Refined Position: [ source = BAT pre-slew burst ]
RA: 184.062138125809 Dec: 35.5481500472195 [deg; J2000]
{ 12h 16m 14.9s , +35d 32' 53.3" }
+/- 2.37215949182318 [arcmin] (estimated 90% radius based on SNR)
+/- 1.1859363488358 [arcmin] (formal 1-sigma fit error)
SNR: 8.85520345110734
Angular difference between the analysis and refined position is 0.694524 arcmin
Partial Coding Fraction: 0.09570312 [ including projection effects ]
Duration
T90: 30.9120000004768 +/- 6.63041235721911
Measured from: 2.83200001716614
to: 33.744000017643 [s; relative to TRIGTIME]
T50: 13.7599999904633 +/- 7.10515306344147
Measured from: 12.4960000216961
to: 26.2560000121593 [s; relative to TRIGTIME]
Fluence
Peak Flux (peak 1 second)
Measured from: 16.7639999985695
to: 17.7639999985695 [s; relative to TRIGTIME]
Total Fluence
Measured from: 0.592000007629395
to: 38.7360000014305 [s; relative to TRIGTIME]
Band 1 Band 2 Band 3 Band 4
15-25 25-50 50-100 100-350 keV
Total 0.620259 0.727489 0.487346 0.208240
0.113049 0.118332 0.103771 0.088533 [error]
Peak 0.077845 0.042344 0.061181 0.026251
0.018959 0.018811 0.017213 0.014988 [error]
[ fluence units of on-axis counts / fully illuminated detector ]
======================================================================
====== Table of the duration information =============================
Value tstart tstop
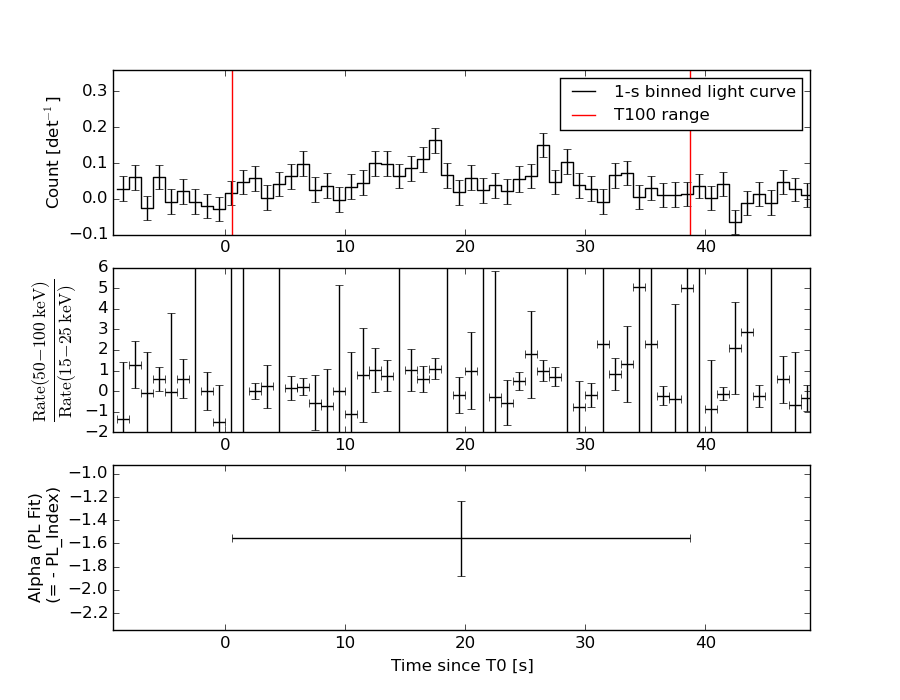
T100 38.144 0.592 38.736
T90 30.912 2.832 33.744
T50 13.760 12.496 26.256
Peak 1.000 16.764 17.764
====== Spectral Analysis Summary =====================================
Model : spectral model: simple power-law (PL) and cutoff power-law (CPL)
Ph_index : photon index: E^{Ph_index}
Ph_90err : 90% error of the photon index
Epeak : Epeak in keV
Epeak_90err: 90% error of Epeak
Norm : normalization at 50 keV in both the PL model and CPL model
Nomr_90err : 90% error of the normalization
chi2 : Chi-Squared
dof : degree of freedo
=== Time-averaged spectral analysis ===
(Best model with acceptable fit: PL)
Model Ph_index Ph_90err_low Ph_90err_hi Epeak Epeak_90err_low Epeak_90err_hi Norm Nomr_90err_low Norm_90err_hi chi2 dof
PL -1.557 -0.320 0.323 - - - 3.95e-03 -6.70e-04 6.70e-04 57.980 57
CPL -1.573 -0.305 0.343 9999.360 -9999.360 -9999.360 3.96e-03 -6.69e-04 3.20e-03 58.000 56
=== 1-s peak spectral analysis ===
(Best model with acceptable fit: N/A)
Model Ph_index Ph_90err_low Ph_90err_hi Epeak Epeak_90err_low Epeak_90err_hi Norm Nomr_90err_low Norm_90err_hi chi2 dof
PL -1.916 -0.682 0.567 - - - 1.11e-02 -4.12e-03 3.87e-03 83.010 57
CPL -1.862 -2.540 2.417 143.155 N/A N/A 1.17e-02 N/A N/A 83.010 56
=== Fluence/Peak Flux Summary ===
Model Band1 Band2 Band3 Band4 Band5 Total
15-25 25-50 50-100 100-350 15-150 15-350 keV
Fluence PL 2.03e-07 3.60e-07 4.89e-07 1.37e-06 1.42e-06 2.43e-06 erg/cm2
90%_error_low -6.40e-08 -7.11e-08 -1.05e-07 -5.58e-07 -2.52e-07 -6.42e-07 erg/cm2
90%_error_hi 7.03e-08 6.86e-08 1.02e-07 7.72e-07 2.52e-07 7.99e-07 erg/cm2
Peak flux PL 6.80e-01 5.36e-01 2.84e-01 2.19e-01 1.60e+00 1.72e+00 ph/cm2/s
90%_error_low -3.42e-01 -1.91e-01 -1.32e-01 -1.51e-01 -5.70e-01 -5.80e-01 ph/cm2/s
90%_error_hi 4.09e-01 1.86e-01 1.23e-01 2.34e-01 5.78e-01 5.84e-01 ph/cm2/s
Fluence CPL 2.14e-07 3.53e-07 N/A 1.36e-06 1.42e-06 2.39e-06 erg/cm2
90%_error_low -7.50e-08 -6.43e-08 -1.05e-07 N/A -2.57e-07 -7.94e-07 erg/cm2
90%_error_hi 5.95e-08 7.54e-08 1.02e-07 N/A 2.57e-07 8.22e-07 erg/cm2
Peak flux CPL 6.14e-01 4.15e-01 1.93e-01 1.46e-01 1.29e+00 1.38e+00 ph/cm2/s
90%_error_low N/A -4.15e-01 -1.93e-01 N/A N/A N/A ph/cm2/s
90%_error_hi N/A 3.29e-01 2.25e-01 N/A N/A N/A ph/cm2/s
======================================================================
Image
Pre-slew 15.0-350.0 keV image (Event data)
#   RAcent    DECcent   POSerr    Theta     Phi              Peak Cts       SNR   Name
  184.0621    35.5482   0.0217    55.5548    -4.9746         2.2483836      8.855 TRIG_00218582

Foreground time interval of the image:
  0.592  38.736 (delta_t =  38.144 [sec])
Background time interval of the image:
-239.024   0.592 (delta_t = 239.616 [sec])
Light Curves
Note: The mask-weighted lightcurves have units of either count/det or counts/sec/det, where a det is 0.4 x 0.4 = 0.16 sq cm.
Full-time range; 1 s binning
Other quick-look light curves:
- 64 ms binning (zoomed)
- 16 ms binning (zoomed)
- 8 ms binning (zoomed)
- 2 ms binning (zoomed)
- SN=5 or 10 s binning (full-time range)
- Raw light curve
Spectra
- 64 ms binning (zoomed)
- 16 ms binning (zoomed)
- 8 ms binning (zoomed)
- 2 ms binning (zoomed)
- SN=5 or 10 s binning (full-time range)
- Raw light curve
Spectra
Notes:
- 1) The fitting includes the systematic errors.
- 2) When the burst includes telescope slew time periods, the fitting uses an average response file made from multiple 5-s response files through out the slew time plus single time preiod for the non-slew times, and weighted by the total counts in the corresponding time period using addrmf. An average response file is needed becuase a spectral fit using the pre-slew DRM will introduce some errors in both a spectral shape and a normalization if the PHA file contains a lot of the slew/post-slew time interval.
- 3) For fits to more complicated models (e.g. a power-law over a cutoff power-law), the BAT team has decided to require a chi-square improvement of more than 6 for each extra dof.
Time averaged spectrum fit using the average DRM
Power-law model
Time interval is from    0.592 sec. to   38.736 sec.

Spectral model in power-law:
------------------------------------------------------------
Parameters  : value       lower 90%   higher 90%
Photon index: -1.55705     ( -0.319848   0.322745 )
Norm@50keV  : 3.94923E-03    ( -0.000670256   0.000669579 )
------------------------------------------------------------
#Fit statistic : Chi-Squared =          57.98 using 59 PHA bins.
# Reduced chi-squared =          1.017 for     57 degrees of freedom
# Null hypothesis probability =   4.389729e-01

Photon flux (15-150 keV)    in 38.14 sec: 0.500991 ( -0.093783  0.094482 ) ph/cm2/s
Energy fluence (15-150 keV)             : 1.41678e-06 ( -2.51521e-07  2.52165e-07 ) ergs/cm2
Cutoff power-law model

Time interval is from    0.592 sec. to   38.736 sec.
Spectral model in the cutoff power-law:
------------------------------------------------------------
Parameters  : value       lower 90%   higher 90%
Photon index: -1.57264     ( -0.305929   0.341516 )
Epeak [keV] : 9999.36      ( -9999.36 -9999.36 )
Norm@50keV  : 3.95541E-03    ( -0.000669389   0.00319853 )
------------------------------------------------------------
#Fit statistic : Chi-Squared =          58.00 using 59 PHA bins.
# Reduced chi-squared =          1.036 for     56 degrees of freedom
# Null hypothesis probability =   4.015130e-01

Photon flux (15-150 keV)    in 38.14 sec: 0.501196 ( -0.093986  0.094293 ) ph/cm2/s
Energy fluence (15-150 keV)             : 1.41684e-06 ( -2.57153e-07  2.57026e-07 ) ergs/cm2
1-s peak spectrum fit
Power-law model

Time interval is from   16.764 sec. to   17.764 sec.

Spectral model in power-law:
------------------------------------------------------------
Parameters  : value       lower 90%   higher 90%
Photon index: -1.91586     ( -0.681793   0.567069 )
Norm@50keV  : 1.10708E-02    ( -0.00411583   0.00386888 )
------------------------------------------------------------
#Fit statistic : Chi-Squared =          83.01 using 59 PHA bins.
# Reduced chi-squared =          1.456 for     57 degrees of freedom
# Null hypothesis probability =   1.385796e-02

Photon flux (15-150 keV)    in 1 sec: 1.59968 ( -0.57045  0.5777 ) ph/cm2/s
Energy fluence (15-150 keV)             : 1.01817e-07 ( -3.56502e-08  3.5774e-08 ) ergs/cm2
Cutoff power-law model
Time interval is from   16.764 sec. to   17.764 sec.
Spectral model in the cutoff power-law:
------------------------------------------------------------
Parameters  : value       lower 90%   higher 90%
Photon index: -2.81349     ( -1.57144   3.38515 )
Epeak [keV] : 268.406      (   )
Norm@50keV  : 3.92797E-03    (     )
------------------------------------------------------------
#Fit statistic : Chi-Squared =          82.46 using 59 PHA bins.
# Reduced chi-squared =          1.472 for     56 degrees of freedom
# Null hypothesis probability =   1.224113e-02

Photon flux (15-150 keV)    in 1 sec: 1.28769 (    ) ph/cm2/s
Energy fluence (15-150 keV)             : 0 ( 0  0 ) ergs/cm2
Time-resolved spectra
Distribution
T90 vs. Hardness ratio plot
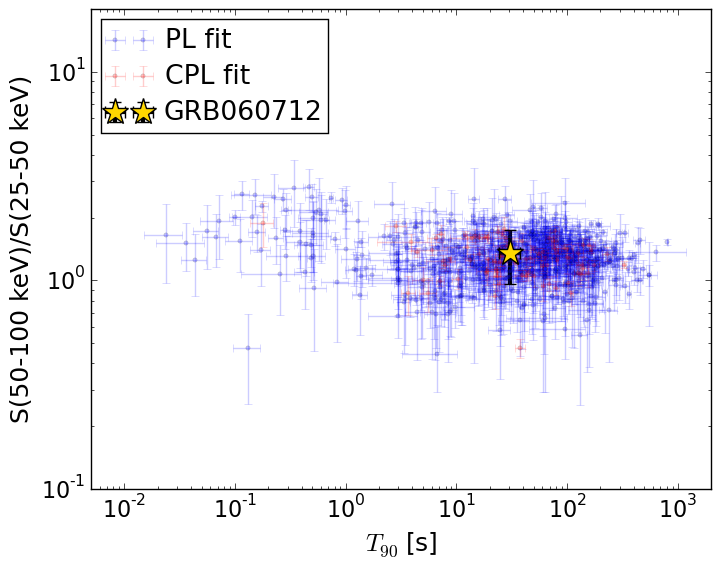
T90                                   = 30.912 sec.
Hardness ratio (energy fluence ratio) = 1.35937767728
S(15-50 keV) vs. S(50-150 keV) plot
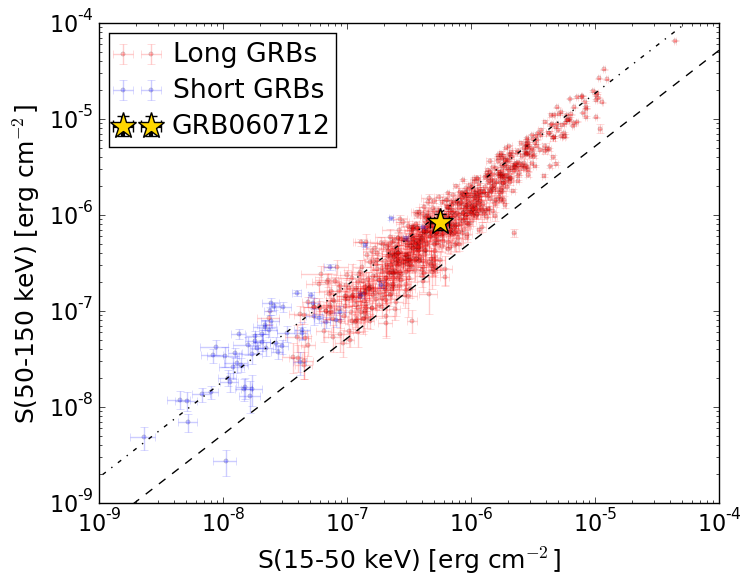
S(15-50 keV)  = 5.629984e-07
S(50-150 keV) = 8.53774e-07
The dash-dotted line and the dashed line traces the fluences calculated from the Band function with Epeak = 15 and 150 keV, respectively. Both lines assume a canonical values of alpha = -1 and beta = -2.5.
Mask shadow pattern
IMX = 1.452503442940376E+00, IMY = 1.264288181916121E-01
Spacecraft aspect plot
Bright source in the pre-burst/pre-slew/post-slew images
Pre-burst image of 15-350 keV band
Time interval of the image:
-239.024000 0.592000

# RAcent  DECcent POSerr Theta    Phi  PeakCts   SNR AngSep     Name
#  [deg]    [deg]    ['] [deg]  [deg]                   [']
135.5350 -40.5531    0.9  32.8 -178.2   2.4981  13.1    0.3	Vela X-1
170.2654 -60.5567    4.6  47.2  141.2   1.5575   2.5    4.2	Cen X-3
186.7422  29.2140    2.5  51.5    1.7   1.9790   4.6 ------	UNKNOWN
 99.7367 -48.7220    2.6  58.6 -169.5   4.3964   4.4 ------	UNKNOWN
144.8046  34.8111    2.5  50.6  -44.7   4.0874   4.6 ------	UNKNOWN
Pre-slew background subtracted image of 15-350 keV band
Time interval of the image:
0.592000 38.736000

# RAcent  DECcent POSerr Theta    Phi  PeakCts   SNR AngSep     Name
#  [deg]    [deg]    ['] [deg]  [deg]                   [']
135.5071 -40.5048 1410.3  32.8 -178.1   0.0005   0.0    3.2	Vela X-1
170.1227 -60.7386    6.2  47.3  141.3   0.4303   1.8    9.0	Cen X-3
168.7050  15.8056    2.7  31.8  -10.9   0.2788   4.3 ------	UNKNOWN
184.0621  35.5482    1.3  55.6   -5.0   2.2484   8.9 ------	UNKNOWN
111.1087 -15.3879    3.0  45.3 -128.3   0.6826   3.9 ------	UNKNOWN
Post-slew image of 15-350 keV band
Time interval of the image:
167.476610 723.016000

# RAcent  DECcent POSerr Theta    Phi  PeakCts   SNR AngSep     Name
#  [deg]    [deg]    ['] [deg]  [deg]                   [']
178.6277   3.7948    2.7  32.2 -178.5   3.4286   4.2 ------	UNKNOWN
178.6121  10.4261    2.5  25.6 -176.3   3.3050   4.5 ------	UNKNOWN
167.5008   7.9524    3.2  31.5 -156.1   3.0657   3.6 ------	UNKNOWN
163.5129   4.0085    3.0  36.8 -153.0   3.6898   3.9 ------	UNKNOWN
155.1942  -2.6856    2.7  46.8 -147.4   7.2720   4.2 ------	UNKNOWN