Analysis Summary
Notes:
- 1) No attempt has been made to eliminate the non-significant decimal places.
- 2) This batgrbproduct analysis is done using the HEASARC data.
- 3) This batgrbproduct analysis is using the flight position for the mask-weighting calculation.
======================================================================
BAT GRB EVENT DATA PROCESSING REPORT
Process Script Ver: batgrbproduct v2.46
Process Start Time: Wed Jan 22 15:05:02 EST 2014
Host Name: batevent1
Current Working Dir: /local/data/batevent/batevent_reproc/trigger219101
======================================================================
Trigger: 00219101 Segment: 000
BAT Trigger Time: 174582721.6 [s; MET]
Trigger Stop: 174582725.696 [s; MET]
UTC: 2006-07-14T15:12:00.283480 [includes UTCF correction]
Where From?: TDRSS position message
BAT
RA: 227.871787334663 Dec: -6.54624612869117 [deg; J2000]
Catalogged Source?: NO
Point Source?: YES
GRB Indicated?: YES [ by BAT flight software ]
Image S/N Ratio: 8.78
Image Trigger?: NO
Rate S/N Ratio: 14.8660687473185 [ if not an image trigger ]
Image S/N Ratio: 8.78
Analysis Position: [ source = BAT ]
RA: 227.871787334663 Dec: -6.54624612869117 [deg; J2000]
Refined Position: [ source = BAT pre-slew burst ]
RA: 227.853819634806 Dec: -6.54336199501505 [deg; J2000]
{ 15h 11m 24.9s , -06d 32' 36.1" }
+/- 1.51269476727943 [arcmin] (estimated 90% radius based on SNR)
+/- 0.538302688362831 [arcmin] (formal 1-sigma fit error)
SNR: 16.8395624176724
Angular difference between the analysis and refined position is 1.084926 arcmin
Partial Coding Fraction: 0.2734375 [ including projection effects ]
Duration
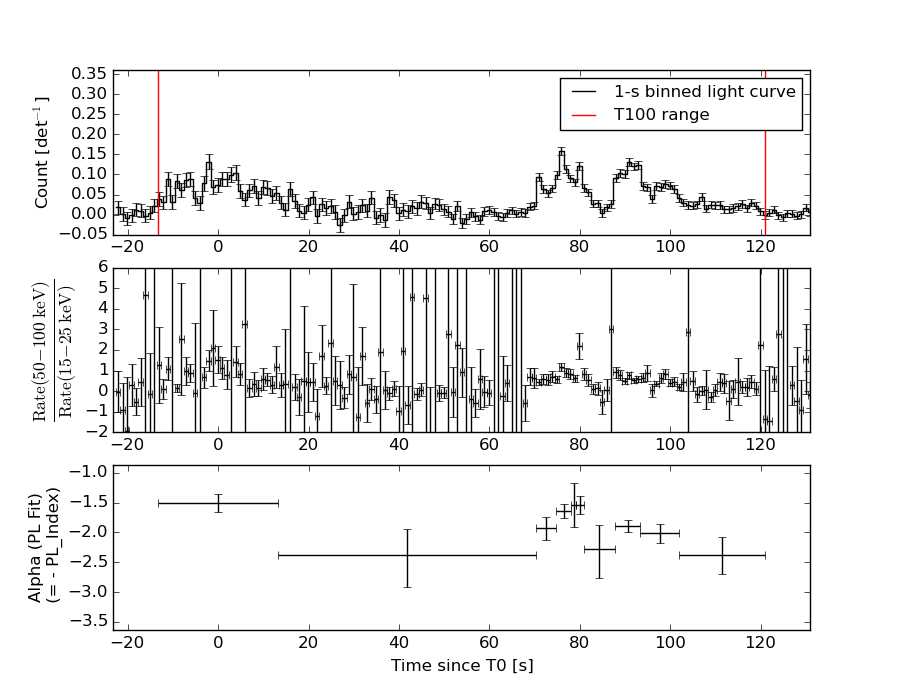
T90: 116.06400001049 +/- 8.96865499917084
Measured from: -8.90799999237061
to: 107.15600001812 [s; relative to TRIGTIME]
T50: 86.2159999907017 +/- 3.68572003649321
Measured from: 4.37600001692772
to: 90.5920000076294 [s; relative to TRIGTIME]
Fluence
Peak Flux (peak 1 second)
Measured from: 75.4399999976158
to: 76.4399999976158 [s; relative to TRIGTIME]
Total Fluence
Measured from: -13.3400000035763
to: 120.876000016928 [s; relative to TRIGTIME]
Band 1 Band 2 Band 3 Band 4
15-25 25-50 50-100 100-350 keV
Total 1.798766 2.127178 1.105888 0.299296
0.084546 0.085971 0.075446 0.065491 [error]
Peak 0.040312 0.065842 0.049541 0.006503
0.005568 0.005515 0.004794 0.003659 [error]
[ fluence units of on-axis counts / fully illuminated detector ]
======================================================================
====== Table of the duration information =============================
Value tstart tstop
T100 134.216 -13.340 120.876
T90 116.064 -8.908 107.156
T50 86.216 4.376 90.592
Peak 1.000 75.440 76.440
====== Spectral Analysis Summary =====================================
Model : spectral model: simple power-law (PL) and cutoff power-law (CPL)
Ph_index : photon index: E^{Ph_index}
Ph_90err : 90% error of the photon index
Epeak : Epeak in keV
Epeak_90err: 90% error of Epeak
Norm : normalization at 50 keV in both the PL model and CPL model
Nomr_90err : 90% error of the normalization
chi2 : Chi-Squared
dof : degree of freedo
=== Time-averaged spectral analysis ===
(Best model with acceptable fit: PL)
Model Ph_index Ph_90err_low Ph_90err_hi Epeak Epeak_90err_low Epeak_90err_hi Norm Nomr_90err_low Norm_90err_hi chi2 dof
PL -1.895 -0.099 0.097 - - - 2.34e-03 -1.38e-04 1.37e-04 62.790 57
CPL -1.538 -0.385 0.431 56.855 -13.492 -56.855 3.68e-03 -1.38e-03 2.65e-03 60.320 56
=== 1-s peak spectral analysis ===
(Best model with acceptable fit: PL)
Model Ph_index Ph_90err_low Ph_90err_hi Epeak Epeak_90err_low Epeak_90err_hi Norm Nomr_90err_low Norm_90err_hi chi2 dof
PL -1.482 -0.167 0.165 - - - 1.02e-02 -1.02e-03 1.02e-03 62.810 57
CPL -0.651 -0.705 0.837 80.823 -19.809 150.858 2.68e-02 -1.48e-02 4.26e-02 58.670 56
=== Fluence/Peak Flux Summary ===
Model Band1 Band2 Band3 Band4 Band5 Total
15-25 25-50 50-100 100-350 15-150 15-350 keV
Fluence PL 5.80e-07 8.39e-07 9.03e-07 1.81e-06 2.88e-06 4.13e-06 erg/cm2
90%_error_low -4.67e-08 -4.29e-08 -7.33e-08 -2.86e-07 -1.68e-07 -3.59e-07 erg/cm2
90%_error_hi 4.77e-08 4.29e-08 7.38e-08 3.22e-07 1.69e-07 3.85e-07 erg/cm2
Peak flux PL 4.12e-01 4.19e-01 3.00e-01 3.43e-01 1.27e+00 1.47e+00 ph/cm2/s
90%_error_low -6.64e-02 -4.36e-02 -3.76e-02 -7.96e-02 -1.25e-01 -1.47e-01 ph/cm2/s
90%_error_hi 6.97e-02 4.33e-02 3.73e-02 9.30e-02 1.25e-01 1.48e-01 ph/cm2/s
Fluence CPL 5.56e-07 8.71e-07 8.95e-07 9.74e-07 2.77e-06 3.30e-06 erg/cm2
90%_error_low -5.35e-08 -5.50e-08 -8.00e-08 -4.54e-07 -2.05e-07 -5.07e-07 erg/cm2
90%_error_hi 5.41e-08 5.62e-08 7.83e-08 1.48e-06 2.07e-07 9.46e-07 erg/cm2
Peak flux CPL 3.55e-01 4.51e-01 3.19e-01 1.49e-01 1.22e+00 1.27e+00 ph/cm2/s
90%_error_low -8.09e-02 -5.23e-02 -4.30e-02 -7.45e-02 -1.31e-01 -1.56e-01 ph/cm2/s
90%_error_hi 8.38e-02 5.40e-02 4.40e-02 1.51e-01 1.31e-01 1.90e-01 ph/cm2/s
======================================================================
Image
Pre-slew 15.0-350.0 keV image (Event data)
#   RAcent    DECcent   POSerr    Theta     Phi              Peak Cts       SNR   Name
  227.8538    -6.5434   0.0114    33.5472    65.0443         2.3983270     16.840 TRIG_00219101

Foreground time interval of the image:
-13.340  34.901 (delta_t =  48.241 [sec])
Background time interval of the image:
-239.600 -13.340 (delta_t = 226.260 [sec])
Light Curves
Note: The mask-weighted lightcurves have units of either count/det or counts/sec/det, where a det is 0.4 x 0.4 = 0.16 sq cm.
Full-time range; 1 s binning
Other quick-look light curves:
- 64 ms binning (zoomed)
- 16 ms binning (zoomed)
- 8 ms binning (zoomed)
- 2 ms binning (zoomed)
- SN=5 or 10 s binning (full-time range)
- Raw light curve
Spectra
- 64 ms binning (zoomed)
- 16 ms binning (zoomed)
- 8 ms binning (zoomed)
- 2 ms binning (zoomed)
- SN=5 or 10 s binning (full-time range)
- Raw light curve
Spectra
Notes:
- 1) The fitting includes the systematic errors.
- 2) When the burst includes telescope slew time periods, the fitting uses an average response file made from multiple 5-s response files through out the slew time plus single time preiod for the non-slew times, and weighted by the total counts in the corresponding time period using addrmf. An average response file is needed becuase a spectral fit using the pre-slew DRM will introduce some errors in both a spectral shape and a normalization if the PHA file contains a lot of the slew/post-slew time interval.
- 3) For fits to more complicated models (e.g. a power-law over a cutoff power-law), the BAT team has decided to require a chi-square improvement of more than 6 for each extra dof.
Time averaged spectrum fit using the average DRM
Power-law model
Time interval is from  -13.340 sec. to  120.876 sec.

Spectral model in power-law:
------------------------------------------------------------
Parameters  : value       lower 90%   higher 90%
Photon index: -1.89466     ( -0.098943   0.0972653 )
Norm@50keV  : 2.33505E-03    ( -0.000137942   0.000136656 )
------------------------------------------------------------
#Fit statistic : Chi-Squared =          62.79 using 59 PHA bins.
# Reduced chi-squared =          1.101 for     57 degrees of freedom
# Null hypothesis probability =   2.787747e-01

Photon flux (15-150 keV)    in 134.2 sec: 0.334367 ( -0.017499  0.017522 ) ph/cm2/s
Energy fluence (15-150 keV)             : 2.88133e-06 ( -1.67686e-07  1.69183e-07 ) ergs/cm2
Cutoff power-law model
Time interval is from  -13.340 sec. to  120.876 sec.
Spectral model in the cutoff power-law:
------------------------------------------------------------
Parameters  : value       lower 90%   higher 90%
Photon index: -1.53835     ( -0.384902   0.431425 )
Epeak [keV] : 56.8548      ( -13.493 -56.8561 )
Norm@50keV  : 3.67632E-03    ( -0.00138019   0.00265054 )
------------------------------------------------------------
#Fit statistic : Chi-Squared =          60.32 using 59 PHA bins.
# Reduced chi-squared =          1.077 for     56 degrees of freedom
# Null hypothesis probability =   3.226030e-01

Photon flux (15-150 keV)    in 134.2 sec: 0.327826 ( -0.018861  0.018845 ) ph/cm2/s
Energy fluence (15-150 keV)             : 2.76887e-06 ( -2.05432e-07  2.06581e-07 ) ergs/cm2
1-s peak spectrum fit
Power-law model
Time interval is from   75.440 sec. to   76.440 sec.

Spectral model in power-law:
------------------------------------------------------------
Parameters  : value       lower 90%   higher 90%
Photon index: -1.48231     ( -0.166806   0.16454 )
Norm@50keV  : 1.01829E-02    ( -0.00102455   0.00101937 )
------------------------------------------------------------
#Fit statistic : Chi-Squared =          62.81 using 59 PHA bins.
# Reduced chi-squared =          1.102 for     57 degrees of freedom
# Null hypothesis probability =   2.779305e-01

Photon flux (15-150 keV)    in 1 sec: 1.26531 ( -0.12533  0.12548 ) ph/cm2/s
Energy fluence (15-150 keV)             : 9.68969e-08 ( -1.06586e-08  1.0762e-08 ) ergs/cm2
Cutoff power-law model
Time interval is from   75.440 sec. to   76.440 sec.
Spectral model in the cutoff power-law:
------------------------------------------------------------
Parameters  : value       lower 90%   higher 90%
Photon index: -0.651006     ( -0.704842   0.836626 )
Epeak [keV] : 80.8231      ( -19.8093 150.858 )
Norm@50keV  : 2.68040E-02    ( -0.0147666   0.0426238 )
------------------------------------------------------------
#Fit statistic : Chi-Squared =          58.67 using 59 PHA bins.
# Reduced chi-squared =          1.048 for     56 degrees of freedom
# Null hypothesis probability =   3.777509e-01

Photon flux (15-150 keV)    in 1 sec: 1.22175 ( -0.13103  0.1308 ) ph/cm2/s
Energy fluence (15-150 keV)             : 9.1283e-08 ( -6.31801e-09  1.18078e-08 ) ergs/cm2
Time-resolved spectra
Distribution
T90 vs. Hardness ratio plot
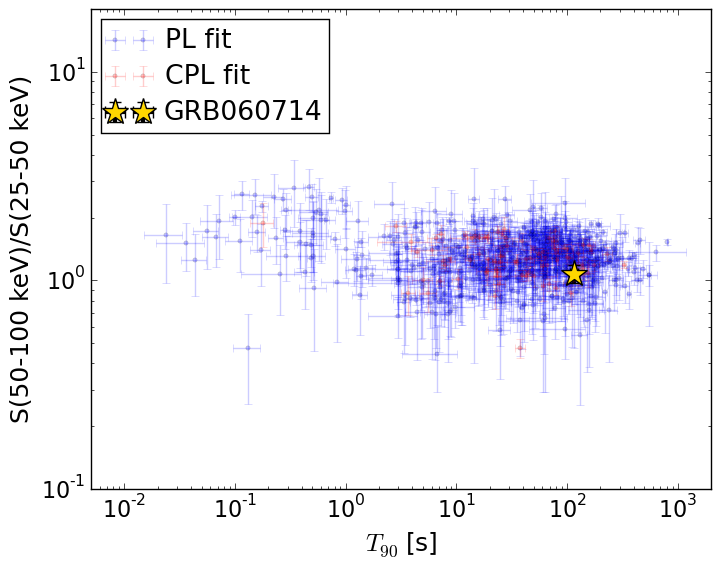
T90                                   = 116.064 sec.
Hardness ratio (energy fluence ratio) = 1.07579625001
S(15-50 keV) vs. S(50-150 keV) plot
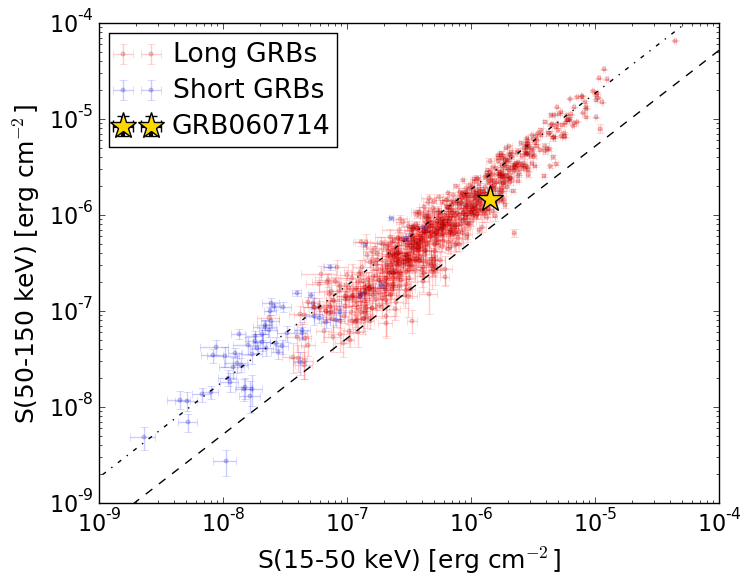
S(15-50 keV)  = 1.4193604e-06
S(50-150 keV) = 1.4619636e-06
The dash-dotted line and the dashed line traces the fluences calculated from the Band function with Epeak = 15 and 150 keV, respectively. Both lines assume a canonical values of alpha = -1 and beta = -2.5.
Mask shadow pattern
IMX = 2.797615563035780E-01, IMY = -6.011639666073223E-01
Spacecraft aspect plot
Bright source in the pre-burst/pre-slew/post-slew images
Pre-burst image of 15-350 keV band
Time interval of the image:
-239.600000 -13.340000

# RAcent  DECcent POSerr Theta    Phi  PeakCts   SNR AngSep     Name
#  [deg]    [deg]    ['] [deg]  [deg]                   [']
225.3619  17.2483    2.2  38.5   24.6   1.2972   5.3 ------	UNKNOWN
Pre-slew background subtracted image of 15-350 keV band
Time interval of the image:
-13.340000 34.900590

# RAcent  DECcent POSerr Theta    Phi  PeakCts   SNR AngSep     Name
#  [deg]    [deg]    ['] [deg]  [deg]                   [']
227.8538  -6.5434    0.7  33.5   65.0   2.3984  16.8 ------	UNKNOWN
176.4432 -55.4500    2.3  51.6  164.7   1.2395   5.0 ------	UNKNOWN
178.2693 -52.6057    2.6  48.6  164.7   0.8465   4.5 ------	UNKNOWN
204.1151  49.9200    2.6  56.4  -20.3   1.2440   4.4 ------	UNKNOWN
Post-slew image of 15-350 keV band
Time interval of the image:
88.100620 962.440000

# RAcent  DECcent POSerr Theta    Phi  PeakCts   SNR AngSep     Name
#  [deg]    [deg]    ['] [deg]  [deg]                   [']
244.9819 -15.6379    0.1  19.1   99.1  62.5354  82.2    0.2	Sco X-1
254.3242  35.3441   12.3  48.7    8.1   1.6030   0.9    6.5	Her X-1
255.9935 -37.8412    0.7  40.4  124.1  45.6698  16.8    0.4	4U 1700-377
256.4384 -36.4171   71.1  39.7  122.1   0.3971   0.2    0.4	GX 349+2
263.1575 -24.8220   10.8  38.4  101.6  -2.7630  -1.1    9.3	GX 1+4
268.3650  -1.3173    6.7  40.7   63.6   5.5672   1.7    8.1	SW J1753.5-0127
220.5041 -38.2514    2.8  32.4  170.0   3.4903   4.1 ------	UNKNOWN
228.5531 -21.7016    3.6  15.2  156.7   2.1629   3.2 ------	UNKNOWN
181.5428 -13.8175    3.1  46.1 -123.7  13.6490   3.7 ------	UNKNOWN