Analysis Summary
Notes:
- 1) No attempt has been made to eliminate the non-significant decimal places.
- 2) This batgrbproduct analysis is done using the HEASARC data.
- 3) This batgrbproduct analysis is using the flight position for the mask-weighting calculation.
======================================================================
                  BAT GRB EVENT DATA PROCESSING REPORT
    Process Script Ver: batgrbproduct v2.46
    Process Start Time: Wed Jan 22 14:56:27 EST 2014
             Host Name: batevent1
   Current Working Dir: /local/data/batevent/batevent_reproc/trigger220020
======================================================================

  Trigger: 00220020      Segment: 000

  BAT Trigger Time: 174984638.272   [s; MET]
      Trigger Stop: 174984638.784   [s; MET]
               UTC: 2006-07-19T06:50:36.945900    [includes UTCF correction]
       Where From?: TDRSS position message

  BAT
    RA: 18.4558708767216   Dec: -48.3753985429403  [deg; J2000]

     Catalogged Source?: NO
     Point Source?:      YES
     GRB Indicated?:     YES    [ by BAT flight software ]
     Image S/N Ratio:    12.95
     Image Trigger?:     NO
     Rate S/N Ratio:     20.976176963403  [ if not an image trigger ]
     Image S/N Ratio:    12.95

  Analysis Position:   [ source = BAT ]
    RA: 18.4558708767216   Dec: -48.3753985429403  [deg; J2000]

  Refined Position:   [ source = BAT pre-slew burst ]
    RA: 18.4144978904403   Dec: -48.3766110975331  [deg; J2000]
        { 01h 13m 39.5s , -48d 22' 35.8" }
         +/- 1.28040349369351 [arcmin] (estimated 90% radius based on SNR)
         +/- 0.371532142139456 [arcmin] (formal 1-sigma fit error)
    SNR: 21.3680915853171

  Angular difference between the analysis and refined position is 1.650498 arcmin

  Partial Coding Fraction: 0.703125    [ including projection effects ]

  Duration
     T90: 66.9200000166893 +/- 11.554925537903
        Measured from: 0.411999970674515
                   to: 67.3319999873638     [s; relative to TRIGTIME]
     T50: 45.052000015974 +/- 5.83917938311706
        Measured from: 5.72399997711182
                   to: 50.7759999930859     [s; relative to TRIGTIME]


  Fluence
     Peak Flux  (peak 1 second)
        Measured from: 0.371999979019165
                   to: 1.37199997901917     [s; relative to TRIGTIME]
     Total Fluence
        Measured from: -0.320000022649765
                   to: 84.6399999856949     [s; relative to TRIGTIME]

             Band 1     Band 2     Band 3     Band 4
              15-25      25-50     50-100    100-350     keV
 Total     1.013600   1.064950   0.626769   0.082193
           0.045451   0.047111   0.040899   0.034677 [error]
 Peak      0.069860   0.105690   0.070262   0.004274
           0.006711   0.007333   0.006305   0.004625 [error]

     [ fluence units of on-axis counts / fully illuminated detector ]

======================================================================


====== Table of the duration information =============================

        Value   tstart    tstop
T100   84.960   -0.320   84.640
T90    66.920    0.412   67.332
T50    45.052    5.724   50.776
Peak    1.000    0.372    1.372


====== Spectral Analysis Summary =====================================

Model      : spectral model: simple power-law (PL) and cutoff power-law (CPL)
Ph_index   : photon index: E^{Ph_index}
Ph_90err   : 90% error of the photon index
Epeak      : Epeak in keV
Epeak_90err: 90% error of Epeak
Norm       : normalization at 50 keV in both the PL model and CPL model
Nomr_90err : 90% error of the normalization
chi2       : Chi-Squared
dof        : degree of freedo

=== Time-averaged spectral analysis ===
(Best model with acceptable fit: PL)

Model Ph_index Ph_90err_low Ph_90err_hi  Epeak  Epeak_90err_low  Epeak_90err_hi  Norm       Nomr_90err_low    Norm_90err_hi    chi2    dof
PL      -1.891    -0.103      0.101       -           -               -         1.96e-03     -1.18e-04          1.17e-04      61.670   57
CPL     -1.673    -0.369      0.407       68.556     -22.485       -68.556      2.57e-03     -3.76e-04          1.64e-03      60.690   56


=== 1-s peak spectral analysis ===
(Best model with acceptable fit: CPL)

Model Ph_index Ph_90err_low Ph_90err_hi  Epeak  Epeak_90err_low  Epeak_90err_hi  Norm       Nomr_90err_low    Norm_90err_hi    chi2    dof
PL      -1.794     -0.141     0.137       -           -               -         1.62e-02     -1.49e-03          1.47e-03      66.360   57
CPL     -0.678     -0.625     0.722       54.830      -8.178        15.894      6.45e-02     -3.42e-02          9.20e-02      56.150   56


=== Fluence/Peak Flux Summary ===

              Model    Band1     Band2     Band3     Band4     Band5     Total
                       15-25     25-50    50-100    100-350    15-150    15-350    keV
Fluence         PL   3.08e-07  4.46e-07  4.81e-07  9.68e-07  1.53e-06  2.20e-06   erg/cm2
      90%_error_low -2.57e-08 -2.32e-08 -4.01e-08 -1.58e-07 -9.08e-08 -1.97e-07   erg/cm2
      90%_error_hi   2.63e-08  2.32e-08  4.03e-08  1.79e-07  9.16e-08  2.12e-07   erg/cm2
Peak flux       PL   8.86e-01  7.50e-01  4.32e-01  3.71e-01  2.23e+00  2.44e+00   ph/cm2/s
      90%_error_low -1.09e-01 -6.26e-02 -5.05e-02 -7.76e-02 -1.86e-01 -2.02e-01   ph/cm2/s
      90%_error_hi   1.13e-01  6.25e-02  5.04e-02  8.85e-02  1.87e-01  2.02e-01   ph/cm2/s

Fluence        CPL   2.99e-07  4.56e-07  4.82e-07  6.68e-07  1.50e-06  1.90e-06   erg/cm2
      90%_error_low -3.01e-08 -2.84e-08 -4.16e-08 -3.02e-07 -1.07e-07 -3.26e-07   erg/cm2
      90%_error_hi   3.05e-08  2.89e-08  4.16e-08  3.49e-07  1.07e-07  3.84e-07   erg/cm2
Peak flux      CPL   7.57e-01  8.43e-01  4.56e-01  1.23e-01  2.15e+00  2.18e+00   ph/cm2/s
      90%_error_low -1.29e-01 -8.14e-02 -5.94e-02 -5.85e-02 -1.92e-01 -2.03e-01   ph/cm2/s
      90%_error_hi   1.32e-01  8.37e-02  5.94e-02  9.95e-02  1.92e-01  2.09e-01   ph/cm2/s

======================================================================
Image
Pre-slew 15.0-350.0 keV image (Event data)
#   RAcent    DECcent   POSerr    Theta     Phi              Peak Cts       SNR   Name
   18.4145   -48.3766   0.0090    35.0071   -20.2205         0.8312295     21.368 TRIG_00220020

Foreground time interval of the image:
 -0.320  10.229 (delta_t =  10.549 [sec])
Background time interval of the image:
-239.272  -0.320 (delta_t = 238.952 [sec])
Light Curves
Note: The mask-weighted lightcurves have units of either count/det or counts/sec/det, where a det is 0.4 x 0.4 = 0.16 sq cm.
Full-time range; 1 s binning
Other quick-look light curves:
- 64 ms binning (zoomed)
- 16 ms binning (zoomed)
- 8 ms binning (zoomed)
- 2 ms binning (zoomed)
- SN=5 or 10 s binning (full-time range)
- Raw light curve
Spectra
- 64 ms binning (zoomed)
- 16 ms binning (zoomed)
- 8 ms binning (zoomed)
- 2 ms binning (zoomed)
- SN=5 or 10 s binning (full-time range)
- Raw light curve
Spectra
Notes:
- 1) The fitting includes the systematic errors.
- 2) When the burst includes telescope slew time periods, the fitting uses an average response file made from multiple 5-s response files through out the slew time plus single time preiod for the non-slew times, and weighted by the total counts in the corresponding time period using addrmf. An average response file is needed becuase a spectral fit using the pre-slew DRM will introduce some errors in both a spectral shape and a normalization if the PHA file contains a lot of the slew/post-slew time interval.
- 3) For fits to more complicated models (e.g. a power-law over a cutoff power-law), the BAT team has decided to require a chi-square improvement of more than 6 for each extra dof.
Time averaged spectrum fit using the average DRM
Power-law model
Time interval is from   -0.320 sec. to   84.640 sec.

Spectral model in power-law:
------------------------------------------------------------
Parameters  : value       lower 90%   higher 90%
Photon index: -1.8914     ( -0.103283   0.101241 )
Norm@50keV  : 1.96483E-03    ( -0.000117881   0.000116649 )
------------------------------------------------------------
#Fit statistic : Chi-Squared =          61.67 using 59 PHA bins.
# Reduced chi-squared =          1.082 for     57 degrees of freedom
# Null hypothesis probability =   3.127441e-01

Photon flux (15-150 keV)    in 84.96 sec: 0.280967 ( -0.014963  0.014987 ) ph/cm2/s
Energy fluence (15-150 keV)             : 1.53488e-06 ( -9.07551e-08  9.15852e-08 ) ergs/cm2
Cutoff power-law model
Time interval is from   -0.320 sec. to   84.640 sec.
Spectral model in the cutoff power-law:
------------------------------------------------------------
Parameters  : value       lower 90%   higher 90%
Photon index: -1.67338     ( -0.368781   0.407235 )
Epeak [keV] : 68.5564      ( -22.4849 -68.5564 )
Norm@50keV  : 2.57164E-03    ( -0.000375774   0.00163573 )
------------------------------------------------------------
#Fit statistic : Chi-Squared =          60.69 using 59 PHA bins.
# Reduced chi-squared =          1.084 for     56 degrees of freedom
# Null hypothesis probability =   3.107822e-01

Photon flux (15-150 keV)    in 84.96 sec: 0.277287 ( -0.01619  0.016188 ) ph/cm2/s
Energy fluence (15-150 keV)             : 1.50133e-06 ( -1.06745e-07  1.07147e-07 ) ergs/cm2
1-s peak spectrum fit
Power-law model
Time interval is from    0.372 sec. to    1.372 sec.

Spectral model in power-law:
------------------------------------------------------------
Parameters  : value       lower 90%   higher 90%
Photon index: -1.79372     ( -0.140988   0.136653 )
Norm@50keV  : 1.62239E-02    ( -0.00148823   0.00147248 )
------------------------------------------------------------
#Fit statistic : Chi-Squared =          66.36 using 59 PHA bins.
# Reduced chi-squared =          1.164 for     57 degrees of freedom
# Null hypothesis probability =   1.854704e-01

Photon flux (15-150 keV)    in 1 sec: 2.23031 ( -0.18643  0.18659 ) ph/cm2/s
Energy fluence (15-150 keV)             : 1.4942e-07 ( -1.39011e-08  1.40281e-08 ) ergs/cm2
Cutoff power-law model
Time interval is from    0.372 sec. to    1.372 sec.
Spectral model in the cutoff power-law:
------------------------------------------------------------
Parameters  : value       lower 90%   higher 90%
Photon index: -0.678409     ( -0.624813   0.722361 )
Epeak [keV] : 54.8299      ( -8.17846 15.8938 )
Norm@50keV  : 6.44528E-02    ( -0.0342456   0.0919922 )
------------------------------------------------------------
#Fit statistic : Chi-Squared =          56.15 using 59 PHA bins.
# Reduced chi-squared =          1.003 for     56 degrees of freedom
# Null hypothesis probability =   4.692237e-01

Photon flux (15-150 keV)    in 1 sec: 2.14929 ( -0.19153  0.1917 ) ph/cm2/s
Energy fluence (15-150 keV)             : 1.3905e-07 ( -1.4653e-08  1.50136e-08 ) ergs/cm2
Time-resolved spectra
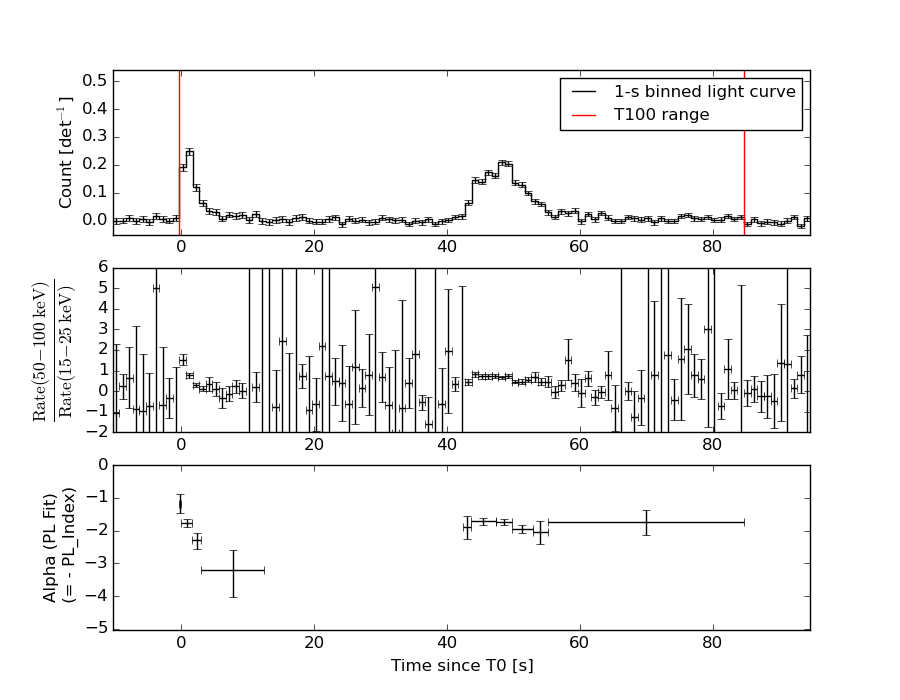
Distribution
T90 vs. Hardness ratio plot
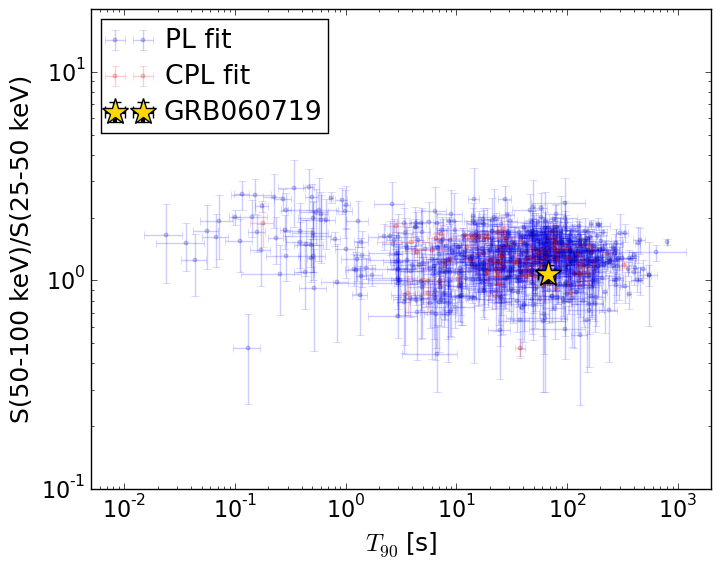
T90                                   = 66.92 sec.
Hardness ratio (energy fluence ratio) = 1.07822659039
S(15-50 keV) vs. S(50-150 keV) plot
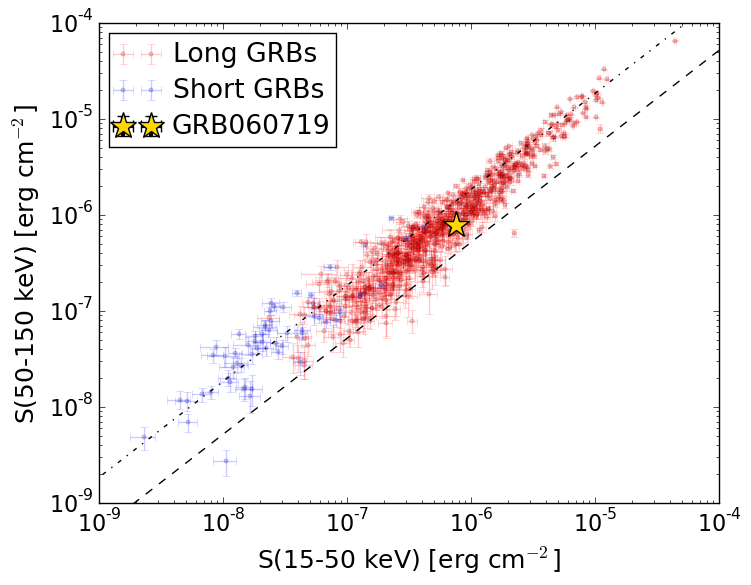
S(15-50 keV)  = 7.546563e-07
S(50-150 keV) = 7.802312e-07
The dash-dotted line and the dashed line traces the fluences calculated from the Band function with Epeak = 15 and 150 keV, respectively. Both lines assume a canonical values of alpha = -1 and beta = -2.5.
Mask shadow pattern
IMX = 6.572256370581792E-01, IMY = 2.420794765686918E-01
Spacecraft aspect plot
Bright source in the pre-burst/pre-slew/post-slew images
Pre-burst image of 15-350 keV band
Time interval of the image:
-239.272000 -0.320000

# RAcent  DECcent POSerr Theta    Phi  PeakCts   SNR AngSep     Name
#  [deg]    [deg]    ['] [deg]  [deg]                   [']
327.5796  -5.4723    3.3  31.4  114.3   0.8654   3.5 ------	UNKNOWN
337.9028 -58.3875    2.8  42.9   19.3   1.2510   4.2 ------	UNKNOWN
348.7252 -60.5391    2.3  43.0   10.7   1.3372   5.0 ------	UNKNOWN
356.3194  -3.9006    2.7  14.1 -178.8   0.5751   4.3  321.7	UNKNOWN
  1.1253  23.0464    2.6  41.2 -169.8   0.9735   4.5 ------	UNKNOWN
  8.2549   2.7431    2.3  23.4 -146.4   0.7848   5.1  521.7	UNKNOWN
 16.2479 -34.1587    2.4  23.5  -38.1   0.7017   4.8 ------	UNKNOWN
Pre-slew background subtracted image of 15-350 keV band
Time interval of the image:
-0.320000 10.228600

# RAcent  DECcent POSerr Theta    Phi  PeakCts   SNR AngSep     Name
#  [deg]    [deg]    ['] [deg]  [deg]                   [']
318.1055  -3.5716    2.6  40.8  110.5   0.5657   4.5 ------	UNKNOWN
324.8817 -49.7230    2.3  41.0   36.4   0.3373   5.0 ------	UNKNOWN
335.7078   0.3556    2.0  27.9  133.3   0.2286   5.7 ------	UNKNOWN
 18.4145 -48.3766    0.5  35.0  -20.2   0.8312  21.4 ------	UNKNOWN
Post-slew image of 15-350 keV band
Time interval of the image:
65.628600 937.228890

# RAcent  DECcent POSerr Theta    Phi  PeakCts   SNR AngSep     Name
#  [deg]    [deg]    ['] [deg]  [deg]                   [']
 10.1518   5.3307    3.0  54.2  176.9   5.1162   3.8 ------	UNKNOWN
 26.8378 -56.3215    2.4   9.4  -22.6   1.5890   4.7 ------	UNKNOWN
 70.6445 -39.5603    4.0  37.8  -76.4   3.1101   2.9 ------	UNKNOWN