Analysis Summary
Notes:
- 1) No attempt has been made to eliminate the non-significant decimal places.
- 2) This batgrbproduct analysis is done using the HEASARC data.
- 3) This batgrbproduct analysis is using the flight position for the mask-weighting calculation.
======================================================================
                  BAT GRB EVENT DATA PROCESSING REPORT
    Process Script Ver: batgrbproduct v2.46
    Process Start Time: Wed Jan 22 14:52:21 EST 2014
             Host Name: batevent1
   Current Working Dir: /local/data/batevent/batevent_reproc/trigger221627
======================================================================

  Trigger: 00221627      Segment: 000

  BAT Trigger Time: 175818272   [s; MET]
      Trigger Stop: 175818336   [s; MET]
               UTC: 2006-07-28T22:24:30.654180    [includes UTCF correction]
       Where From?: TDRSS position message

  BAT
    RA: 16.6935998159746   Dec: -41.3863114891152  [deg; J2000]

     Catalogged Source?: NO
     Point Source?:      YES
     GRB Indicated?:     YES    [ by BAT flight software ]
     Image S/N Ratio:    7.18
     Image Trigger?:     YES
     Rate S/N Ratio:     0  [ if not an image trigger ]
     Image S/N Ratio:    7.18

  Analysis Position:   [ source = BAT ]
    RA: 16.6935998159746   Dec: -41.3863114891152  [deg; J2000]

  Refined Position:   [ source = BAT pre-slew burst ]
    RA: 16.6391594344528   Dec: -41.3882200209987  [deg; J2000]
        { 01h 06m 33.4s , -41d 23' 17.6" }
         +/- 3.23997174452612 [arcmin] (estimated 90% radius based on SNR)
         +/- 1.98434761561568 [arcmin] (formal 1-sigma fit error)
    SNR: 5.67249048415171

  Angular difference between the analysis and refined position is 2.453334 arcmin

  Partial Coding Fraction: 1.03125    [ including projection effects ]

  Duration
     T90: N/A +/- N/A
        Measured from: N/A
                   to: N/A    [s; relative to TRIGTIME]
     T50: N/A +/- N/A
        Measured from: N/A
                   to: N/A    [s; relative to TRIGTIME]

    WARNING: battblocks failed.  Used TDRSS fore/background intervals

======================================================================


====== Table of the duration information =============================

        Value   tstart    tstop
T100     N/A      N/A      N/A
T90      N/A      N/A      N/A
T50      N/A      N/A      N/A
Peak     N/A      N/A      N/A


====== Spectral Analysis Summary =====================================

Model      : spectral model: simple power-law (PL) and cutoff power-law (CPL)
Ph_index   : photon index: E^{Ph_index}
Ph_90err   : 90% error of the photon index
Epeak      : Epeak in keV
Epeak_90err: 90% error of Epeak
Norm       : normalization at 50 keV in both the PL model and CPL model
Nomr_90err : 90% error of the normalization
chi2       : Chi-Squared
dof        : degree of freedo

=== Time-averaged spectral analysis ===
(Best model with acceptable fit: PL)

Model Ph_index Ph_90err_low Ph_90err_hi  Epeak  Epeak_90err_low  Epeak_90err_hi  Norm       Nomr_90err_low    Norm_90err_hi    chi2    dof
PL      -1.438    -0.437      0.435       -           -               -         3.63e-04     -1.03e-04          1.02e-04      60.330   57
CPL     -0.172    -1.462      2.702       64.551     -25.631       -64.551      1.82e-03     -1.82e-03          9.53e-02      58.380   56


=== 1-s peak spectral analysis ===
(Best model with acceptable fit: N/A)

Model Ph_index Ph_90err_low Ph_90err_hi  Epeak  Epeak_90err_low  Epeak_90err_hi  Norm       Nomr_90err_low    Norm_90err_hi    chi2    dof
PL      N/A         N/A       N/A          -           -               -           N/A           N/A               N/A         N/A        N/A
CPL     N/A         N/A       N/A          N/A         N/A           N/A           N/A           N/A               N/A         N/A        N/A


=== Fluence/Peak Flux Summary ===

              Model    Band1     Band2     Band3     Band4     Band5     Total
                       15-25     25-50    50-100    100-350    15-150    15-350    keV
Fluence         PL   2.79e-08  5.34e-08  7.88e-08  2.50e-07  2.23e-07  4.10e-07   erg/cm2
      90%_error_low -1.11e-08 -1.49e-08 -2.77e-08 -1.40e-07 -6.80e-08 -1.72e-07   erg/cm2
      90%_error_hi   1.22e-08  1.48e-08  2.82e-08  2.31e-07  7.09e-08  2.48e-07   erg/cm2
Peak flux       PL     N/A      N/A      N/A      N/A      N/A      N/A     ph/cm2/s
Image
Pre-slew 15.0-350.0 keV image (Event data)
#   RAcent    DECcent   POSerr    Theta     Phi              Peak Cts       SNR   Name
   16.6392   -41.3882   0.0341     7.1288   158.1110         0.3681373      5.672 TRIG_00221627

Foreground time interval of the image:
  0.000  64.000 (delta_t =  64.000 [sec])
Background time interval of the image:
Light Curves
Note: The mask-weighted lightcurves have units of either count/det or counts/sec/det, where a det is 0.4 x 0.4 = 0.16 sq cm.
Full-time range; 1 s binning
Other quick-look light curves:
- 64 ms binning (zoomed)
- 16 ms binning (zoomed)
- 8 ms binning (zoomed)
- 2 ms binning (zoomed)
- SN=5 or 10 s binning (full-time range)
- Raw light curve
Spectra
- 64 ms binning (zoomed)
- 16 ms binning (zoomed)
- 8 ms binning (zoomed)
- 2 ms binning (zoomed)
- SN=5 or 10 s binning (full-time range)
- Raw light curve
Spectra
Notes:
- 1) The fitting includes the systematic errors.
- 2) When the burst includes telescope slew time periods, the fitting uses an average response file made from multiple 5-s response files through out the slew time plus single time preiod for the non-slew times, and weighted by the total counts in the corresponding time period using addrmf. An average response file is needed becuase a spectral fit using the pre-slew DRM will introduce some errors in both a spectral shape and a normalization if the PHA file contains a lot of the slew/post-slew time interval.
- 3) For fits to more complicated models (e.g. a power-law over a cutoff power-law), the BAT team has decided to require a chi-square improvement of more than 6 for each extra dof.
Time averaged spectrum fit using the average DRM
Power-law model

Time interval is from    0.000 sec. to   64.000 sec.

Spectral model in power-law:
------------------------------------------------------------
Parameters  : value       lower 90%   higher 90%
Photon index: -1.43792     ( -0.438168   0.433959 )
Norm@50keV  : 3.62584E-04    ( -0.000102864   0.000101693 )
------------------------------------------------------------
#Fit statistic : Chi-Squared =          60.33 using 59 PHA bins.
# Reduced chi-squared =          1.058 for     57 degrees of freedom
# Null hypothesis probability =   3.563585e-01

Photon flux (15-150 keV)    in 64 sec: 4.45499E-02 ( -0.0121254  0.0121434 ) ph/cm2/s
Energy fluence (15-150 keV)             : 2.22648e-07 ( -6.80019e-08  7.09005e-08 ) ergs/cm2
Cutoff power-law model

Time interval is from    0.000 sec. to   64.000 sec.
Spectral model in the cutoff power-law:
------------------------------------------------------------
Parameters  : value       lower 90%   higher 90%
Photon index: -0.171823     ( -1.4431   2.72147 )
Epeak [keV] : 64.5510      ( -25.7338 -64.6542 )
Norm@50keV  : 1.81682E-03    ( -0.0017894   0.0953454 )
------------------------------------------------------------
#Fit statistic : Chi-Squared =          58.38 using 59 PHA bins.
# Reduced chi-squared =          1.042 for     56 degrees of freedom
# Null hypothesis probability =   3.880046e-01

Photon flux (15-150 keV)    in 64 sec: 4.29390E-02 ( -0.0063269  0.0121557 ) ph/cm2/s
Energy fluence (15-150 keV)             : 1.96404e-07 ( -7.14957e-08  7.74445e-08 ) ergs/cm2
1-s peak spectrum fit
1-s peak spectrum unavailable, likely because there are no event data in the 1-s peak range.
Time-resolved spectra

Distribution
T90 vs. Hardness ratio plot
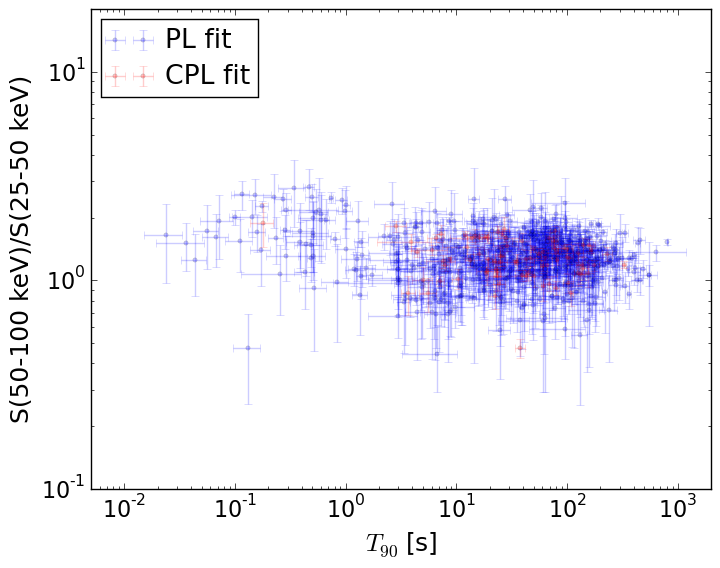
T90                                   = N/A sec.
Hardness ratio (energy fluence ratio) = N/A
S(15-50 keV) vs. S(50-150 keV) plot
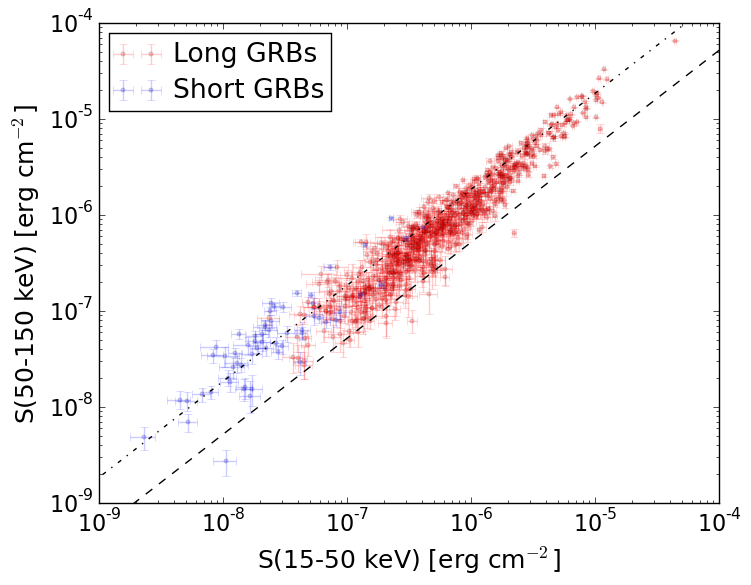
S(15-50 keV)  = N/A
S(50-150 keV) = N/A
The dash-dotted line and the dashed line traces the fluences calculated from the Band function with Epeak = 15 and 150 keV, respectively. Both lines assume a canonical values of alpha = -1 and beta = -2.5.
Mask shadow pattern
IMX = -1.160505753850820E-01, IMY = -4.662617973738296E-02
Spacecraft aspect plot
Bright source in the pre-burst/pre-slew/post-slew images
Pre-burst image of 15-350 keV band
Time interval of the image:
Pre-slew background subtracted image of 15-350 keV band
Time interval of the image:
0.000000 64.000000

# RAcent  DECcent POSerr Theta    Phi  PeakCts   SNR AngSep     Name
#  [deg]    [deg]    ['] [deg]  [deg]                   [']
284.0174 -76.9116    2.3  44.2    7.7   0.6405   4.9 ------	UNKNOWN
349.5082 -71.3565    2.6  26.6    9.0   0.3315   4.5 ------	UNKNOWN
 16.6425 -41.3842    2.2   7.1  158.1   0.3450   5.3 ------	UNKNOWN
Post-slew image of 15-350 keV band
Time interval of the image:
107.500590 901.400580

# RAcent  DECcent POSerr Theta    Phi  PeakCts   SNR AngSep     Name
#  [deg]    [deg]    ['] [deg]  [deg]                   [']
334.3824 -59.4648    2.4  31.6   41.7   2.0764   4.8 ------	UNKNOWN