Analysis Summary
Notes:
- 1) No attempt has been made to eliminate the non-significant decimal places.
- 2) This batgrbproduct analysis is done using the HEASARC data.
- 3) This batgrbproduct analysis is using the flight position for the mask-weighting calculation.
======================================================================
                  BAT GRB EVENT DATA PROCESSING REPORT
    Process Script Ver: batgrbproduct v2.46
    Process Start Time: Wed Jan 22 14:47:36 EST 2014
             Host Name: batevent1
   Current Working Dir: /local/data/batevent/batevent_reproc/trigger221755
======================================================================

  Trigger: 00221755      Segment: 000

  BAT Trigger Time: 175893150.592   [s; MET]
      Trigger Stop: 175893154.688   [s; MET]
               UTC: 2006-07-29T19:12:29.244420    [includes UTCF correction]
       Where From?: TDRSS position message

  BAT
    RA: 95.3382279470773   Dec: -62.3451070936891  [deg; J2000]

     Catalogged Source?: NO
     Point Source?:      YES
     GRB Indicated?:     YES    [ by BAT flight software ]
     Image S/N Ratio:    7.13
     Image Trigger?:     NO
     Rate S/N Ratio:     8.36660026534076  [ if not an image trigger ]
     Image S/N Ratio:    7.13

  Analysis Position:   [ source = BAT ]
    RA: 95.3382279470773   Dec: -62.3451070936891  [deg; J2000]

  Refined Position:   [ source = BAT pre-slew burst ]
    RA: 95.3382   Dec: -62.3451  [deg; J2000]
        { 06h 21m 21.2s , -62d -20' -42.4" }
        +/- 2.36868675805 [arcmin] (estimated 90% radius based on SNR)
    SNR: 8.87491688628


  Angular difference between the analysis and refined position is 0.000887 arcmin

  Partial Coding Fraction: 0.1875    [ including projection effects ]

  Duration
     T90: 113.044000029564 +/- 22.1282404255033
        Measured from: 3.13599997758865
                   to: 116.180000007153     [s; relative to TRIGTIME]
     T50: 21.3680000007153 +/- 2.92526647666488
        Measured from: 73.8400000035763
                   to: 95.2080000042915     [s; relative to TRIGTIME]


  Fluence
     Peak Flux  (peak 1 second)
        Measured from: 91.9679999947548
                   to: 92.9679999947548     [s; relative to TRIGTIME]
     Total Fluence
        Measured from: 0.912000000476837
                   to: 128.523999989033     [s; relative to TRIGTIME]

             Band 1     Band 2     Band 3     Band 4
              15-25      25-50     50-100    100-350     keV
 Total     1.354910   1.744004   1.065882   0.316310
           0.097713   0.102062   0.091547   0.086502 [error]
 Peak      0.048615   0.056307   0.031711   0.011645
           0.005114   0.005413   0.004586   0.004125 [error]

     [ fluence units of on-axis counts / fully illuminated detector ]

======================================================================


====== Table of the duration information =============================

        Value   tstart    tstop
T100  127.612    0.912  128.524
T90   113.044    3.136  116.180
T50    21.368   73.840   95.208
Peak    1.000   91.968   92.968


====== Spectral Analysis Summary =====================================

Model      : spectral model: simple power-law (PL) and cutoff power-law (CPL)
Ph_index   : photon index: E^{Ph_index}
Ph_90err   : 90% error of the photon index
Epeak      : Epeak in keV
Epeak_90err: 90% error of Epeak
Norm       : normalization at 50 keV in both the PL model and CPL model
Nomr_90err : 90% error of the normalization
chi2       : Chi-Squared
dof        : degree of freedo

=== Time-averaged spectral analysis ===
(Best model with acceptable fit: PL)

Model Ph_index Ph_90err_low Ph_90err_hi  Epeak  Epeak_90err_low  Epeak_90err_hi  Norm       Nomr_90err_low    Norm_90err_hi    chi2    dof
PL      -1.689    -0.130      0.128       -           -               -         2.21e-03     -1.69e-04          1.67e-04      56.710   57
CPL     -1.599    -0.496      0.538      201.156    -137.712      -201.156      2.47e-03     -4.95e-04          2.33e-03      56.620   56


=== 1-s peak spectral analysis ===
(Best model with acceptable fit: PL)

Model Ph_index Ph_90err_low Ph_90err_hi  Epeak  Epeak_90err_low  Epeak_90err_hi  Norm       Nomr_90err_low    Norm_90err_hi    chi2    dof
PL      -1.827     -0.206     0.198       -           -               -         8.26e-03     -1.09e-03          1.06e-03      57.530   57
CPL     -1.732     -0.475     0.809      119.324      N/A           N/A         9.37e-03        N/A               N/A         57.480   56


=== Fluence/Peak Flux Summary ===

              Model    Band1     Band2     Band3     Band4     Band5     Total
                       15-25     25-50    50-100    100-350    15-150    15-350    keV
Fluence         PL   4.30e-07  7.04e-07  8.73e-07  2.14e-06  2.61e-06  4.15e-06   erg/cm2
      90%_error_low -4.78e-08 -4.91e-08 -9.09e-08 -4.34e-07 -2.11e-07 -5.20e-07   erg/cm2
      90%_error_hi   4.91e-08  4.91e-08  9.12e-08  5.06e-07  2.13e-07  5.78e-07   erg/cm2
Peak flux       PL   4.66e-01  3.87e-01  2.18e-01  1.82e-01  1.15e+00  1.25e+00   ph/cm2/s
      90%_error_low -7.36e-02 -4.12e-02 -3.76e-02 -5.46e-02 -1.23e-01 -1.37e-01   ph/cm2/s
      90%_error_hi   7.58e-02  4.12e-02  3.80e-02  6.79e-02  1.23e-01  1.37e-01   ph/cm2/s

Fluence        CPL   4.25e-07  7.11e-07  8.73e-07  1.81e-06  2.59e-06  3.82e-06   erg/cm2
      90%_error_low -5.42e-08 -5.56e-08 -9.21e-08 -1.06e-06 -2.57e-07 -1.10e-06   erg/cm2
      90%_error_hi   4.46e-08  6.47e-08  9.27e-08  4.28e-07  2.34e-07  8.68e-07   erg/cm2
Peak flux      CPL   4.62e-01  3.91e-01  2.18e-01  1.56e-01  1.15e+00  1.23e+00   ph/cm2/s
      90%_error_low -7.99e-02 -4.54e-02 -3.91e-02 -1.56e-01 -1.27e-01 -1.75e-01   ph/cm2/s
      90%_error_hi   7.93e-02  5.47e-02  3.87e-02  3.86e-02  1.26e-01  1.60e-01   ph/cm2/s

======================================================================
Image
Pre-slew 15.0-50.0 keV image (Event data)
#RAcent DECcent POSerr Theta  Phi  Peak_Cts  SNR Name
95.338 -62.345 0.000 42.935 -52.232 0.329 8.875 TRIG_00221755

Image time interval: 0.000 to 4.096 [sec]
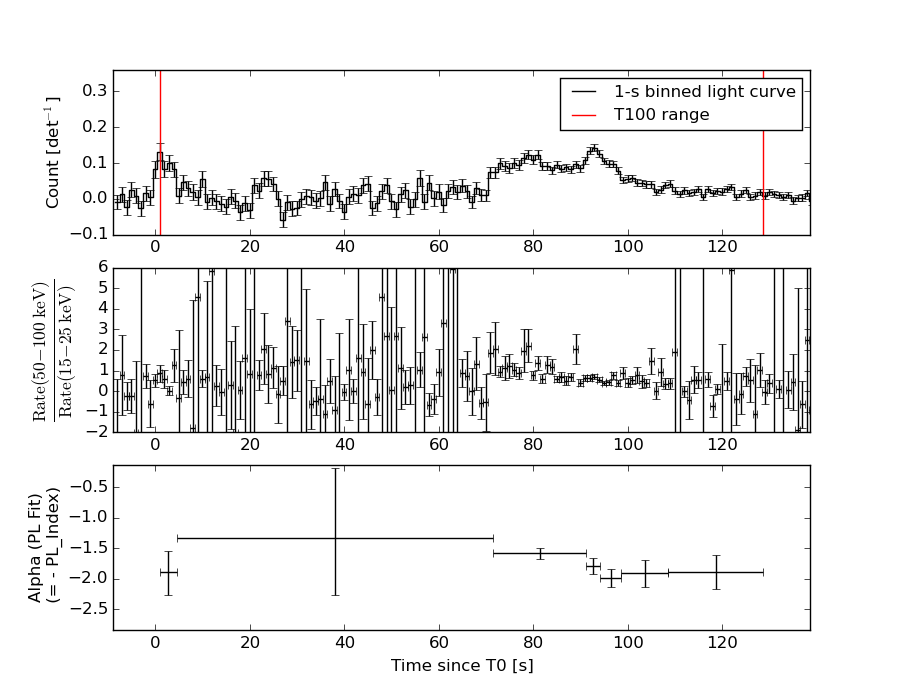
Light Curves
Note: The mask-weighted lightcurves have units of either count/det or counts/sec/det, where a det is 0.4 x 0.4 = 0.16 sq cm.
Full-time range; 1 s binning
Other quick-look light curves:
- 64 ms binning (zoomed)
- 16 ms binning (zoomed)
- 8 ms binning (zoomed)
- 2 ms binning (zoomed)
- SN=5 or 10 s binning (full-time range)
- Raw light curve
Spectra
- 64 ms binning (zoomed)
- 16 ms binning (zoomed)
- 8 ms binning (zoomed)
- 2 ms binning (zoomed)
- SN=5 or 10 s binning (full-time range)
- Raw light curve
Spectra
Notes:
- 1) The fitting includes the systematic errors.
- 2) When the burst includes telescope slew time periods, the fitting uses an average response file made from multiple 5-s response files through out the slew time plus single time preiod for the non-slew times, and weighted by the total counts in the corresponding time period using addrmf. An average response file is needed becuase a spectral fit using the pre-slew DRM will introduce some errors in both a spectral shape and a normalization if the PHA file contains a lot of the slew/post-slew time interval.
- 3) For fits to more complicated models (e.g. a power-law over a cutoff power-law), the BAT team has decided to require a chi-square improvement of more than 6 for each extra dof.
Time averaged spectrum fit using the average DRM
Power-law model
Time interval is from    0.912 sec. to  128.524 sec.

Spectral model in power-law:
------------------------------------------------------------
Parameters  : value       lower 90%   higher 90%
Photon index: -1.68917     ( -0.130041   0.128198 )
Norm@50keV  : 2.20825E-03    ( -0.000168945   0.000167182 )
------------------------------------------------------------
#Fit statistic : Chi-Squared =          56.71 using 59 PHA bins.
# Reduced chi-squared =         0.9949 for     57 degrees of freedom
# Null hypothesis probability =   4.858369e-01

Photon flux (15-150 keV)    in 127.6 sec: 0.292191 ( -0.020471  0.020488 ) ph/cm2/s
Energy fluence (15-150 keV)             : 2.61156e-06 ( -2.10572e-07  2.13125e-07 ) ergs/cm2
Cutoff power-law model
Time interval is from    0.912 sec. to  128.524 sec.
Spectral model in the cutoff power-law:
------------------------------------------------------------
Parameters  : value       lower 90%   higher 90%
Photon index: -1.59911     ( -0.495087   0.538739 )
Epeak [keV] : 201.156      ( -141.095 -204.539 )
Norm@50keV  : 2.47348E-03    ( -0.000489337   0.00233967 )
------------------------------------------------------------
#Fit statistic : Chi-Squared =          56.62 using 59 PHA bins.
# Reduced chi-squared =          1.011 for     56 degrees of freedom
# Null hypothesis probability =   4.517432e-01

Photon flux (15-150 keV)    in 127.6 sec: 0.290900 ( -0.021518  0.021422 ) ph/cm2/s
Energy fluence (15-150 keV)             : 2.58512e-06 ( -2.57083e-07  2.34106e-07 ) ergs/cm2
1-s peak spectrum fit
Power-law model
Time interval is from   91.968 sec. to   92.968 sec.

Spectral model in power-law:
------------------------------------------------------------
Parameters  : value       lower 90%   higher 90%
Photon index: -1.82711     ( -0.206138   0.198028 )
Norm@50keV  : 8.25998E-03    ( -0.00108794   0.00106217 )
------------------------------------------------------------
#Fit statistic : Chi-Squared =          57.53 using 59 PHA bins.
# Reduced chi-squared =          1.009 for     57 degrees of freedom
# Null hypothesis probability =   4.553501e-01

Photon flux (15-150 keV)    in 1 sec: 1.15046 ( -0.1229  0.1229 ) ph/cm2/s
Energy fluence (15-150 keV)             : 7.59924e-08 ( -9.96564e-09  1.01982e-08 ) ergs/cm2
Cutoff power-law model

Time interval is from   91.968 sec. to   92.968 sec.
Spectral model in the cutoff power-law:
------------------------------------------------------------
Parameters  : value       lower 90%   higher 90%
Photon index: -1.73243     ( -0.475095   0.809183 )
Epeak [keV] : 119.324      (   )
Norm@50keV  : 9.37029E-03    (     )
------------------------------------------------------------
#Fit statistic : Chi-Squared =          57.48 using 59 PHA bins.
# Reduced chi-squared =          1.026 for     56 degrees of freedom
# Null hypothesis probability =   4.201201e-01

Photon flux (15-150 keV)    in 1 sec: 1.14605 ( -0.12707  0.12585 ) ph/cm2/s
Energy fluence (15-150 keV)             : 7.50844e-08 ( -1.19669e-08  1.09199e-08 ) ergs/cm2
Time-resolved spectra
Distribution
T90 vs. Hardness ratio plot
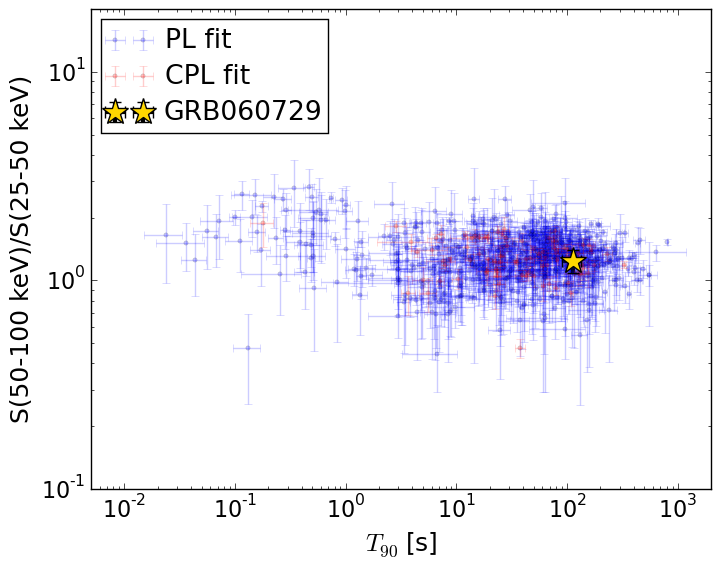
T90                                   = 113.044 sec.
Hardness ratio (energy fluence ratio) = 1.24045203507
S(15-50 keV) vs. S(50-150 keV) plot
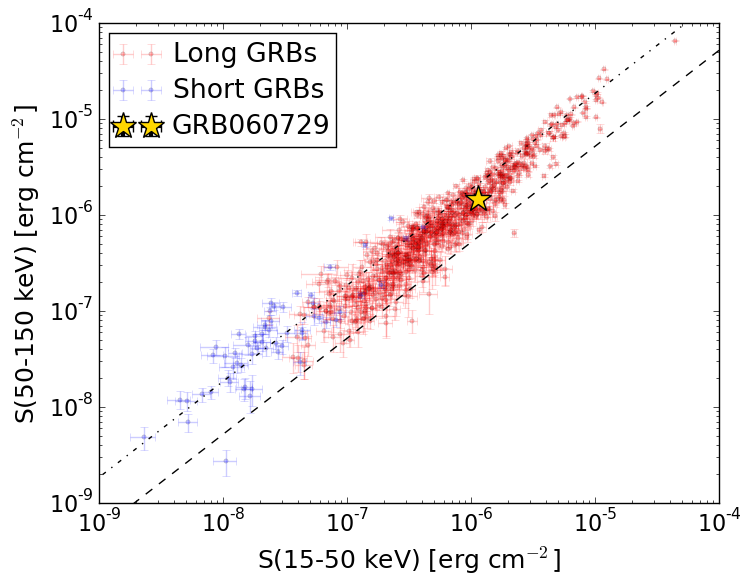
S(15-50 keV)  = 1.1335904e-06
S(50-150 keV) = 1.4779785e-06
The dash-dotted line and the dashed line traces the fluences calculated from the Band function with Epeak = 15 and 150 keV, respectively. Both lines assume a canonical values of alpha = -1 and beta = -2.5.
Mask shadow pattern
IMX = 0.569842731305, IMY = 0.73548003386
Spacecraft aspect plot
Bright source in the pre-burst/pre-slew/post-slew images
Pre-burst image of 15-350 keV band
Time interval of the image:
-239.592000 0.912000

# RAcent  DECcent POSerr Theta    Phi  PeakCts   SNR AngSep     Name
#  [deg]    [deg]    ['] [deg]  [deg]                   [']
166.0563 -70.5429    2.8  58.8  -22.7   4.4940   4.1 ------	UNKNOWN
Pre-slew background subtracted image of 15-350 keV band
Time interval of the image:
0.912000 53.708590

# RAcent  DECcent POSerr Theta    Phi  PeakCts   SNR AngSep     Name
#  [deg]    [deg]    ['] [deg]  [deg]                   [']
Post-slew image of 15-350 keV band
Time interval of the image:
113.508600 962.478100

# RAcent  DECcent POSerr Theta    Phi  PeakCts   SNR AngSep     Name
#  [deg]    [deg]    ['] [deg]  [deg]                   [']
135.5194 -40.5613    0.7  32.3  -55.2  11.0054  17.0    0.6	Vela X-1
170.0925 -60.5543    4.3  33.7   -0.3   1.5201   2.7    7.8	Cen X-3
186.6339 -62.7698    0.6  38.5   10.9  10.5353  17.9    0.6	GX 301-2
 66.7540 -43.5947    3.1  25.1 -176.6   1.5501   3.7 ------	UNKNOWN
 84.7616 -42.2024    2.7  21.1 -143.9   1.8145   4.3 ------	UNKNOWN
180.5768 -36.0496    3.2  56.5  -16.9   5.5972   3.6 ------	UNKNOWN