Analysis Summary
Notes:
- 1) No attempt has been made to eliminate the non-significant decimal places.
- 2) This batgrbproduct analysis is done using the HEASARC data.
- 3) This batgrbproduct analysis is using the flight position for the mask-weighting calculation.
======================================================================
BAT GRB EVENT DATA PROCESSING REPORT
Process Script Ver: batgrbproduct v2.46
Process Start Time: Wed Jan 22 14:43:43 EST 2014
Host Name: batevent1
Current Working Dir: /local/data/batevent/batevent_reproc/trigger222154
======================================================================
Trigger: 00222154 Segment: 000
BAT Trigger Time: 176127376.512 [s; MET]
Trigger Stop: 176127377.024 [s; MET]
UTC: 2006-08-01T12:16:15.158880 [includes UTCF correction]
Where From?: TDRSS position message
BAT
RA: 213.024750261889 Dec: 16.984129194985 [deg; J2000]
Catalogged Source?: NO
Point Source?: YES
GRB Indicated?: YES [ by BAT flight software ]
Image S/N Ratio: 9.35
Image Trigger?: NO
Rate S/N Ratio: 30.0333148353624 [ if not an image trigger ]
Image S/N Ratio: 9.35
Analysis Position: [ source = BAT ]
RA: 213.024750261889 Dec: 16.984129194985 [deg; J2000]
Refined Position: [ source = BAT pre-slew burst ]
RA: 212.984738857627 Dec: 16.9870296817693 [deg; J2000]
{ 14h 11m 56.3s , +16d 59' 13.3" }
+/- 1.7885362900214 [arcmin] (estimated 90% radius based on SNR)
+/- 0.753757204103084 [arcmin] (formal 1-sigma fit error)
SNR: 13.2558413962316
Angular difference between the analysis and refined position is 2.302548 arcmin
Partial Coding Fraction: 1.015625 [ including projection effects ]
Duration
T90: 0.504000008106232 +/- 0.0609262026599676
Measured from: 0.0520000159740448
to: 0.556000024080276 [s; relative to TRIGTIME]
T50: 0.316000014543533 +/- 0.0688185926298914
Measured from: 0.120000004768372
to: 0.436000019311905 [s; relative to TRIGTIME]
Fluence
Peak Flux (peak 1 second)
Measured from: -0.183999985456467
to: 0.816000014543533 [s; relative to TRIGTIME]
Total Fluence
Measured from: 0.0399999916553497
to: 0.587999999523163 [s; relative to TRIGTIME]
Band 1 Band 2 Band 3 Band 4
15-25 25-50 50-100 100-350 keV
Total 0.007862 0.028137 0.042293 0.018488
0.003589 0.004130 0.004067 0.003860 [error]
Peak 0.012885 0.028325 0.043604 0.022565
0.004695 0.005208 0.005002 0.004726 [error]
[ fluence units of on-axis counts / fully illuminated detector ]
======================================================================
====== Table of the duration information =============================
Value tstart tstop
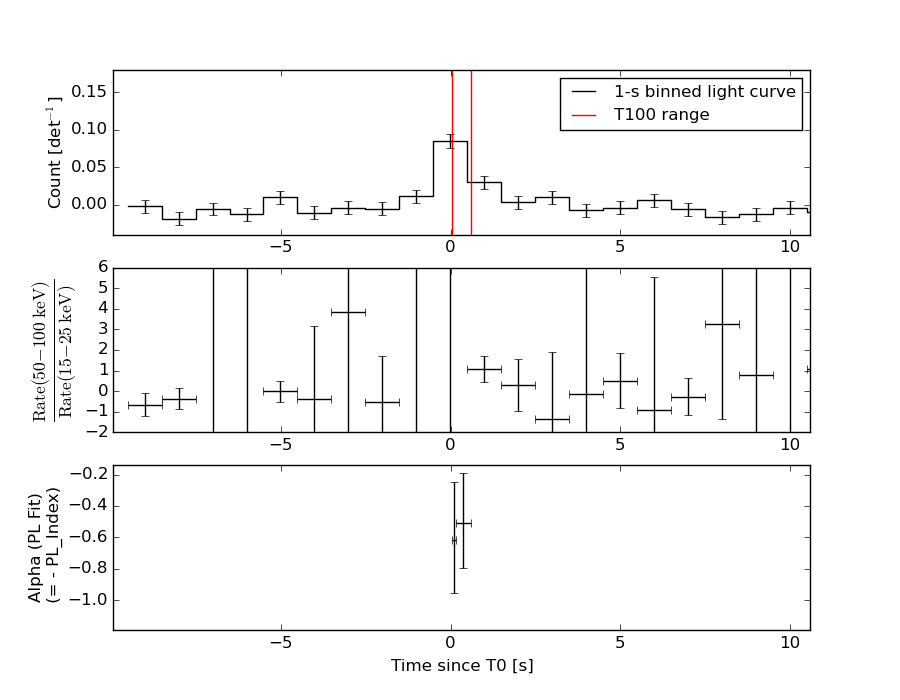
T100 0.548 0.040 0.588
T90 0.504 0.052 0.556
T50 0.316 0.120 0.436
Peak 1.000 -0.184 0.816
====== Spectral Analysis Summary =====================================
Model : spectral model: simple power-law (PL) and cutoff power-law (CPL)
Ph_index : photon index: E^{Ph_index}
Ph_90err : 90% error of the photon index
Epeak : Epeak in keV
Epeak_90err: 90% error of Epeak
Norm : normalization at 50 keV in both the PL model and CPL model
Nomr_90err : 90% error of the normalization
chi2 : Chi-Squared
dof : degree of freedo
=== Time-averaged spectral analysis ===
(Best model with acceptable fit: N/A)
Model Ph_index Ph_90err_low Ph_90err_hi Epeak Epeak_90err_low Epeak_90err_hi Norm Nomr_90err_low Norm_90err_hi chi2 dof
PL -0.484 -0.224 0.242 - - - 1.08e-02 -1.56e-03 1.52e-03 73.430 57
CPL 0.283 -0.851 1.288 190.291 N/A N/A 2.16e-02 N/A N/A 71.740 56
=== 1-s peak spectral analysis ===
(Best model with acceptable fit: PL)
Model Ph_index Ph_90err_low Ph_90err_hi Epeak Epeak_90err_low Epeak_90err_hi Norm Nomr_90err_low Norm_90err_hi chi2 dof
PL -0.531 -0.265 0.290 - - - 6.49e-03 -1.08e-03 1.05e-03 58.320 57
CPL -0.080 -0.567 1.507 272.780 -272.780 -272.780 9.73e-03 -4.13e-03 2.46e-02 57.900 56
=== Fluence/Peak Flux Summary ===
Model Band1 Band2 Band3 Band4 Band5 Total
15-25 25-50 50-100 100-350 15-150 15-350 keV
Fluence PL 2.96e-09 1.02e-08 2.92e-08 2.55e-07 8.05e-08 2.97e-07 erg/cm2
90%_error_low -8.56e-10 -1.90e-09 -3.60e-09 -6.80e-08 -1.04e-08 -6.94e-08 erg/cm2
90%_error_hi 9.71e-10 1.88e-09 3.59e-09 8.69e-08 1.04e-08 8.69e-08 erg/cm2
Peak flux PL 1.06e-01 1.92e-01 2.66e-01 7.66e-01 7.65e-01 1.33e+00 ph/cm2/s
90%_error_low -3.61e-02 -4.30e-02 -3.75e-02 -2.21e-01 -1.12e-01 -2.31e-01 ph/cm2/s
90%_error_hi 4.23e-02 4.27e-02 3.74e-02 2.86e-01 1.12e-01 2.66e-01 ph/cm2/s
Fluence CPL 2.30e-09 1.03e-08 3.18e-08 1.11e-07 7.84e-08 1.56e-07 erg/cm2
90%_error_low -1.06e-09 -2.11e-09 -4.85e-09 -6.66e-08 -1.13e-08 -6.61e-08 erg/cm2
90%_error_hi 1.24e-09 2.08e-09 4.97e-09 1.25e-07 1.10e-08 9.77e-08 erg/cm2
Peak flux CPL 9.11e-02 1.92e-01 2.80e-01 5.11e-01 7.52e-01 1.07e+00 ph/cm2/s
90%_error_low -4.76e-02 -4.64e-02 -4.83e-02 N/A -1.17e-01 -3.37e-01 ph/cm2/s
90%_error_hi 5.38e-02 4.53e-02 5.33e-02 N/A 1.17e-01 3.63e-01 ph/cm2/s
======================================================================
Image
Pre-slew 15.0-350.0 keV image (Event data)
#   RAcent    DECcent   POSerr    Theta     Phi              Peak Cts       SNR   Name
  212.9847    16.9870   0.0145     9.0532   150.5733         0.0999093     13.256 TRIG_00222154

Foreground time interval of the image:
  0.040   0.588 (delta_t =   0.548 [sec])
Background time interval of the image:
-239.512   0.040 (delta_t = 239.552 [sec])
Light Curves
Note: The mask-weighted lightcurves have units of either count/det or counts/sec/det, where a det is 0.4 x 0.4 = 0.16 sq cm.
Full-time range; 1 s binning
Other quick-look light curves:
- 64 ms binning (zoomed)
- 16 ms binning (zoomed)
- 8 ms binning (zoomed)
- 2 ms binning (zoomed)
- SN=5 or 10 s binning (full-time range)
- Raw light curve
Spectra
- 64 ms binning (zoomed)
- 16 ms binning (zoomed)
- 8 ms binning (zoomed)
- 2 ms binning (zoomed)
- SN=5 or 10 s binning (full-time range)
- Raw light curve
Spectra
Notes:
- 1) The fitting includes the systematic errors.
- 2) When the burst includes telescope slew time periods, the fitting uses an average response file made from multiple 5-s response files through out the slew time plus single time preiod for the non-slew times, and weighted by the total counts in the corresponding time period using addrmf. An average response file is needed becuase a spectral fit using the pre-slew DRM will introduce some errors in both a spectral shape and a normalization if the PHA file contains a lot of the slew/post-slew time interval.
- 3) For fits to more complicated models (e.g. a power-law over a cutoff power-law), the BAT team has decided to require a chi-square improvement of more than 6 for each extra dof.
Time averaged spectrum fit using the average DRM
Power-law model
Time interval is from    0.040 sec. to    0.588 sec.

Spectral model in power-law:
------------------------------------------------------------
Parameters  : value       lower 90%   higher 90%
Photon index: -0.483733     ( -0.223854   0.241854 )
Norm@50keV  : 1.08415E-02    ( -0.0015633   0.00152089 )
------------------------------------------------------------
#Fit statistic : Chi-Squared =          73.43 using 59 PHA bins.
# Reduced chi-squared =          1.288 for     57 degrees of freedom
# Null hypothesis probability =   7.042899e-02

Photon flux (15-150 keV)    in 0.548 sec: 1.28747 ( -0.16201  0.16262 ) ph/cm2/s
Energy fluence (15-150 keV)             : 8.04913e-08 ( -1.03699e-08  1.04163e-08 ) ergs/cm2
Cutoff power-law model
Time interval is from    0.040 sec. to    0.588 sec.
Spectral model in the cutoff power-law:
------------------------------------------------------------
Parameters  : value       lower 90%   higher 90%
Photon index: 0.282657     ( -0.851151   1.28846 )
Epeak [keV] : 190.291      (   )
Norm@50keV  : 2.16014E-02    (     )
------------------------------------------------------------
#Fit statistic : Chi-Squared =          71.74 using 59 PHA bins.
# Reduced chi-squared =          1.281 for     56 degrees of freedom
# Null hypothesis probability =   7.656385e-02

Photon flux (15-150 keV)    in 0.548 sec: 1.25487 ( -0.16794  0.16815 ) ph/cm2/s
Energy fluence (15-150 keV)             : 7.83919e-08 ( -1.12984e-08  1.1021e-08 ) ergs/cm2
1-s peak spectrum fit
Power-law model
Time interval is from   -0.184 sec. to    0.816 sec.

Spectral model in power-law:
------------------------------------------------------------
Parameters  : value       lower 90%   higher 90%
Photon index: -0.530925     ( -0.265293   0.289923 )
Norm@50keV  : 6.48981E-03    ( -0.00108351   0.00104654 )
------------------------------------------------------------
#Fit statistic : Chi-Squared =          58.32 using 59 PHA bins.
# Reduced chi-squared =          1.023 for     57 degrees of freedom
# Null hypothesis probability =   4.264378e-01

Photon flux (15-150 keV)    in 1 sec: 0.764870 ( -0.111772  0.112357 ) ph/cm2/s
Energy fluence (15-150 keV)             : 8.58539e-08 ( -1.27938e-08  1.28604e-08 ) ergs/cm2
Cutoff power-law model
Time interval is from   -0.184 sec. to    0.816 sec.
Spectral model in the cutoff power-law:
------------------------------------------------------------
Parameters  : value       lower 90%   higher 90%
Photon index: -0.0804961     ( -0.566834   1.5066 )
Epeak [keV] : 272.780      ( -272.766 -272.766 )
Norm@50keV  : 9.72895E-03    ( -0.00413146   0.0246226 )
------------------------------------------------------------
#Fit statistic : Chi-Squared =          57.90 using 59 PHA bins.
# Reduced chi-squared =          1.034 for     56 degrees of freedom
# Null hypothesis probability =   4.049557e-01

Photon flux (15-150 keV)    in 1 sec: 0.751853 ( -0.117276  0.117182 ) ph/cm2/s
Energy fluence (15-150 keV)             : 8.45026e-08 ( -1.38741e-08  1.34216e-08 ) ergs/cm2
Time-resolved spectra
Distribution
T90 vs. Hardness ratio plot
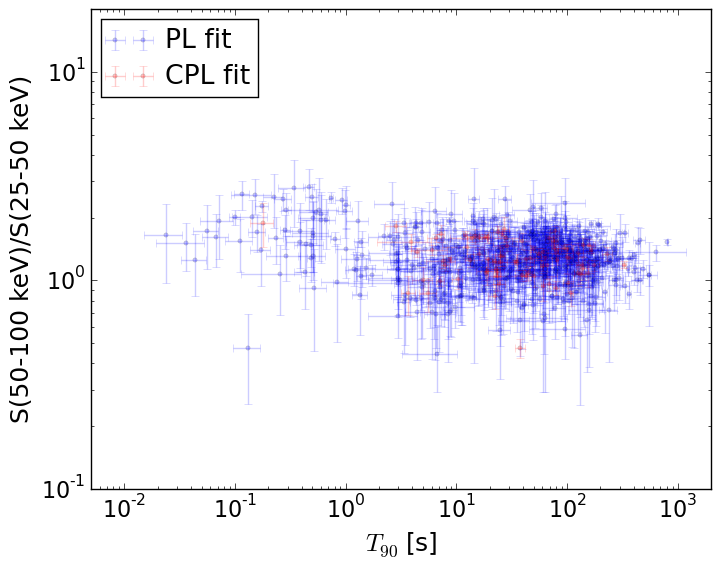
T90                                   = N/A sec.
Hardness ratio (energy fluence ratio) = N/A
S(15-50 keV) vs. S(50-150 keV) plot
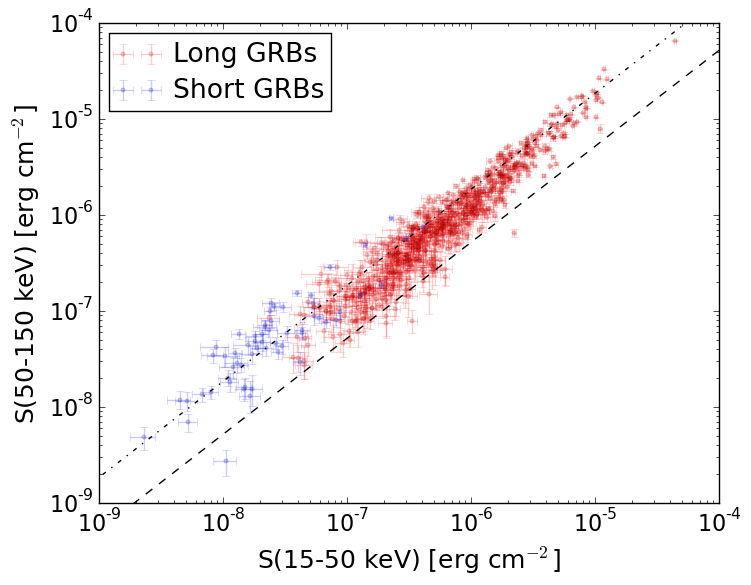
S(15-50 keV)  = N/A
S(50-150 keV) = N/A
The dash-dotted line and the dashed line traces the fluences calculated from the Band function with Epeak = 15 and 150 keV, respectively. Both lines assume a canonical values of alpha = -1 and beta = -2.5.
Mask shadow pattern
IMX = -1.387802605343761E-01, IMY = -7.828382608907439E-02
Spacecraft aspect plot
Bright source in the pre-burst/pre-slew/post-slew images
Pre-burst image of 15-350 keV band
Time interval of the image:
-239.512000 0.040000

# RAcent  DECcent POSerr Theta    Phi  PeakCts   SNR AngSep     Name
#  [deg]    [deg]    ['] [deg]  [deg]                   [']
254.4061  35.4220    5.1  37.9   45.4   0.7933   2.3    5.4	Her X-1
229.8277 -15.6757    2.6  45.3  135.1   2.7189   4.4 ------	UNKNOWN
235.9618  37.5980    2.6  23.9   35.2   0.7209   4.5 ------	UNKNOWN
224.4958  33.1106    2.5  13.5   35.2   0.6702   4.6 ------	UNKNOWN
168.8896  40.3250    2.6  37.9  -76.3   1.9991   4.5 ------	UNKNOWN
165.8988  16.7730    3.5  43.1 -112.3   2.4872   3.3 ------	UNKNOWN
Pre-slew background subtracted image of 15-350 keV band
Time interval of the image:
0.040000 0.588000

# RAcent  DECcent POSerr Theta    Phi  PeakCts   SNR AngSep     Name
#  [deg]    [deg]    ['] [deg]  [deg]                   [']
254.4936  35.2232   15.6  38.0   45.7  -0.0127  -0.7    7.4	Her X-1
260.5717  28.5425    2.3  43.5   55.5   0.1765   5.1 ------	UNKNOWN
212.9847  16.9870    0.9   9.1  150.6   0.0999  13.3 ------	UNKNOWN
193.8789   5.9810    2.0  26.0 -156.5   0.0465   5.6 ------	UNKNOWN
170.5111   3.7675    2.3  45.0 -132.0   0.1066   5.1 ------	UNKNOWN
Post-slew image of 15-350 keV band
Time interval of the image:
46.988600 962.568000

# RAcent  DECcent POSerr Theta    Phi  PeakCts   SNR AngSep     Name
#  [deg]    [deg]    ['] [deg]  [deg]                   [']
254.4582  35.3455    5.0  41.1   40.2   2.1646   2.3    0.2	Her X-1
225.2253  25.4128    3.4  14.1   36.4   1.2574   3.4 ------	UNKNOWN
227.0607  40.1086    2.9  26.1    9.9   1.5971   3.9 ------	UNKNOWN
227.7178  44.7917    2.4  30.4    5.8   2.1852   4.9 ------	UNKNOWN
178.6260 -19.0276    3.0  49.4 -150.4   4.2166   3.9 ------	UNKNOWN