Analysis Summary
Notes:
- 1) No attempt has been made to eliminate the non-significant decimal places.
- 2) This batgrbproduct analysis is done using the HEASARC data.
- 3) This batgrbproduct analysis is using the flight position for the mask-weighting calculation.
======================================================================
BAT GRB EVENT DATA PROCESSING REPORT
Process Script Ver: batgrbproduct v2.46
Process Start Time: Wed Jan 22 14:37:38 EST 2014
Host Name: batevent1
Current Working Dir: /local/data/batevent/batevent_reproc/trigger222546
======================================================================
Trigger: 00222546 Segment: 000
BAT Trigger Time: 176369301.184 [s; MET]
Trigger Stop: 176369309.376 [s; MET]
UTC: 2006-08-04T07:28:19.825160 [includes UTCF correction]
Where From?: TDRSS position message
BAT
RA: 112.201199296934 Dec: -27.2313754670281 [deg; J2000]
Catalogged Source?: NO
Point Source?: YES
GRB Indicated?: YES [ by BAT flight software ]
Image S/N Ratio: 8.92
Image Trigger?: NO
Rate S/N Ratio: 10.816653826392 [ if not an image trigger ]
Image S/N Ratio: 8.92
Analysis Position: [ source = BAT ]
RA: 112.201199296934 Dec: -27.2313754670281 [deg; J2000]
Refined Position: [ source = BAT pre-slew burst ]
RA: 112.221032429631 Dec: -27.2282273464159 [deg; J2000]
{ 07h 28m 53.0s , -27d 13' 41.6" }
+/- 2.07292230462618 [arcmin] (estimated 90% radius based on SNR)
+/- 0.97175152518805 [arcmin] (formal 1-sigma fit error)
SNR: 10.7363563153294
Angular difference between the analysis and refined position is 1.074839 arcmin
Partial Coding Fraction: 0.1894531 [ including projection effects ]
Duration
T90: 18.188000023365 +/- 2.65723162056136
Measured from: -12.9519999921322
to: 5.23600003123283 [s; relative to TRIGTIME]
T50: 11.3400000035763 +/- 5.37857420360907
Measured from: -8.13999998569489
to: 3.20000001788139 [s; relative to TRIGTIME]
Fluence
Peak Flux (peak 1 second)
Measured from: 4.5160000026226
to: 5.5160000026226 [s; relative to TRIGTIME]
Total Fluence
Measured from: -14.0599999725819
to: 5.54800000786781 [s; relative to TRIGTIME]
Band 1 Band 2 Band 3 Band 4
15-25 25-50 50-100 100-350 keV
Total 0.280744 0.402184 0.180068 0.094338
0.046986 0.049801 0.043516 0.038509 [error]
Peak 0.036120 0.043100 0.045042 0.027139
0.011348 0.011563 0.010762 0.008650 [error]
[ fluence units of on-axis counts / fully illuminated detector ]
======================================================================
====== Table of the duration information =============================
Value tstart tstop
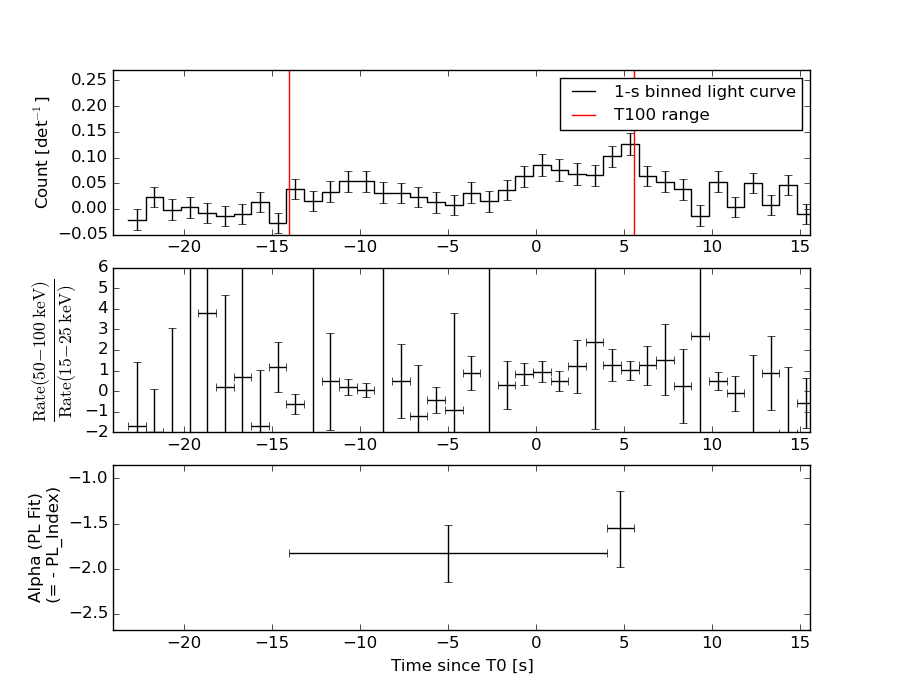
T100 19.608 -14.060 5.548
T90 18.188 -12.952 5.236
T50 11.340 -8.140 3.200
Peak 1.000 4.516 5.516
====== Spectral Analysis Summary =====================================
Model : spectral model: simple power-law (PL) and cutoff power-law (CPL)
Ph_index : photon index: E^{Ph_index}
Ph_90err : 90% error of the photon index
Epeak : Epeak in keV
Epeak_90err: 90% error of Epeak
Norm : normalization at 50 keV in both the PL model and CPL model
Nomr_90err : 90% error of the normalization
chi2 : Chi-Squared
dof : degree of freedo
=== Time-averaged spectral analysis ===
(Best model with acceptable fit: N/A)
Model Ph_index Ph_90err_low Ph_90err_hi Epeak Epeak_90err_low Epeak_90err_hi Norm Nomr_90err_low Norm_90err_hi chi2 dof
PL -1.783 -0.273 0.261 - - - 2.95e-03 -5.26e-04 5.15e-04 83.780 57
CPL -0.159 -1.861 3.365 43.583 -9.373 -43.583 2.86e-02 -2.86e-02 3.66e+00 81.790 56
=== 1-s peak spectral analysis ===
(Best model with acceptable fit: PL)
Model Ph_index Ph_90err_low Ph_90err_hi Epeak Epeak_90err_low Epeak_90err_hi Norm Nomr_90err_low Norm_90err_hi chi2 dof
PL -1.447 -0.485 0.481 - - - 9.30e-03 -2.26e-03 2.23e-03 58.110 57
CPL -1.470 -0.463 0.731 9999.350 -9999.350 -9999.350 9.30e-03 -2.23e-03 1.10e-02 58.130 56
=== Fluence/Peak Flux Summary ===
Model Band1 Band2 Band3 Band4 Band5 Total
15-25 25-50 50-100 100-350 15-150 15-350 keV
Fluence PL 9.64e-08 1.49e-07 1.73e-07 3.88e-07 5.33e-07 8.06e-07 erg/cm2
90%_error_low -2.13e-08 -2.30e-08 -4.04e-08 -1.54e-07 -9.57e-08 -2.03e-07 erg/cm2
90%_error_hi 2.20e-08 2.30e-08 4.11e-08 2.11e-07 9.79e-08 2.47e-07 erg/cm2
Peak flux PL 3.64e-01 3.78e-01 2.77e-01 3.27e-01 1.14e+00 1.35e+00 ph/cm2/s
90%_error_low -1.59e-01 -1.07e-01 -8.72e-02 -1.77e-01 -2.86e-01 -3.23e-01 ph/cm2/s
90%_error_hi 1.81e-01 1.00e-01 8.16e-02 2.69e-01 2.86e-01 3.26e-01 ph/cm2/s
Fluence CPL 8.82e-08 1.81e-07 1.42e-07 3.10e-08 4.37e-07 4.44e-07 erg/cm2
90%_error_low -2.58e-08 -4.34e-08 -7.87e-08 N/A -1.07e-07 -1.15e-07 erg/cm2
90%_error_hi 2.48e-08 4.43e-08 6.41e-08 N/A 1.50e-07 4.31e-07 erg/cm2
Peak flux CPL 3.64e-01 3.78e-01 2.71e-01 3.34e-01 1.17e+00 1.33e+00 ph/cm2/s
90%_error_low -1.60e-01 -1.10e-01 -8.44e-02 N/A -3.07e-01 -3.09e-01 ph/cm2/s
90%_error_hi 1.81e-01 1.04e-01 8.98e-02 N/A 2.68e-01 3.36e-01 ph/cm2/s
======================================================================
Image
Pre-slew 15.0-350.0 keV image (Event data)
#   RAcent    DECcent   POSerr    Theta     Phi              Peak Cts       SNR   Name
  112.2210   -27.2282   0.0179    36.8587   -95.7660         1.0635654     10.736 TRIG_00222546

Foreground time interval of the image:
-14.060   5.548 (delta_t =  19.608 [sec])
Background time interval of the image:
-239.184 -14.060 (delta_t = 225.124 [sec])
Light Curves
Note: The mask-weighted lightcurves have units of either count/det or counts/sec/det, where a det is 0.4 x 0.4 = 0.16 sq cm.
Full-time range; 1 s binning
Other quick-look light curves:
- 64 ms binning (zoomed)
- 16 ms binning (zoomed)
- 8 ms binning (zoomed)
- 2 ms binning (zoomed)
- SN=5 or 10 s binning (full-time range)
- Raw light curve
Spectra
- 64 ms binning (zoomed)
- 16 ms binning (zoomed)
- 8 ms binning (zoomed)
- 2 ms binning (zoomed)
- SN=5 or 10 s binning (full-time range)
- Raw light curve
Spectra
Notes:
- 1) The fitting includes the systematic errors.
- 2) When the burst includes telescope slew time periods, the fitting uses an average response file made from multiple 5-s response files through out the slew time plus single time preiod for the non-slew times, and weighted by the total counts in the corresponding time period using addrmf. An average response file is needed becuase a spectral fit using the pre-slew DRM will introduce some errors in both a spectral shape and a normalization if the PHA file contains a lot of the slew/post-slew time interval.
- 3) For fits to more complicated models (e.g. a power-law over a cutoff power-law), the BAT team has decided to require a chi-square improvement of more than 6 for each extra dof.
Time averaged spectrum fit using the average DRM
Power-law model
Time interval is from  -14.060 sec. to    5.548 sec.

Spectral model in power-law:
------------------------------------------------------------
Parameters  : value       lower 90%   higher 90%
Photon index: -1.78325     ( -0.272508   0.261404 )
Norm@50keV  : 2.94996E-03    ( -0.000526281   0.000514602 )
------------------------------------------------------------
#Fit statistic : Chi-Squared =          83.78 using 59 PHA bins.
# Reduced chi-squared =          1.470 for     57 degrees of freedom
# Null hypothesis probability =   1.199791e-02

Photon flux (15-150 keV)    in 19.61 sec: 0.403910 ( -0.06264  0.062669 ) ph/cm2/s
Energy fluence (15-150 keV)             : 5.32988e-07 ( -9.56597e-08  9.78931e-08 ) ergs/cm2
Cutoff power-law model
Time interval is from  -14.060 sec. to    5.548 sec.
Spectral model in the cutoff power-law:
------------------------------------------------------------
Parameters  : value       lower 90%   higher 90%
Photon index: -0.158784     ( -1.88079   3.34509 )
Epeak [keV] : 43.5832      ( -9.18317 -43.3934 )
Norm@50keV  : 2.85622E-02    ( -0.0305687   3.65817 )
------------------------------------------------------------
#Fit statistic : Chi-Squared =          81.79 using 59 PHA bins.
# Reduced chi-squared =          1.460 for     56 degrees of freedom
# Null hypothesis probability =   1.390034e-02

Photon flux (15-150 keV)    in 19.61 sec: 0.382182 ( -0.068219  0.06875 ) ph/cm2/s
Energy fluence (15-150 keV)             : 4.36523e-07 ( -1.07097e-07  1.4995e-07 ) ergs/cm2
1-s peak spectrum fit
Power-law model
Time interval is from    4.516 sec. to    5.516 sec.

Spectral model in power-law:
------------------------------------------------------------
Parameters  : value       lower 90%   higher 90%
Photon index: -1.44713     ( -0.485558   0.480431 )
Norm@50keV  : 9.29589E-03    ( -0.00225614   0.00222659 )
------------------------------------------------------------
#Fit statistic : Chi-Squared =          58.11 using 59 PHA bins.
# Reduced chi-squared =          1.020 for     57 degrees of freedom
# Null hypothesis probability =   4.340790e-01

Photon flux (15-150 keV)    in 1 sec: 1.14478 ( -0.285757  0.28618 ) ph/cm2/s
Energy fluence (15-150 keV)             : 8.90164e-08 ( -2.36913e-08  2.37683e-08 ) ergs/cm2
Cutoff power-law model
Time interval is from    4.516 sec. to    5.516 sec.
Spectral model in the cutoff power-law:
------------------------------------------------------------
Parameters  : value       lower 90%   higher 90%
Photon index: -1.47029     ( -0.464583   0.729767 )
Epeak [keV] : 9999.35      ( -9999.36 -9999.36 )
Norm@50keV  : 9.29888E-03    ( -0.00223654   0.0109629 )
------------------------------------------------------------
#Fit statistic : Chi-Squared =          58.13 using 59 PHA bins.
# Reduced chi-squared =          1.038 for     56 degrees of freedom
# Null hypothesis probability =   3.967386e-01

Photon flux (15-150 keV)    in 1 sec: 1.16770 ( -0.306825  0.26753 ) ph/cm2/s
Energy fluence (15-150 keV)             : 4.22824e-08 ( -3.09307e-08  2.41133e-08 ) ergs/cm2
Time-resolved spectra
Distribution
T90 vs. Hardness ratio plot
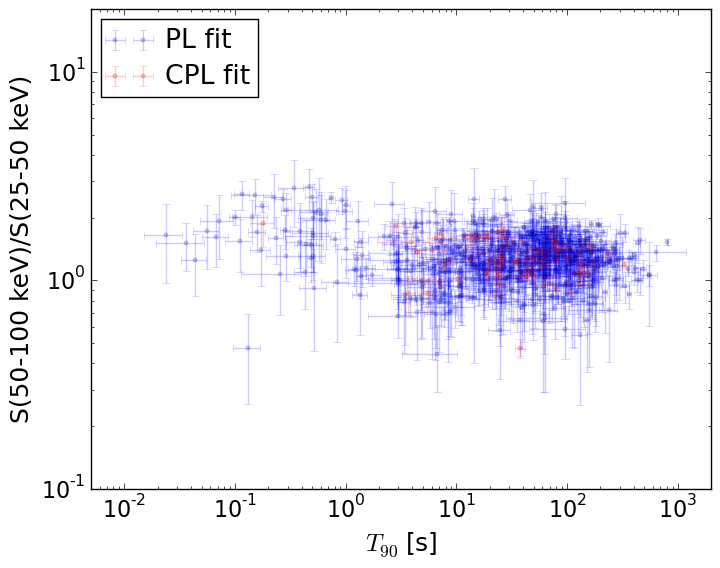
T90                                   = N/A sec.
Hardness ratio (energy fluence ratio) = N/A
S(15-50 keV) vs. S(50-150 keV) plot
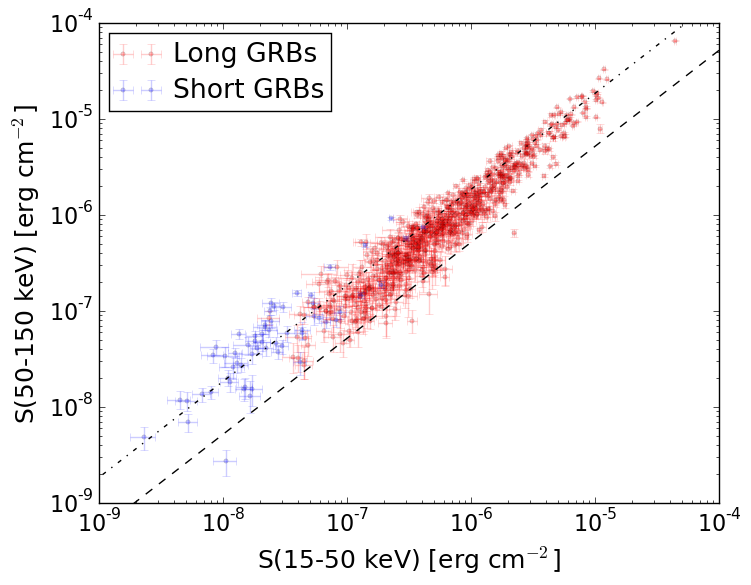
S(15-50 keV)  = N/A
S(50-150 keV) = N/A
The dash-dotted line and the dashed line traces the fluences calculated from the Band function with Epeak = 15 and 150 keV, respectively. Both lines assume a canonical values of alpha = -1 and beta = -2.5.
Mask shadow pattern
IMX = -7.531924975437265E-02, IMY = 7.459008555131527E-01
Spacecraft aspect plot
Bright source in the pre-burst/pre-slew/post-slew images
Pre-burst image of 15-350 keV band
Time interval of the image:
-239.184000 -14.060000

# RAcent  DECcent POSerr Theta    Phi  PeakCts   SNR AngSep     Name
#  [deg]    [deg]    ['] [deg]  [deg]                   [']
135.6881 -40.4183    0.0  32.4  -54.6  -0.4311  -1.9   10.9	Vela X-1
170.4084 -60.4332    0.0  33.9    0.2   0.3408   1.6   11.7	Cen X-3
186.6436 -62.7760    1.1  38.4   11.5   2.3527  10.7    0.5	GX 301-2
 54.3004 -15.6778    2.7  54.9 -171.9   2.1736   4.3 ------	UNKNOWN
 85.9710 -29.8548    3.0  33.1 -136.3   0.7500   3.9 ------	UNKNOWN
152.4980 -36.5119    2.4  43.1  -40.5   1.3850   4.8 ------	UNKNOWN
Pre-slew background subtracted image of 15-350 keV band
Time interval of the image:
-14.060000 5.548000

# RAcent  DECcent POSerr Theta    Phi  PeakCts   SNR AngSep     Name
#  [deg]    [deg]    ['] [deg]  [deg]                   [']
135.6881 -40.4183    0.0  32.4  -54.6  -0.0646  -1.2   10.9	Vela X-1
170.5673 -60.6862   10.1  33.8    0.7   0.0577   1.1    8.3	Cen X-3
186.5932 -62.8166    3.2  38.4   11.5  -0.2213  -3.6    3.3	GX 301-2
 27.8413 -52.9671    2.0  35.5  132.2   0.4174   5.7 ------	UNKNOWN
 34.9574 -24.9921    2.5  54.4  163.1   1.0966   4.6 ------	UNKNOWN
 84.3353 -32.3936    2.5  30.8 -139.6   0.2204   4.7 ------	UNKNOWN
142.7621 -39.4300    2.3  36.3  -47.7   0.3181   5.1 ------	UNKNOWN
129.5661 -33.7468    1.9  35.8  -68.2   0.4316   6.0 ------	UNKNOWN
112.2210 -27.2282    1.1  36.9  -95.8   1.0636  10.7 ------	UNKNOWN
Post-slew image of 15-350 keV band
Time interval of the image:
105.516600 711.416610

# RAcent  DECcent POSerr Theta    Phi  PeakCts   SNR AngSep     Name
#  [deg]    [deg]    ['] [deg]  [deg]                   [']
 83.6416  22.0186    0.9  56.5 -150.3  21.5909  12.9    0.5	Crab
135.6699 -40.7234    0.0  23.5   12.8  -0.3282  -1.2   12.0	Vela X-1
170.2851 -60.6064   25.4  51.0   29.4   0.6159   0.5    1.3	Cen X-3
 93.6211 -57.9409    3.6  33.4   79.8   1.7703   3.3 ------	UNKNOWN
 58.7458 -16.3769    3.3  50.4  152.6   4.9513   3.5 ------	UNKNOWN
179.0344 -42.3055    2.4  55.5    6.2   6.4424   4.9 ------	UNKNOWN
168.6260 -43.1820    2.3  47.8    6.7   2.8469   5.0 ------	UNKNOWN