Analysis Summary
Notes:
- 1) No attempt has been made to eliminate the non-significant decimal places.
- 2) This batgrbproduct analysis is done using the HEASARC data.
- 3) This batgrbproduct analysis is using the flight position for the mask-weighting calculation.
======================================================================
BAT GRB EVENT DATA PROCESSING REPORT
Process Script Ver: batgrbproduct v2.46
Process Start Time: Wed Jan 22 14:33:54 EST 2014
Host Name: batevent1
Current Working Dir: /local/data/batevent/batevent_reproc/trigger222683
======================================================================
Trigger: 00222683 Segment: 000
BAT Trigger Time: 176446070.528 [s; MET]
Trigger Stop: 176446074.624 [s; MET]
UTC: 2006-08-05T04:47:49.167340 [includes UTCF correction]
Where From?: TDRSS position message
BAT
RA: 220.918978393931 Dec: 12.5923851602665 [deg; J2000]
Catalogged Source?: NO
Point Source?: YES
GRB Indicated?: YES [ by BAT flight software ]
Image S/N Ratio: 7.64
Image Trigger?: NO
Rate S/N Ratio: 10.7238052947636 [ if not an image trigger ]
Image S/N Ratio: 7.64
Analysis Position: [ source = BAT ]
RA: 220.918978393931 Dec: 12.5923851602665 [deg; J2000]
Refined Position: [ source = BAT pre-slew burst ]
RA: 220.919 Dec: 12.5924 [deg; J2000]
{ 14h 43m 40.6s , +12d 35' 32.6" }
+/- 2.65704343405 [arcmin] (estimated 90% radius based on SNR)
SNR: 7.53167214015
Angular difference between the analysis and refined position is 0.001547 arcmin
Partial Coding Fraction: 0.9609375 [ including projection effects ]
Duration
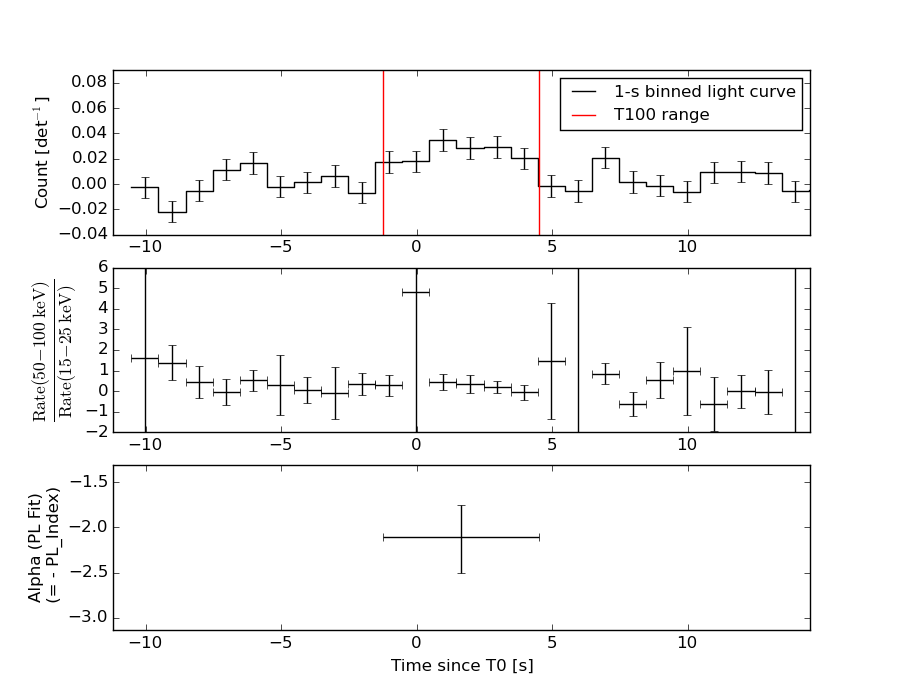
T90: 4.92799997329712 +/- 1.3535848370652
Measured from: -0.967999994754791
to: 3.95999997854233 [s; relative to TRIGTIME]
T50: 1.85599997639656 +/- 1.57673080027528
Measured from: 1.22400000691414
to: 3.0799999833107 [s; relative to TRIGTIME]
Fluence
Peak Flux (peak 1 second)
Measured from: 0.715999990701675
to: 1.71599999070168 [s; relative to TRIGTIME]
Total Fluence
Measured from: -1.22400000691414
to: 4.52000001072884 [s; relative to TRIGTIME]
Band 1 Band 2 Band 3 Band 4
15-25 25-50 50-100 100-350 keV
Total 0.058040 0.073028 0.019956 -0.001675
0.011148 0.011449 0.009955 0.008474 [error]
Peak 0.013319 0.021062 0.007894 -0.000102
0.004809 0.004973 0.004196 0.003521 [error]
[ fluence units of on-axis counts / fully illuminated detector ]
======================================================================
====== Table of the duration information =============================
Value tstart tstop
T100 5.744 -1.224 4.520
T90 4.928 -0.968 3.960
T50 1.856 1.224 3.080
Peak 1.000 0.716 1.716
====== Spectral Analysis Summary =====================================
Model : spectral model: simple power-law (PL) and cutoff power-law (CPL)
Ph_index : photon index: E^{Ph_index}
Ph_90err : 90% error of the photon index
Epeak : Epeak in keV
Epeak_90err: 90% error of Epeak
Norm : normalization at 50 keV in both the PL model and CPL model
Nomr_90err : 90% error of the normalization
chi2 : Chi-Squared
dof : degree of freedo
=== Time-averaged spectral analysis ===
(Best model with acceptable fit: PL)
Model Ph_index Ph_90err_low Ph_90err_hi Epeak Epeak_90err_low Epeak_90err_hi Norm Nomr_90err_low Norm_90err_hi chi2 dof
PL -2.106 -0.403 0.356 - - - 1.37e-03 -4.00e-04 3.94e-04 62.310 57
CPL 0.494 -2.252 7.380 31.941 -7.448 12.564 7.07e-02 -7.07e-02 8.47e+03 58.200 56
=== 1-s peak spectral analysis ===
(Best model with acceptable fit: N/A)
Model Ph_index Ph_90err_low Ph_90err_hi Epeak Epeak_90err_low Epeak_90err_hi Norm Nomr_90err_low Norm_90err_hi chi2 dof
PL -1.684 -0.575 0.543 - - - 2.35e-03 -9.20e-04 9.03e-04 53.050 57
CPL 0.481 -1.358 -0.481 43.330 -15.306 17.308 4.72e-02 -4.72e-02 1.76e+05 50.330 56
=== Fluence/Peak Flux Summary ===
Model Band1 Band2 Band3 Band4 Band5 Total
15-25 25-50 50-100 100-350 15-150 15-350 keV
Fluence PL 1.78e-08 2.27e-08 2.11e-08 3.44e-08 7.31e-08 9.58e-08 erg/cm2
90%_error_low -4.38e-09 -4.97e-09 -7.79e-09 -1.93e-08 -1.87e-08 -3.12e-08 erg/cm2
90%_error_hi 4.47e-09 4.88e-09 8.57e-09 3.16e-08 2.00e-08 4.13e-08 erg/cm2
Peak flux PL 1.15e-01 1.04e-01 6.49e-02 6.16e-02 3.10e-01 3.46e-01 ph/cm2/s
90%_error_low -5.32e-02 -3.64e-02 -3.23e-02 -6.16e-02 -1.08e-01 -1.22e-01 ph/cm2/s
90%_error_hi 5.81e-02 3.63e-02 3.19e-02 7.32e-02 1.08e-01 1.26e-01 ph/cm2/s
Fluence CPL 1.70e-08 2.93e-08 8.88e-09 1.99e-10 5.53e-08 5.55e-08 erg/cm2
90%_error_low -5.02e-09 -7.47e-09 -7.92e-09 N/A -1.46e-08 -1.48e-08 erg/cm2
90%_error_hi 4.97e-09 7.60e-09 1.54e-08 N/A 2.22e-08 2.64e-08 erg/cm2
Peak flux CPL 8.95e-02 1.72e-01 1.24e-02 1.72e-06 2.74e-01 2.74e-01 ph/cm2/s
90%_error_low -5.31e-02 -6.57e-02 -1.24e-02 -1.72e-06 -9.37e-02 -9.38e-02 ph/cm2/s
90%_error_hi 6.74e-02 6.03e-02 6.87e-02 2.18e-02 1.03e-01 1.03e-01 ph/cm2/s
======================================================================
Image
Pre-slew 15.0-50.0 keV image (Event data)
#RAcent DECcent POSerr Theta  Phi  Peak_Cts  SNR Name
220.919 12.592 0.000 8.780 104.685 0.103 7.532 TRIG_00222683

Image time interval: 0.000 to 4.096 [sec]
Light Curves
Note: The mask-weighted lightcurves have units of either count/det or counts/sec/det, where a det is 0.4 x 0.4 = 0.16 sq cm.
Full-time range; 1 s binning
Other quick-look light curves:
- 64 ms binning (zoomed)
- 16 ms binning (zoomed)
- 8 ms binning (zoomed)
- 2 ms binning (zoomed)
- SN=5 or 10 s binning (full-time range)
- Raw light curve
Spectra
- 64 ms binning (zoomed)
- 16 ms binning (zoomed)
- 8 ms binning (zoomed)
- 2 ms binning (zoomed)
- SN=5 or 10 s binning (full-time range)
- Raw light curve
Spectra
Notes:
- 1) The fitting includes the systematic errors.
- 2) When the burst includes telescope slew time periods, the fitting uses an average response file made from multiple 5-s response files through out the slew time plus single time preiod for the non-slew times, and weighted by the total counts in the corresponding time period using addrmf. An average response file is needed becuase a spectral fit using the pre-slew DRM will introduce some errors in both a spectral shape and a normalization if the PHA file contains a lot of the slew/post-slew time interval.
- 3) For fits to more complicated models (e.g. a power-law over a cutoff power-law), the BAT team has decided to require a chi-square improvement of more than 6 for each extra dof.
Time averaged spectrum fit using the average DRM
Power-law model
Time interval is from   -1.224 sec. to    4.520 sec.

Spectral model in power-law:
------------------------------------------------------------
Parameters  : value       lower 90%   higher 90%
Photon index: -2.10552     ( -0.403144   0.35626 )
Norm@50keV  : 1.36950E-03    ( -0.000399684   0.000393865 )
------------------------------------------------------------
#Fit statistic : Chi-Squared =          62.31 using 59 PHA bins.
# Reduced chi-squared =          1.093 for     57 degrees of freedom
# Null hypothesis probability =   2.929173e-01

Photon flux (15-150 keV)    in 5.744 sec: 0.216062 ( -0.044058  0.044115 ) ph/cm2/s
Energy fluence (15-150 keV)             : 7.31349e-08 ( -1.87167e-08  1.99704e-08 ) ergs/cm2
Cutoff power-law model
Time interval is from   -1.224 sec. to    4.520 sec.
Spectral model in the cutoff power-law:
------------------------------------------------------------
Parameters  : value       lower 90%   higher 90%
Photon index: 1.47728     ( -2.28629   7.34479 )
Epeak [keV] : 31.2362      ( -7.40002 12.6119 )
Norm@50keV  : 0.337298    ( -0.317405   8471.08 )
------------------------------------------------------------
#Fit statistic : Chi-Squared =          58.11 using 59 PHA bins.
# Reduced chi-squared =          1.038 for     56 degrees of freedom
# Null hypothesis probability =   3.973423e-01

Photon flux (15-150 keV)    in 5.744 sec: 0.202887 ( -0.043358  0.0443 ) ph/cm2/s
Energy fluence (15-150 keV)             : 5.53075e-08 ( -1.46235e-08  2.22483e-08 ) ergs/cm2
1-s peak spectrum fit
Power-law model
Time interval is from    0.716 sec. to    1.716 sec.

Spectral model in power-law:
------------------------------------------------------------
Parameters  : value       lower 90%   higher 90%
Photon index: -1.68405     ( -0.577555   0.540071 )
Norm@50keV  : 2.34740E-03    ( -0.000920863   0.000901579 )
------------------------------------------------------------
#Fit statistic : Chi-Squared =          53.05 using 59 PHA bins.
# Reduced chi-squared =         0.9307 for     57 degrees of freedom
# Null hypothesis probability =   6.240239e-01

Photon flux (15-150 keV)    in 1 sec: 0.310040 ( -0.107982  0.108026 ) ph/cm2/s
Energy fluence (15-150 keV)             : 2.17826e-08 ( -8.58728e-09  9.1531e-09 ) ergs/cm2
Cutoff power-law model
Time interval is from    0.716 sec. to    1.716 sec.
Spectral model in the cutoff power-law:
------------------------------------------------------------
Parameters  : value       lower 90%   higher 90%
Photon index: 6.81498     ( -7.71027   -6.83307 )
Epeak [keV] : 33.4660      ( -5.42546 27.1885 )
Norm@50keV  : 937.875    ( -1007.16   174704 )
------------------------------------------------------------
#Fit statistic : Chi-Squared =          48.69 using 59 PHA bins.
# Reduced chi-squared =         0.8695 for     56 degrees of freedom
# Null hypothesis probability =   7.450862e-01

Photon flux (15-150 keV)    in 1 sec: 0.273793 ( -0.093675  0.102715 ) ph/cm2/s
Energy fluence (15-150 keV)             : 1.34524e-08 ( -4.7632e-09  9.25461e-09 ) ergs/cm2
Time-resolved spectra
Distribution
T90 vs. Hardness ratio plot
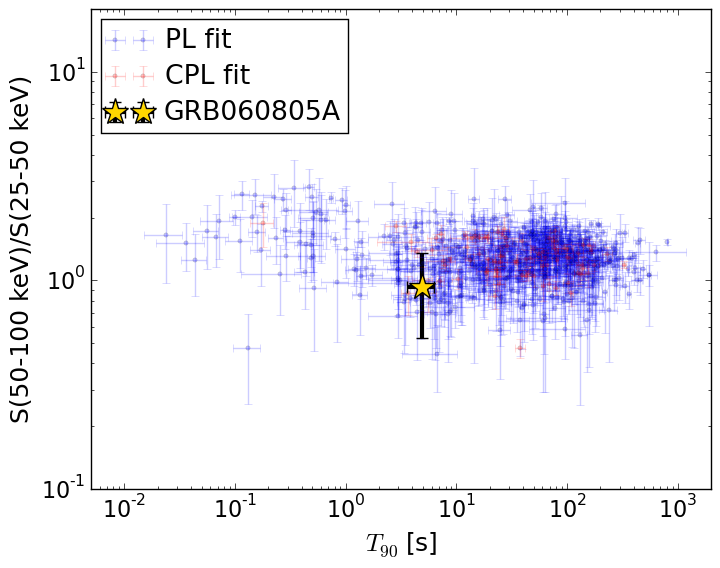
T90                                   = 4.928 sec.
Hardness ratio (energy fluence ratio) = 0.92939435545
S(15-50 keV) vs. S(50-150 keV) plot
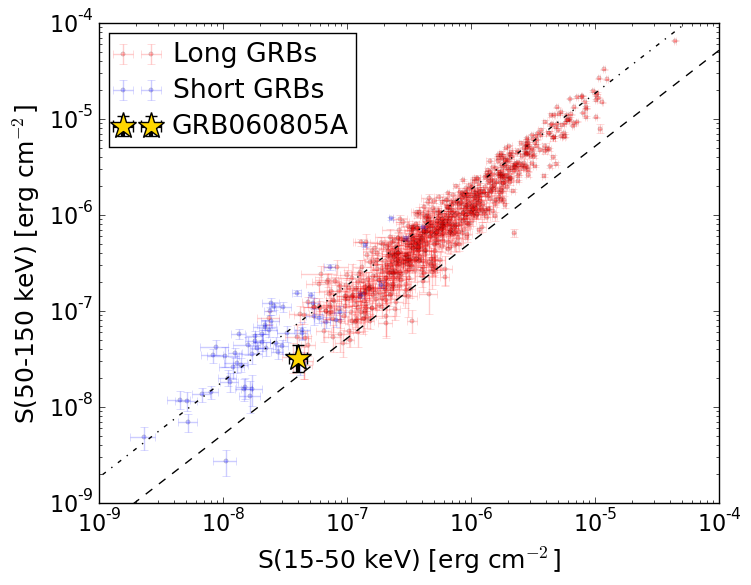
S(15-50 keV)  = 4.045475e-08
S(50-150 keV) = 3.268093e-08
The dash-dotted line and the dashed line traces the fluences calculated from the Band function with Epeak = 15 and 150 keV, respectively. Both lines assume a canonical values of alpha = -1 and beta = -2.5.
Mask shadow pattern
IMX = -0.0391541225918, IMY = -0.149408628234
Spacecraft aspect plot
Bright source in the pre-burst/pre-slew/post-slew images
Pre-burst image of 15-350 keV band
Time interval of the image:
-239.528000 -1.224000

# RAcent  DECcent POSerr Theta    Phi  PeakCts   SNR AngSep     Name
#  [deg]    [deg]    ['] [deg]  [deg]                   [']
254.5031  35.3755   15.7  41.1   40.9   0.2586   0.7    3.0	Her X-1
241.8999  -4.4646    2.5  35.7  110.1   1.7231   4.6 ------	UNKNOWN
201.1323 -33.2564    3.7  51.5  178.5   1.3145   3.2 ------	UNKNOWN
Pre-slew background subtracted image of 15-350 keV band
Time interval of the image:
-1.224000 4.520000

# RAcent  DECcent POSerr Theta    Phi  PeakCts   SNR AngSep     Name
#  [deg]    [deg]    ['] [deg]  [deg]                   [']
254.4753  35.5100    5.6  41.1   40.7   0.1005   2.1   10.1	Her X-1
226.2703  16.6107    1.8  12.7   75.5   0.1340   6.3 ------	UNKNOWN
220.9346  12.5770    1.7   8.8  104.7   0.1418   6.8 ------	UNKNOWN
201.3654 -23.6877    2.6  42.2 -178.3   0.1387   4.4 ------	UNKNOWN
Post-slew image of 15-350 keV band
Time interval of the image:
77.372600 934.972600

# RAcent  DECcent POSerr Theta    Phi  PeakCts   SNR AngSep     Name
#  [deg]    [deg]    ['] [deg]  [deg]                   [']
244.9729 -15.6500    0.4  37.0  123.4  32.2905  28.2    0.7	Sco X-1
254.3612  35.2527   46.7  37.7   31.6   0.1956   0.2    7.2	Her X-1
207.3283 -40.0910    3.0  54.2  177.0   6.7998   3.8 ------	UNKNOWN