Analysis Summary
Notes:
- 1) No attempt has been made to eliminate the non-significant decimal places.
- 2) This batgrbproduct analysis is done using the HEASARC data.
- 3) This batgrbproduct analysis is using the flight position for the mask-weighting calculation.
======================================================================
BAT GRB EVENT DATA PROCESSING REPORT
Process Script Ver: batgrbproduct v2.46
Process Start Time: Wed Jan 22 14:29:02 EST 2014
Host Name: batevent1
Current Working Dir: /local/data/batevent/batevent_reproc/trigger223217
======================================================================
Trigger: 00223217 Segment: 000
BAT Trigger Time: 176654496.768 [s; MET]
Trigger Stop: 176654500.864 [s; MET]
UTC: 2006-08-07T14:41:35.402420 [includes UTCF correction]
Where From?: TDRSS position message
BAT
RA: 252.527449283141 Dec: 31.5902332978161 [deg; J2000]
Catalogged Source?: NO
Point Source?: YES
GRB Indicated?: YES [ by BAT flight software ]
Image S/N Ratio: 11.05
Image Trigger?: NO
Rate S/N Ratio: 20.3715487874634 [ if not an image trigger ]
Image S/N Ratio: 11.05
Analysis Position: [ source = BAT ]
RA: 252.527449283141 Dec: 31.5902332978161 [deg; J2000]
Refined Position: [ source = BAT pre-slew burst ]
RA: 252.530714438917 Dec: 31.593016324021 [deg; J2000]
{ 16h 50m 07.4s , +31d 35' 34.9" }
+/- 1.86628400334677 [arcmin] (estimated 90% radius based on SNR)
+/- 0.662150663465845 [arcmin] (formal 1-sigma fit error)
SNR: 12.4740457352614
Angular difference between the analysis and refined position is 0.236073 arcmin
Partial Coding Fraction: 0.671875 [ including projection effects ]
Duration
T90: 54.0480000078678 +/- 11.6891501764668
Measured from: -32.8160000145435
to: 21.2319999933243 [s; relative to TRIGTIME]
T50: 17.4040000140667 +/- 6.69454853448861
Measured from: -10.7280000150204
to: 6.67599999904633 [s; relative to TRIGTIME]
Fluence
Peak Flux (peak 1 second)
Measured from: -0.140000015497208
to: 0.859999984502792 [s; relative to TRIGTIME]
Total Fluence
Measured from: -40.772000014782
to: 25.7599999904633 [s; relative to TRIGTIME]
Band 1 Band 2 Band 3 Band 4
15-25 25-50 50-100 100-350 keV
Total 0.340569 0.574275 0.365382 0.118061
0.050226 0.052071 0.046409 0.044820 [error]
Peak 0.021701 0.033885 0.035776 0.007759
0.006424 0.006796 0.006288 0.005707 [error]
[ fluence units of on-axis counts / fully illuminated detector ]
======================================================================
====== Table of the duration information =============================
Value tstart tstop
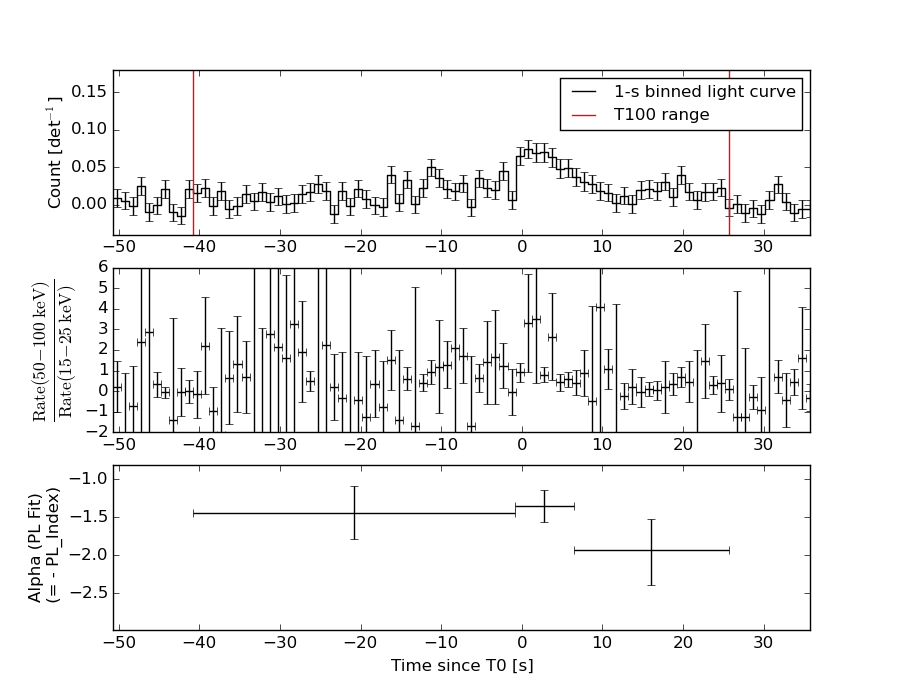
T100 66.532 -40.772 25.760
T90 54.048 -32.816 21.232
T50 17.404 -10.728 6.676
Peak 1.000 -0.140 0.860
====== Spectral Analysis Summary =====================================
Model : spectral model: simple power-law (PL) and cutoff power-law (CPL)
Ph_index : photon index: E^{Ph_index}
Ph_90err : 90% error of the photon index
Epeak : Epeak in keV
Epeak_90err: 90% error of Epeak
Norm : normalization at 50 keV in both the PL model and CPL model
Nomr_90err : 90% error of the normalization
chi2 : Chi-Squared
dof : degree of freedo
=== Time-averaged spectral analysis ===
(Best model with acceptable fit: PL)
Model Ph_index Ph_90err_low Ph_90err_hi Epeak Epeak_90err_low Epeak_90err_hi Norm Nomr_90err_low Norm_90err_hi chi2 dof
PL -1.537 -0.200 0.198 - - - 1.38e-03 -1.59e-04 1.57e-04 58.540 57
CPL -1.402 -0.330 0.885 208.661 -208.661 -208.661 1.62e-03 -7.35e-04 3.08e-03 58.460 56
=== 1-s peak spectral analysis ===
(Best model with acceptable fit: PL)
Model Ph_index Ph_90err_low Ph_90err_hi Epeak Epeak_90err_low Epeak_90err_hi Norm Nomr_90err_low Norm_90err_hi chi2 dof
PL -1.161 -0.332 0.342 - - - 7.06e-03 -1.33e-03 1.33e-03 36.110 57
CPL -0.534 -0.924 2.155 129.114 -129.114 -129.114 1.37e-02 -7.80e-03 1.07e-01 35.610 56
=== Fluence/Peak Flux Summary ===
Model Band1 Band2 Band3 Band4 Band5 Total
15-25 25-50 50-100 100-350 15-150 15-350 keV
Fluence PL 1.21e-07 2.17e-07 3.00e-07 8.59e-07 8.64e-07 1.50e-06 erg/cm2
90%_error_low -2.18e-08 -2.46e-08 -4.61e-08 -2.51e-07 -1.09e-07 -2.93e-07 erg/cm2
90%_error_hi 2.28e-08 2.44e-08 4.59e-08 3.16e-07 1.11e-07 3.47e-07 erg/cm2
Peak flux PL 2.10e-01 2.59e-01 2.31e-01 3.58e-01 8.24e-01 1.06e+00 ph/cm2/s
90%_error_low -7.33e-02 -5.94e-02 -5.04e-02 -1.42e-01 -1.60e-01 -2.10e-01 ph/cm2/s
90%_error_hi 8.30e-02 5.78e-02 4.95e-02 1.93e-01 1.61e-01 2.18e-01 ph/cm2/s
Fluence CPL 1.19e-07 2.21e-07 3.01e-07 6.86e-07 8.53e-07 1.33e-06 erg/cm2
90%_error_low -2.53e-08 -2.71e-08 -4.70e-08 -4.82e-07 -1.30e-07 -5.13e-07 erg/cm2
90%_error_hi 2.29e-08 3.22e-08 4.80e-08 2.31e-07 1.19e-07 2.66e-07 erg/cm2
Peak flux CPL 1.80e-01 2.68e-01 2.47e-01 1.97e-01 8.00e-01 8.92e-01 ph/cm2/s
90%_error_low -1.80e-01 -6.49e-02 -6.07e-02 -1.97e-01 -1.75e-01 -2.47e-01 ph/cm2/s
90%_error_hi 1.04e-01 6.78e-02 6.43e-02 2.11e-01 1.71e-01 2.77e-01 ph/cm2/s
======================================================================
Image
Pre-slew 15.0-350.0 keV image (Event data)

#   RAcent    DECcent   POSerr    Theta     Phi              Peak Cts       SNR   Name
  252.5307    31.5930   0.0154    29.8132   160.1590         1.3961792     12.474 TRIG_00223217

Foreground time interval of the image:
-40.772  25.760 (delta_t =  66.532 [sec])
Background time interval of the image:
-239.768 -40.772 (delta_t = 198.996 [sec])
Light Curves
Note: The mask-weighted lightcurves have units of either count/det or counts/sec/det, where a det is 0.4 x 0.4 = 0.16 sq cm.
Full-time range; 1 s binning
Other quick-look light curves:
- 64 ms binning (zoomed)
- 16 ms binning (zoomed)
- 8 ms binning (zoomed)
- 2 ms binning (zoomed)
- SN=5 or 10 s binning (full-time range)
- Raw light curve
Spectra
- 64 ms binning (zoomed)
- 16 ms binning (zoomed)
- 8 ms binning (zoomed)
- 2 ms binning (zoomed)
- SN=5 or 10 s binning (full-time range)
- Raw light curve
Spectra
Notes:
- 1) The fitting includes the systematic errors.
- 2) When the burst includes telescope slew time periods, the fitting uses an average response file made from multiple 5-s response files through out the slew time plus single time preiod for the non-slew times, and weighted by the total counts in the corresponding time period using addrmf. An average response file is needed becuase a spectral fit using the pre-slew DRM will introduce some errors in both a spectral shape and a normalization if the PHA file contains a lot of the slew/post-slew time interval.
- 3) For fits to more complicated models (e.g. a power-law over a cutoff power-law), the BAT team has decided to require a chi-square improvement of more than 6 for each extra dof.
Time averaged spectrum fit using the average DRM
Power-law model

Time interval is from  -40.772 sec. to   25.760 sec.

Spectral model in power-law:
------------------------------------------------------------
Parameters  : value       lower 90%   higher 90%
Photon index: -1.53657     ( -0.200001   0.197573 )
Norm@50keV  : 1.37622E-03    ( -0.000158872   0.000157221 )
------------------------------------------------------------
#Fit statistic : Chi-Squared =          58.54 using 59 PHA bins.
# Reduced chi-squared =          1.027 for     57 degrees of freedom
# Null hypothesis probability =   4.187175e-01

Photon flux (15-150 keV)    in 66.53 sec: 0.173557 ( -0.019191  0.019223 ) ph/cm2/s
Energy fluence (15-150 keV)             : 8.63746e-07 ( -1.08866e-07  1.1052e-07 ) ergs/cm2
Cutoff power-law model
Time interval is from  -40.772 sec. to   25.760 sec.
Spectral model in the cutoff power-law:
------------------------------------------------------------
Parameters  : value       lower 90%   higher 90%
Photon index: -1.40247     ( -0.325233   0.88962 )
Epeak [keV] : 208.661      ( -219.92 -219.92 )
Norm@50keV  : 1.62071E-03    ( -0.000721013   0.00309857 )
------------------------------------------------------------
#Fit statistic : Chi-Squared =          58.46 using 59 PHA bins.
# Reduced chi-squared =          1.044 for     56 degrees of freedom
# Null hypothesis probability =   3.850530e-01

Photon flux (15-150 keV)    in 66.53 sec: 0.172521 ( -0.020261  0.019959 ) ph/cm2/s
Energy fluence (15-150 keV)             : 8.52602e-07 ( -1.29886e-07  1.19222e-07 ) ergs/cm2
1-s peak spectrum fit
Power-law model
Time interval is from   -0.140 sec. to    0.860 sec.

Spectral model in power-law:
------------------------------------------------------------
Parameters  : value       lower 90%   higher 90%
Photon index: -1.16059     ( -0.331962   0.341981 )
Norm@50keV  : 7.05673E-03    ( -0.00133362   0.00133155 )
------------------------------------------------------------
#Fit statistic : Chi-Squared =          36.11 using 59 PHA bins.
# Reduced chi-squared =         0.6334 for     57 degrees of freedom
# Null hypothesis probability =   9.861228e-01

Photon flux (15-150 keV)    in 1 sec: 0.824021 ( -0.160142  0.160831 ) ph/cm2/s
Energy fluence (15-150 keV)             : 7.24219e-08 ( -1.50169e-08  1.52096e-08 ) ergs/cm2
Cutoff power-law model
Time interval is from   -0.140 sec. to    0.860 sec.
Spectral model in the cutoff power-law:
------------------------------------------------------------
Parameters  : value       lower 90%   higher 90%
Photon index: -0.533757     ( -0.924486   2.15453 )
Epeak [keV] : 129.114      ( -128.985 -128.985 )
Norm@50keV  : 1.37040E-02    ( -0.00781253   0.106636 )
------------------------------------------------------------
#Fit statistic : Chi-Squared =          35.61 using 59 PHA bins.
# Reduced chi-squared =         0.6359 for     56 degrees of freedom
# Null hypothesis probability =   9.847092e-01

Photon flux (15-150 keV)    in 1 sec: 0.799702 ( -0.174835  0.17085 ) ph/cm2/s
Energy fluence (15-150 keV)             : 6.97349e-08 ( -1.68673e-08  1.64994e-08 ) ergs/cm2
Time-resolved spectra
Distribution
T90 vs. Hardness ratio plot
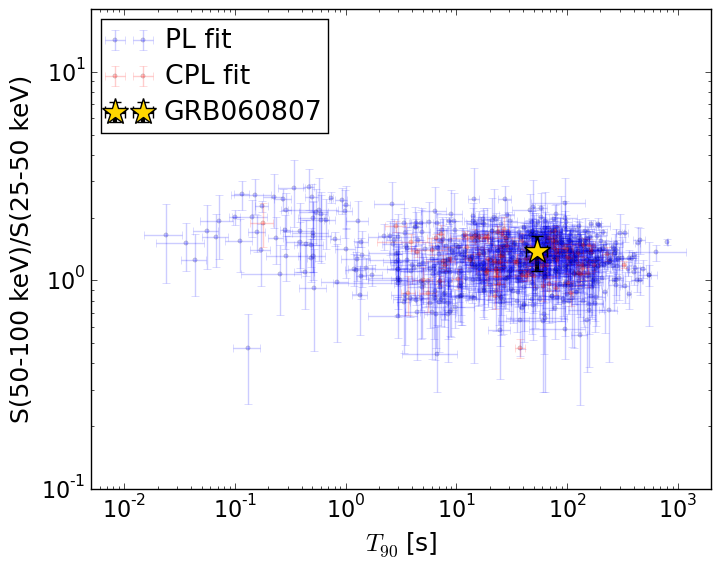
T90                                   = 54.048 sec.
Hardness ratio (energy fluence ratio) = 1.37885925333
S(15-50 keV) vs. S(50-150 keV) plot
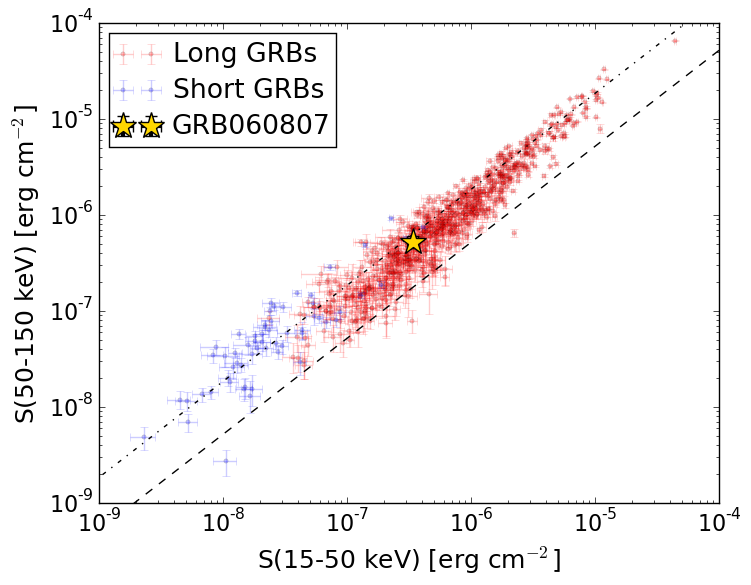
S(15-50 keV)  = 3.384141e-07
S(50-150 keV) = 5.25353e-07
The dash-dotted line and the dashed line traces the fluences calculated from the Band function with Epeak = 15 and 150 keV, respectively. Both lines assume a canonical values of alpha = -1 and beta = -2.5.
Mask shadow pattern
IMX = -5.389973028856305E-01, IMY = -1.944870707172092E-01
Spacecraft aspect plot
Bright source in the pre-burst/pre-slew/post-slew images
Pre-burst image of 15-350 keV band
Time interval of the image:
-239.768000 -40.772000

# RAcent  DECcent POSerr Theta    Phi  PeakCts   SNR AngSep     Name
#  [deg]    [deg]    ['] [deg]  [deg]                   [']
254.3678  35.3088    4.6  25.8  160.1   0.5107   2.5    4.8	Her X-1
299.5944  35.2071    0.4  29.1   74.5   7.7860  28.0    0.4	Cyg X-1
308.0500  40.9792    2.9  28.2   56.1   0.9674   3.9    3.2	Cyg X-3
326.0224  38.4147    6.2  39.3   40.5   0.7142   1.9    9.0	Cyg X-2
308.0634  37.6373    0.5  30.8   60.4   7.2458  24.9 ------	UNKNOWN
Pre-slew background subtracted image of 15-350 keV band
Time interval of the image:
-40.772000 25.760000

# RAcent  DECcent POSerr Theta    Phi  PeakCts   SNR AngSep     Name
#  [deg]    [deg]    ['] [deg]  [deg]                   [']
254.4563  35.5381    0.0  25.6  160.1  -0.1765  -1.6   11.7	Her X-1
299.4910  35.0682    4.8  29.2   74.7  -0.3471  -2.4    9.4	Cyg X-1
308.1142  40.9913    4.1  28.2   56.0  -0.3693  -2.8    2.3	Cyg X-3
325.9695  38.2541    5.2  39.4   40.7  -0.4427  -2.2   10.3	Cyg X-2
279.2647  25.7750    2.2  32.7  113.0   0.9339   5.4 ------	UNKNOWN
318.8759  49.3957    2.0  28.1   32.0   0.6394   5.8 ------	UNKNOWN
338.1975  49.0665    2.9  38.4   18.5   0.5614   4.0 ------	UNKNOWN
252.5307  31.5930    0.9  29.8  160.2   1.3963  12.5 ------	UNKNOWN
  7.5275  75.4393    2.0  35.9  -30.3   0.6872   5.8 ------	UNKNOWN
 14.6417  78.2925    2.1  36.0  -35.9   0.6305   5.4 ------	UNKNOWN
204.1519  58.2708    2.2  34.4 -115.4   0.7547   5.2 ------	UNKNOWN
203.4386  27.6232    2.4  55.9 -147.3   2.5808   4.9 ------	UNKNOWN
Post-slew image of 15-350 keV band
Time interval of the image:
90.532600 556.594700
557.232000 962.252000

# RAcent  DECcent POSerr Theta    Phi  PeakCts   SNR AngSep     Name
#  [deg]    [deg]    ['] [deg]  [deg]                   [']
244.9862 -15.6451    0.5  47.8  162.3  36.4466  24.5    0.5	Sco X-1
254.2710  35.3272   94.1   4.0   -6.4  -0.0601  -0.1    9.2	Her X-1
268.2242  -1.4748    7.4  36.3  125.3   1.9469   1.6    8.7	SW J1753.5-0127
288.8172  10.9567    2.7  39.3   86.0   9.2598   4.3    1.3	GRS 1915+105
299.5938  35.2035    0.4  39.1   44.1  32.0165  29.6    0.2	Cyg X-1
308.0541  40.9533    2.9  45.0   34.3   5.5950   4.0    2.5	Cyg X-3
308.0814  37.6435    0.6  45.5   38.9  28.3522  17.7 ------	UNKNOWN
268.6084  25.7615    2.6  15.3   81.0   2.1580   4.4 ------	UNKNOWN
265.2415  52.4874    3.1  22.8   -7.3   1.7203   3.7 ------	UNKNOWN