Analysis Summary
Notes:
- 1) No attempt has been made to eliminate the non-significant decimal places.
- 2) This batgrbproduct analysis is done using the HEASARC data.
- 3) This batgrbproduct analysis is using the flight position for the mask-weighting calculation.
======================================================================
BAT GRB EVENT DATA PROCESSING REPORT
Process Script Ver: batgrbproduct v2.46
Process Start Time: Wed Jan 22 14:22:15 EST 2014
Host Name: batevent1
Current Working Dir: /local/data/batevent/batevent_reproc/trigger224364
======================================================================
Trigger: 00224364 Segment: 000
BAT Trigger Time: 177202224.064 [s; MET]
Trigger Stop: 177202224.32 [s; MET]
UTC: 2006-08-13T22:50:22.685460 [includes UTCF correction]
Where From?: TDRSS position message
BAT
RA: 111.867644154714 Dec: -29.8505718934776 [deg; J2000]
Catalogged Source?: NO
Point Source?: YES
GRB Indicated?: YES [ by BAT flight software ]
Image S/N Ratio: 7.17
Image Trigger?: NO
Rate S/N Ratio: 11.13552872566 [ if not an image trigger ]
Image S/N Ratio: 7.17
Analysis Position: [ source = BAT ]
RA: 111.867644154714 Dec: -29.8505718934776 [deg; J2000]
Refined Position: [ source = BAT pre-slew burst ]
RA: 111.895420587626 Dec: -29.8447083777529 [deg; J2000]
{ 07h 27m 34.9s , -29d 50' 41.0" }
+/- 0.592780743820795 [arcmin] (estimated 90% radius based on SNR)
+/- 0.17084124495797 [arcmin] (formal 1-sigma fit error)
SNR: 64.2030112804418
Angular difference between the analysis and refined position is 1.487713 arcmin
Partial Coding Fraction: 0.3945312 [ including projection effects ]
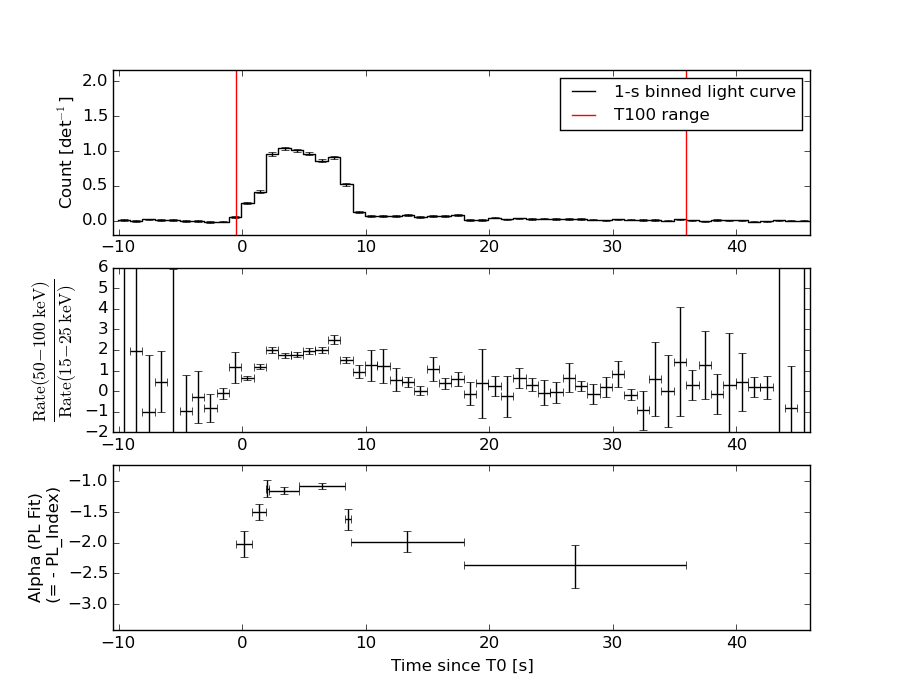
Duration
T90: 15.9679999947548 +/- 3.38792445600214
Measured from: 1.1879999935627
to: 17.1559999883175 [s; relative to TRIGTIME]
T50: 4.19200000166893 +/- 0.122441838365293
Measured from: 3.23199999332428
to: 7.42399999499321 [s; relative to TRIGTIME]
Fluence
Peak Flux (peak 1 second)
Measured from: 3.59199997782707
to: 4.59199997782707 [s; relative to TRIGTIME]
Total Fluence
Measured from: -0.488000005483627
to: 35.9560000002384 [s; relative to TRIGTIME]
Band 1 Band 2 Band 3 Band 4
15-25 25-50 50-100 100-350 keV
Total 1.801536 2.878787 2.625078 0.715501
0.047417 0.052366 0.048996 0.037707 [error]
Peak 0.225097 0.355589 0.387617 0.118508
0.011392 0.013803 0.014124 0.009795 [error]
[ fluence units of on-axis counts / fully illuminated detector ]
======================================================================
====== Table of the duration information =============================
Value tstart tstop
T100 36.444 -0.488 35.956
T90 15.968 1.188 17.156
T50 4.192 3.232 7.424
Peak 1.000 3.592 4.592
====== Spectral Analysis Summary =====================================
Model : spectral model: simple power-law (PL) and cutoff power-law (CPL)
Ph_index : photon index: E^{Ph_index}
Ph_90err : 90% error of the photon index
Epeak : Epeak in keV
Epeak_90err: 90% error of Epeak
Norm : normalization at 50 keV in both the PL model and CPL model
Nomr_90err : 90% error of the normalization
chi2 : Chi-Squared
dof : degree of freedo
=== Time-averaged spectral analysis ===
(Best model with acceptable fit: CPL)
Model Ph_index Ph_90err_low Ph_90err_hi Epeak Epeak_90err_low Epeak_90err_hi Norm Nomr_90err_low Norm_90err_hi chi2 dof
PL -1.334 -0.042 0.042 - - - 1.57e-02 -3.55e-04 3.54e-04 46.260 57
CPL -1.073 -0.167 0.173 207.517 -59.536 245.679 2.04e-02 -3.05e-03 3.73e-03 39.030 56
=== 1-s peak spectral analysis ===
(Best model with acceptable fit: N/A)
Model Ph_index Ph_90err_low Ph_90err_hi Epeak Epeak_90err_low Epeak_90err_hi Norm Nomr_90err_low Norm_90err_hi chi2 dof
PL -1.123 -0.071 0.071 - - - 7.64e-02 -3.08e-03 3.07e-03 42.060 57
CPL -0.964 -0.209 0.285 378.814 -378.814 -378.814 8.99e-02 -1.72e-02 2.92e-02 41.050 56
=== Fluence/Peak Flux Summary ===
Model Band1 Band2 Band3 Band4 Band5 Total
15-25 25-50 50-100 100-350 15-150 15-350 keV
Fluence PL 6.26e-07 1.27e-06 2.02e-06 7.13e-06 5.61e-06 1.10e-05 erg/cm2
90%_error_low -2.94e-08 -3.53e-08 -5.17e-08 -4.17e-07 -1.31e-07 -4.40e-07 erg/cm2
90%_error_hi 3.00e-08 3.52e-08 5.16e-08 4.34e-07 1.31e-07 4.54e-07 erg/cm2
Peak flux PL 7.00e-04 6.98e-03 7.62e-02 8.58e+00 3.38e-01 8.61e+00 ph/cm2/s
90%_error_low N/A N/A N/A N/A N/A N/A ph/cm2/s
90%_error_hi N/A N/A N/A N/A N/A N/A ph/cm2/s
Fluence CPL 5.82e-07 1.29e-06 2.08e-06 5.20e-06 5.54e-06 9.15e-06 erg/cm2
90%_error_low -3.89e-08 -3.71e-08 -6.19e-08 -9.11e-07 -1.39e-07 -9.11e-07 erg/cm2
90%_error_hi 3.97e-08 3.73e-08 6.24e-08 1.15e-06 1.39e-07 1.14e-06 erg/cm2
Peak flux CPL 2.10e+00 2.79e+00 2.59e+00 3.48e+00 8.83e+00 1.10e+01 ph/cm2/s
90%_error_low -2.30e-01 -1.43e-01 -1.42e-01 -8.10e-01 -3.83e-01 -9.12e-01 ph/cm2/s
90%_error_hi 2.31e-01 1.44e-01 1.44e-01 7.20e-01 3.83e-01 8.79e-01 ph/cm2/s
======================================================================
Image
Pre-slew 15.0-350.0 keV image (Event data)
#   RAcent    DECcent   POSerr    Theta     Phi              Peak Cts       SNR   Name
  111.8954   -29.8447   0.0030    34.2671  -118.4470         7.3591946     64.203 TRIG_00224364

Foreground time interval of the image:
 -0.488   9.237 (delta_t =   9.725 [sec])
Background time interval of the image:
-239.064  -0.488 (delta_t = 238.576 [sec])
Light Curves
Note: The mask-weighted lightcurves have units of either count/det or counts/sec/det, where a det is 0.4 x 0.4 = 0.16 sq cm.
Full-time range; 1 s binning
Other quick-look light curves:
- 64 ms binning (zoomed)
- 16 ms binning (zoomed)
- 8 ms binning (zoomed)
- 2 ms binning (zoomed)
- SN=5 or 10 s binning (full-time range)
- Raw light curve
Spectra
- 64 ms binning (zoomed)
- 16 ms binning (zoomed)
- 8 ms binning (zoomed)
- 2 ms binning (zoomed)
- SN=5 or 10 s binning (full-time range)
- Raw light curve
Spectra
Notes:
- 1) The fitting includes the systematic errors.
- 2) When the burst includes telescope slew time periods, the fitting uses an average response file made from multiple 5-s response files through out the slew time plus single time preiod for the non-slew times, and weighted by the total counts in the corresponding time period using addrmf. An average response file is needed becuase a spectral fit using the pre-slew DRM will introduce some errors in both a spectral shape and a normalization if the PHA file contains a lot of the slew/post-slew time interval.
- 3) For fits to more complicated models (e.g. a power-law over a cutoff power-law), the BAT team has decided to require a chi-square improvement of more than 6 for each extra dof.
Time averaged spectrum fit using the average DRM
Power-law model
Time interval is from   -0.488 sec. to   35.956 sec.

Spectral model in power-law:
------------------------------------------------------------
Parameters  : value       lower 90%   higher 90%
Photon index: -1.33367     ( -0.0415473   0.0416391 )
Norm@50keV  : 1.57149E-02    ( -0.000354465   0.000354309 )
------------------------------------------------------------
#Fit statistic : Chi-Squared =          46.26 using 59 PHA bins.
# Reduced chi-squared =         0.8116 for     57 degrees of freedom
# Null hypothesis probability =   8.446379e-01

Photon flux (15-150 keV)    in 36.44 sec: 1.88697 ( -0.04722  0.04736 ) ph/cm2/s
Energy fluence (15-150 keV)             : 5.61446e-06 ( -1.30571e-07  1.30654e-07 ) ergs/cm2
Cutoff power-law model
Time interval is from   -0.488 sec. to   35.956 sec.
Spectral model in the cutoff power-law:
------------------------------------------------------------
Parameters  : value       lower 90%   higher 90%
Photon index: -1.07296     ( -0.1669   0.173274 )
Epeak [keV] : 207.517      ( -59.5362 245.679 )
Norm@50keV  : 2.03812E-02    ( -0.00305356   0.0037289 )
------------------------------------------------------------
#Fit statistic : Chi-Squared =          39.03 using 59 PHA bins.
# Reduced chi-squared =         0.6970 for     56 degrees of freedom
# Null hypothesis probability =   9.588205e-01

Photon flux (15-150 keV)    in 36.44 sec: 1.85276 ( -0.05141  0.05163 ) ph/cm2/s
Energy fluence (15-150 keV)             : 5.54201e-06 ( -1.39345e-07  1.38902e-07 ) ergs/cm2
1-s peak spectrum fit
Power-law model
Time interval is from    3.592 sec. to    4.592 sec.

Spectral model in power-law:
------------------------------------------------------------
Parameters  : value       lower 90%   higher 90%
Photon index: -1.12314     ( -0.0707937   0.0710838 )
Norm@50keV  : 7.64427E-02    ( -0.00307536   0.00307305 )
------------------------------------------------------------
#Fit statistic : Chi-Squared =          42.06 using 59 PHA bins.
# Reduced chi-squared =         0.7379 for     57 degrees of freedom
# Null hypothesis probability =   9.306539e-01

Photon flux (15-150 keV)    in 1 sec: 0.338185 (    ) ph/cm2/s
Energy fluence (15-150 keV)             : 7.93506e-07 ( -3.47188e-08  3.48175e-08 ) ergs/cm2
Cutoff power-law model
Time interval is from    3.592 sec. to    4.592 sec.
Spectral model in the cutoff power-law:
------------------------------------------------------------
Parameters  : value       lower 90%   higher 90%
Photon index: -0.963891     ( -0.208867   0.284603 )
Epeak [keV] : 378.814      ( -378.814 -378.814 )
Norm@50keV  : 8.99115E-02    ( -0.0171548   0.0291723 )
------------------------------------------------------------
#Fit statistic : Chi-Squared =          41.05 using 59 PHA bins.
# Reduced chi-squared =         0.7330 for     56 degrees of freedom
# Null hypothesis probability =   9.329168e-01

Photon flux (15-150 keV)    in 1 sec: 8.82780 ( -0.3829  0.3828 ) ph/cm2/s
Energy fluence (15-150 keV)             : 7.88824e-07 ( -3.59193e-08  3.58077e-08 ) ergs/cm2
Time-resolved spectra
Distribution
T90 vs. Hardness ratio plot
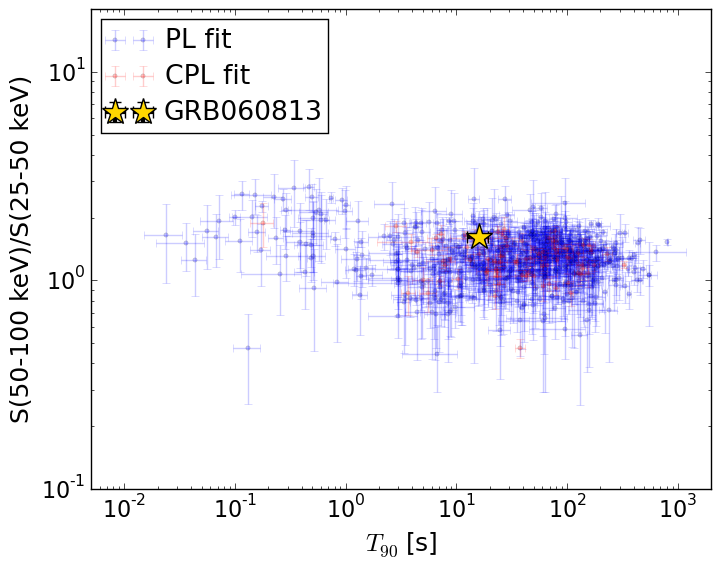
T90                                   = 15.968 sec.
Hardness ratio (energy fluence ratio) = 1.61135036496
S(15-50 keV) vs. S(50-150 keV) plot
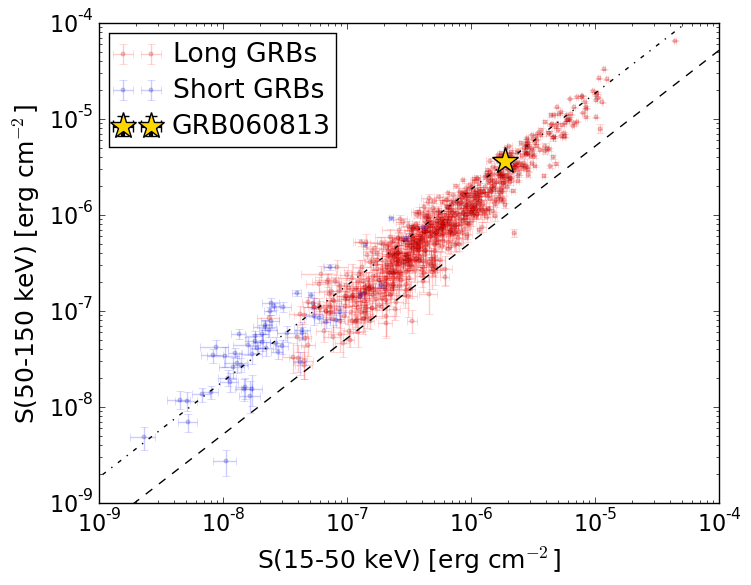
S(15-50 keV)  = 1.8701422e-06
S(50-150 keV) = 3.671889e-06
The dash-dotted line and the dashed line traces the fluences calculated from the Band function with Epeak = 15 and 150 keV, respectively. Both lines assume a canonical values of alpha = -1 and beta = -2.5.
Mask shadow pattern
IMX = -3.245400832142962E-01, IMY = 5.990500984735029E-01
Spacecraft aspect plot
Bright source in the pre-burst/pre-slew/post-slew images
Pre-burst image of 15-350 keV band
Time interval of the image:
-239.064000 -0.488000

# RAcent  DECcent POSerr Theta    Phi  PeakCts   SNR AngSep     Name
#  [deg]    [deg]    ['] [deg]  [deg]                   [']
135.6911 -40.4968   16.9  32.4  -77.8   0.1760   0.7    8.2	Vela X-1
170.5204 -60.4755    6.0  33.9  -23.0   0.3478   1.9   10.7	Cen X-3
186.6602 -62.7623    1.0  38.4  -11.8   2.4793  11.8    0.5	GX 301-2
 55.8746 -28.2749    2.5  42.7  159.9   1.5427   4.7 ------	UNKNOWN
218.5468 -66.6956    2.4  44.5    7.4   1.2899   4.8 ------	UNKNOWN
188.6361 -67.8765    3.2  35.8   -4.4   0.7051   3.6 ------	UNKNOWN
107.2018 -63.3447    2.9   5.5  -39.1   0.6282   4.1 ------	UNKNOWN
198.2402 -45.2448    2.9  56.2  -20.1   2.2596   4.0 ------	UNKNOWN
Pre-slew background subtracted image of 15-350 keV band
Time interval of the image:
-0.488000 9.236590

# RAcent  DECcent POSerr Theta    Phi  PeakCts   SNR AngSep     Name
#  [deg]    [deg]    ['] [deg]  [deg]                   [']
135.4414 -40.3625    0.0  32.4  -78.2   0.1978   1.7   12.2	Vela X-1
169.9773 -60.5799    7.7  33.7  -23.1   0.0998   1.5   10.3	Cen X-3
186.3610 -62.7052    6.1  38.4  -12.0  -0.1496  -1.9    9.0	GX 301-2
 69.8529  -9.5089    2.6  56.0 -175.2   0.8722   4.4 ------	UNKNOWN
111.8954 -29.8447    0.2  34.3 -118.4   7.3585  64.2 ------	UNKNOWN
Post-slew image of 15-350 keV band
Time interval of the image:
62.836600 669.636600

# RAcent  DECcent POSerr Theta    Phi  PeakCts   SNR AngSep     Name
#  [deg]    [deg]    ['] [deg]  [deg]                   [']
 83.6384  22.0279    1.3  58.6 -159.8  20.2927   9.2    0.9	Crab
135.5433 -40.5757   12.5  22.0   -3.4  -0.2719  -0.9    1.4	Vela X-1
170.3795 -60.5792    7.5  49.0   17.4  -1.2068  -1.5    3.2	Cen X-3
 59.8615 -11.8600    2.9  51.3  150.1   5.7949   4.0 ------	UNKNOWN