Analysis Summary
Notes:
- 1) No attempt has been made to eliminate the non-significant decimal places.
- 2) This batgrbproduct analysis is done using the HEASARC data.
- 3) This batgrbproduct analysis is using the flight position for the mask-weighting calculation.
======================================================================
                  BAT GRB EVENT DATA PROCESSING REPORT
    Process Script Ver: batgrbproduct v2.46
    Process Start Time: Wed Jan 22 14:16:03 EST 2014
             Host Name: batevent1
   Current Working Dir: /local/data/batevent/batevent_reproc/trigger224552
======================================================================

  Trigger: 00224552      Segment: 000

  BAT Trigger Time: 177289340.416   [s; MET]
      Trigger Stop: 177289341.44   [s; MET]
               UTC: 2006-08-14T23:02:19.035400    [includes UTCF correction]
       Where From?: TDRSS position message

  BAT
    RA: 221.347997937736   Dec: 20.5828671043413  [deg; J2000]

     Catalogged Source?: NO
     Point Source?:      YES
     GRB Indicated?:     YES    [ by BAT flight software ]
     Image S/N Ratio:    15.61
     Image Trigger?:     NO
     Rate S/N Ratio:     32.5883414736007  [ if not an image trigger ]
     Image S/N Ratio:    15.61

  Analysis Position:   [ source = BAT ]
    RA: 221.347997937736   Dec: 20.5828671043413  [deg; J2000]

  Refined Position:   [ source = BAT pre-slew burst ]
    RA: 221.340465227881   Dec: 20.5870452383846  [deg; J2000]
        { 14h 45m 21.7s , +20d 35' 13.4" }
         +/- 0.744990137735512 [arcmin] (estimated 90% radius based on SNR)
         +/- 0.183189055929691 [arcmin] (formal 1-sigma fit error)
    SNR: 46.3191402012991

  Angular difference between the analysis and refined position is 0.491796 arcmin

  Partial Coding Fraction: 0.6484375    [ including projection effects ]

  Duration
     T90: 145.071999996901 +/- 4.81903061513483
        Measured from: 0.983999997377396
                   to: 146.055999994278     [s; relative to TRIGTIME]
     T50: 61.660000026226 +/- 0.676272118505318
        Measured from: 14.7239999771118
                   to: 76.3840000033379     [s; relative to TRIGTIME]


  Fluence
     Peak Flux  (peak 1 second)
        Measured from: 15.4039999842644
                   to: 16.4039999842644     [s; relative to TRIGTIME]
     Total Fluence
        Measured from: -11.688000023365
                   to: 218.324000000954     [s; relative to TRIGTIME]

             Band 1     Band 2     Band 3     Band 4
              15-25      25-50     50-100    100-350     keV
 Total     6.545102   8.852082   6.834466   1.654746
           0.081918   0.084270   0.075092   0.061452 [error]
 Peak      0.212863   0.306908   0.286852   0.087124
           0.008694   0.010318   0.010002   0.007504 [error]

     [ fluence units of on-axis counts / fully illuminated detector ]

======================================================================


====== Table of the duration information =============================

        Value   tstart    tstop
T100  230.012  -11.688  218.324
T90   145.072    0.984  146.056
T50    61.660   14.724   76.384
Peak    1.000   15.404   16.404


====== Spectral Analysis Summary =====================================

Model      : spectral model: simple power-law (PL) and cutoff power-law (CPL)
Ph_index   : photon index: E^{Ph_index}
Ph_90err   : 90% error of the photon index
Epeak      : Epeak in keV
Epeak_90err: 90% error of Epeak
Norm       : normalization at 50 keV in both the PL model and CPL model
Nomr_90err : 90% error of the normalization
chi2       : Chi-Squared
dof        : degree of freedo

=== Time-averaged spectral analysis ===
(Best model with acceptable fit: PL)

Model Ph_index Ph_90err_low Ph_90err_hi  Epeak  Epeak_90err_low  Epeak_90err_hi  Norm       Nomr_90err_low    Norm_90err_hi    chi2    dof
PL      -1.528    -0.031      0.031       -           -               -         6.80e-03     -1.09e-04          1.08e-04      43.510   57
CPL     -1.412    -0.103      0.128      302.366    -127.176      -302.366      7.61e-03     -6.93e-04          9.82e-04      41.060   56


=== 1-s peak spectral analysis ===
(Best model with acceptable fit: PL)

Model Ph_index Ph_90err_low Ph_90err_hi  Epeak  Epeak_90err_low  Epeak_90err_hi  Norm       Nomr_90err_low    Norm_90err_hi    chi2    dof
PL      -1.301     -0.066     0.066       -           -               -         6.13e-02     -2.24e-03          2.24e-03      43.600   57
CPL     -1.075     -0.246     0.267      225.672     -92.873      -225.672      7.80e-02     -1.72e-02          2.48e-02      41.250   56


=== Fluence/Peak Flux Summary ===

              Model    Band1     Band2     Band3     Band4     Band5     Total
                       15-25     25-50    50-100    100-350    15-150    15-350    keV
Fluence         PL   2.05e-06  3.70e-06  5.14e-06  1.49e-05  1.48e-05  2.58e-05   erg/cm2
      90%_error_low -7.24e-08 -7.56e-08 -9.18e-08 -6.29e-07 -2.33e-07 -6.54e-07   erg/cm2
      90%_error_hi   7.36e-08  7.55e-08  9.16e-08  6.48e-07  2.34e-07  6.69e-07   erg/cm2
Peak flux       PL   2.08e+00  2.36e+00  1.92e+00  2.60e+00  7.31e+00  8.96e+00   ph/cm2/s
      90%_error_low -1.47e-01 -1.01e-01 -8.34e-02 -2.35e-01 -2.78e-01 -3.38e-01   ph/cm2/s
      90%_error_hi   1.51e-01  1.01e-01  8.30e-02  2.49e-01  2.78e-01  3.39e-01   ph/cm2/s

Fluence        CPL   1.98e-06  3.71e-06  5.20e-06  1.30e-05  1.47e-05  2.39e-05   erg/cm2
      90%_error_low -1.02e-07 -7.69e-08 -1.09e-07 -1.75e-06 -2.58e-07 -1.77e-06   erg/cm2
      90%_error_hi   1.04e-07  7.69e-08  1.10e-07  2.04e-06  2.58e-07  2.06e-06   erg/cm2
Peak flux      CPL   1.97e+00  2.39e+00  1.96e+00  2.05e+00  7.23e+00  8.38e+00   ph/cm2/s
      90%_error_low -1.87e-01 -1.08e-01 -9.82e-02 -4.67e-01 -2.93e-01 -5.71e-01   ph/cm2/s
      90%_error_hi   1.91e-01  1.09e-01  9.93e-02  3.95e-01  2.93e-01  7.01e-01   ph/cm2/s

======================================================================
Image
Pre-slew 15.0-350.0 keV image (Event data)
#   RAcent    DECcent   POSerr    Theta     Phi              Peak Cts       SNR   Name
  221.3405    20.5870   0.0041    28.1420    28.4750         4.9250510     46.319 TRIG_00224552

Foreground time interval of the image:
-11.688  11.885 (delta_t =  23.573 [sec])
Background time interval of the image:
-26.315 -11.688 (delta_t =  14.627 [sec])
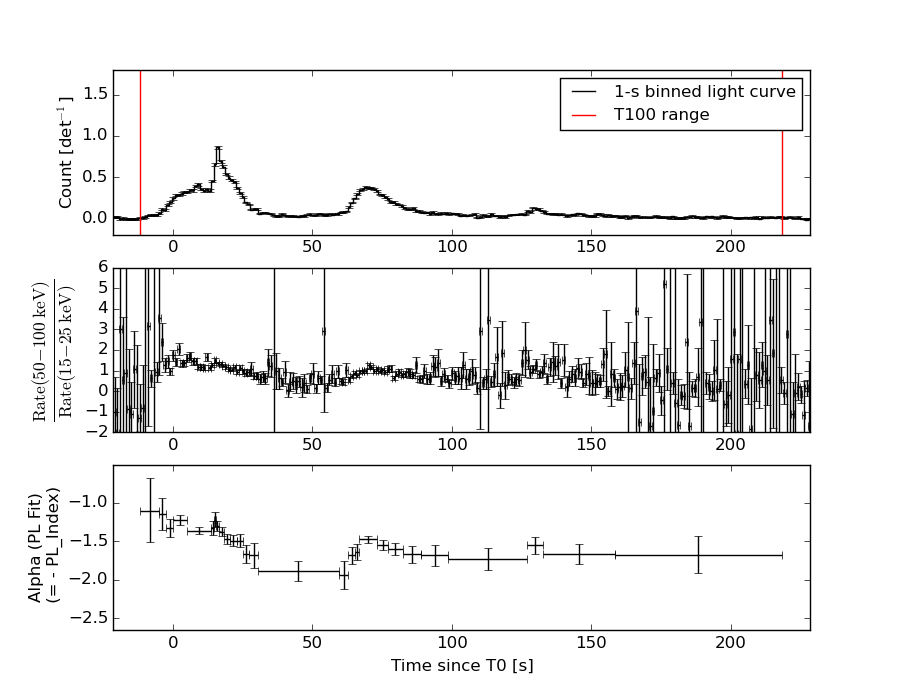
Light Curves
Note: The mask-weighted lightcurves have units of either count/det or counts/sec/det, where a det is 0.4 x 0.4 = 0.16 sq cm.
Full-time range; 1 s binning
Other quick-look light curves:
- 64 ms binning (zoomed)
- 16 ms binning (zoomed)
- 8 ms binning (zoomed)
- 2 ms binning (zoomed)
- SN=5 or 10 s binning (full-time range)
- Raw light curve
Spectra
- 64 ms binning (zoomed)
- 16 ms binning (zoomed)
- 8 ms binning (zoomed)
- 2 ms binning (zoomed)
- SN=5 or 10 s binning (full-time range)
- Raw light curve
Spectra
Notes:
- 1) The fitting includes the systematic errors.
- 2) When the burst includes telescope slew time periods, the fitting uses an average response file made from multiple 5-s response files through out the slew time plus single time preiod for the non-slew times, and weighted by the total counts in the corresponding time period using addrmf. An average response file is needed becuase a spectral fit using the pre-slew DRM will introduce some errors in both a spectral shape and a normalization if the PHA file contains a lot of the slew/post-slew time interval.
- 3) For fits to more complicated models (e.g. a power-law over a cutoff power-law), the BAT team has decided to require a chi-square improvement of more than 6 for each extra dof.
Time averaged spectrum fit using the average DRM
Power-law model
Time interval is from  -11.688 sec. to  218.324 sec.

Spectral model in power-law:
------------------------------------------------------------
Parameters  : value       lower 90%   higher 90%
Photon index: -1.52756     ( -0.031012   0.0310533 )
Norm@50keV  : 6.80189E-03    ( -0.000108565   0.000108476 )
------------------------------------------------------------
#Fit statistic : Chi-Squared =          43.51 using 59 PHA bins.
# Reduced chi-squared =         0.7633 for     57 degrees of freedom
# Null hypothesis probability =   9.058697e-01

Photon flux (15-150 keV)    in 230 sec: 0.855615 ( -0.016639  0.016713 ) ph/cm2/s
Energy fluence (15-150 keV)             : 1.47784e-05 ( -2.33282e-07  2.33556e-07 ) ergs/cm2
Cutoff power-law model
Time interval is from  -11.688 sec. to  218.324 sec.
Spectral model in the cutoff power-law:
------------------------------------------------------------
Parameters  : value       lower 90%   higher 90%
Photon index: -1.41241     ( -0.102958   0.128235 )
Epeak [keV] : 302.366      ( -127.182 -302.372 )
Norm@50keV  : 7.60567E-03    ( -0.000692866   0.000982162 )
------------------------------------------------------------
#Fit statistic : Chi-Squared =          41.06 using 59 PHA bins.
# Reduced chi-squared =         0.7332 for     56 degrees of freedom
# Null hypothesis probability =   9.327810e-01

Photon flux (15-150 keV)    in 230 sec: 0.845852 ( -0.019419  0.019568 ) ph/cm2/s
Energy fluence (15-150 keV)             : 1.4676e-05 ( -2.57908e-07  2.57713e-07 ) ergs/cm2
1-s peak spectrum fit
Power-law model
Time interval is from   15.404 sec. to   16.404 sec.

Spectral model in power-law:
------------------------------------------------------------
Parameters  : value       lower 90%   higher 90%
Photon index: -1.30068     ( -0.0658576   0.0658209 )
Norm@50keV  : 6.12833E-02    ( -0.00223843   0.0022382 )
------------------------------------------------------------
#Fit statistic : Chi-Squared =          43.60 using 59 PHA bins.
# Reduced chi-squared =         0.7649 for     57 degrees of freedom
# Null hypothesis probability =   9.042385e-01

Photon flux (15-150 keV)    in 1 sec: 7.31225 ( -0.27788  0.27821 ) ph/cm2/s
Energy fluence (15-150 keV)             : 6.05564e-07 ( -2.44652e-08  2.45368e-08 ) ergs/cm2
Cutoff power-law model
Time interval is from   15.404 sec. to   16.404 sec.
Spectral model in the cutoff power-law:
------------------------------------------------------------
Parameters  : value       lower 90%   higher 90%
Photon index: -1.07477     ( -0.245616   0.2667 )
Epeak [keV] : 225.672      ( -92.8737 -225.672 )
Norm@50keV  : 7.79795E-02    ( -0.0171595   0.0248138 )
------------------------------------------------------------
#Fit statistic : Chi-Squared =          41.25 using 59 PHA bins.
# Reduced chi-squared =         0.7367 for     56 degrees of freedom
# Null hypothesis probability =   9.297962e-01

Photon flux (15-150 keV)    in 1 sec: 7.22636 ( -0.29302  0.29332 ) ph/cm2/s
Energy fluence (15-150 keV)             : 2.31361e-07 ( -1.99975e-08  1.15292e-08 ) ergs/cm2
Time-resolved spectra
Distribution
T90 vs. Hardness ratio plot
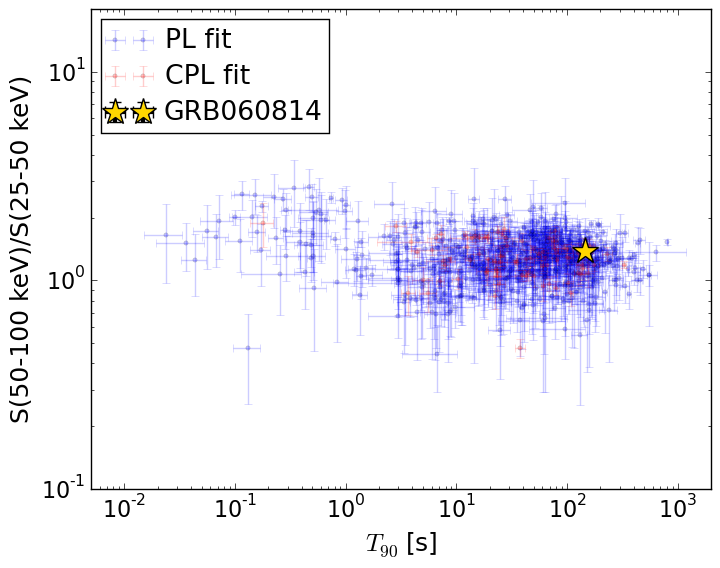
T90                                   = 145.072 sec.
Hardness ratio (energy fluence ratio) = 1.38749067555
S(15-50 keV) vs. S(50-150 keV) plot
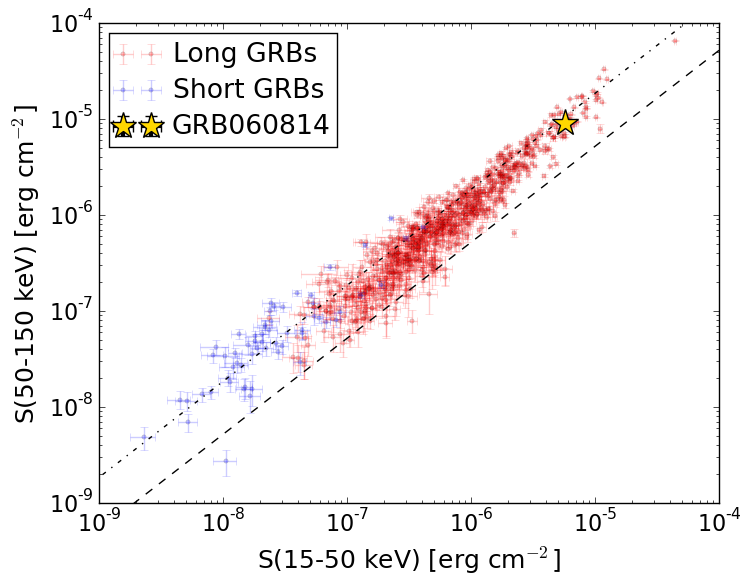
S(15-50 keV)  = 5.753945e-06
S(50-150 keV) = 9.024648e-06
The dash-dotted line and the dashed line traces the fluences calculated from the Band function with Epeak = 15 and 150 keV, respectively. Both lines assume a canonical values of alpha = -1 and beta = -2.5.
Mask shadow pattern
IMX = 4.701831000939438E-01, IMY = -2.550234748945609E-01
Spacecraft aspect plot
Bright source in the pre-burst/pre-slew/post-slew images
Pre-burst image of 15-350 keV band
Time interval of the image:
-26.315400 -11.688000

# RAcent  DECcent POSerr Theta    Phi  PeakCts   SNR AngSep     Name
#  [deg]    [deg]    ['] [deg]  [deg]                   [']
Pre-slew background subtracted image of 15-350 keV band
Time interval of the image:
-11.688000 11.884600

# RAcent  DECcent POSerr Theta    Phi  PeakCts   SNR AngSep     Name
#  [deg]    [deg]    ['] [deg]  [deg]                   [']
221.3405  20.5870    0.2  28.1   28.5   4.9251  46.3 ------	UNKNOWN
203.7720 -32.2578    2.4  30.7  171.2   0.4440   4.9 ------	UNKNOWN
203.7082  14.5350    2.8  16.1   -8.4   0.3186   4.2 ------	UNKNOWN
174.8143 -53.8337    2.4  57.4 -168.8   1.8129   4.9 ------	UNKNOWN
173.2184 -48.6358    2.5  53.8 -164.1   0.9718   4.5 ------	UNKNOWN
Post-slew image of 15-350 keV band
Time interval of the image:
60.484590 962.638000

# RAcent  DECcent POSerr Theta    Phi  PeakCts   SNR AngSep     Name
#  [deg]    [deg]    ['] [deg]  [deg]                   [']
244.9909 -15.6362    0.4  43.0  136.4  52.8910  25.6    0.7	Sco X-1
254.4723  35.3311    0.8  32.5   46.8  12.3778  14.4    1.0	Her X-1
221.3470  20.5907    0.5   0.0 -132.0  11.6360  22.1 ------	UNKNOWN
188.7086   8.6964    3.1  33.7 -115.0   2.8331   3.6 ------	UNKNOWN
180.1127   0.8874    3.1  44.8 -119.9  10.1669   3.7 ------	UNKNOWN
176.9412  25.5447    3.7  41.0  -83.5   8.6325   3.1 ------	UNKNOWN