Analysis Summary
Notes:
- 1) No attempt has been made to eliminate the non-significant decimal places.
- 2) This batgrbproduct analysis is done using the HEASARC data.
- 3) This batgrbproduct analysis is using the flight position for the mask-weighting calculation.
======================================================================
                  BAT GRB EVENT DATA PROCESSING REPORT
    Process Script Ver: batgrbproduct v2.46
    Process Start Time: Wed Jan 22 14:09:32 EST 2014
             Host Name: batevent1
   Current Working Dir: /local/data/batevent/batevent_reproc/trigger226382
======================================================================

  Trigger: 00226382      Segment: 000

  BAT Trigger Time: 178167599.104   [s; MET]
      Trigger Stop: 178167600.128   [s; MET]
               UTC: 2006-08-25T02:59:57.702280    [includes UTCF correction]
       Where From?: TDRSS position message

  BAT
    RA: 18.1016258752534   Dec: 55.8051742050065  [deg; J2000]

     Catalogged Source?: NO
     Point Source?:      YES
     GRB Indicated?:     YES    [ by BAT flight software ]
     Image S/N Ratio:    20.09
     Image Trigger?:     NO
     Rate S/N Ratio:     54.018515344278  [ if not an image trigger ]
     Image S/N Ratio:    20.09

  Analysis Position:   [ source = BAT ]
    RA: 18.1016258752534   Dec: 55.8051742050065  [deg; J2000]

  Refined Position:   [ source = BAT pre-slew burst ]
    RA: 18.1355182124688   Dec: 55.7922281370384  [deg; J2000]
        { 01h 12m 32.5s , +55d 47' 32.0" }
         +/- 0.750667663473978 [arcmin] (estimated 90% radius based on SNR)
         +/- 0.247981998929411 [arcmin] (formal 1-sigma fit error)
    SNR: 45.8194873169754

  Angular difference between the analysis and refined position is 1.382007 arcmin

  Partial Coding Fraction: 0.90625    [ including projection effects ]

  Duration
     T90: 7.97600001096725 +/- 0.656804374838406
        Measured from: -1.98800000548363
                   to: 5.98800000548363     [s; relative to TRIGTIME]
     T50: 3.79199999570847 +/- 0.188679632244615
        Measured from: 0.180000007152557
                   to: 3.97200000286102     [s; relative to TRIGTIME]


  Fluence
     Peak Flux  (peak 1 second)
        Measured from: 0.0719999969005585
                   to: 1.07199999690056     [s; relative to TRIGTIME]
     Total Fluence
        Measured from: -3.6240000128746
                   to: 7     [s; relative to TRIGTIME]

             Band 1     Band 2     Band 3     Band 4
              15-25      25-50     50-100    100-350     keV
 Total     0.528138   0.737260   0.424862   0.060294
           0.017885   0.019230   0.017022   0.015105 [error]
 Peak      0.085444   0.133831   0.110106   0.014499
           0.005979   0.006748   0.006230   0.004951 [error]

     [ fluence units of on-axis counts / fully illuminated detector ]

======================================================================


====== Table of the duration information =============================

        Value   tstart    tstop
T100   10.624   -3.624    7.000
T90     7.976   -1.988    5.988
T50     3.792    0.180    3.972
Peak    1.000    0.072    1.072


====== Spectral Analysis Summary =====================================

Model      : spectral model: simple power-law (PL) and cutoff power-law (CPL)
Ph_index   : photon index: E^{Ph_index}
Ph_90err   : 90% error of the photon index
Epeak      : Epeak in keV
Epeak_90err: 90% error of Epeak
Norm       : normalization at 50 keV in both the PL model and CPL model
Nomr_90err : 90% error of the normalization
chi2       : Chi-Squared
dof        : degree of freedo

=== Time-averaged spectral analysis ===
(Best model with acceptable fit: CPL)

Model Ph_index Ph_90err_low Ph_90err_hi  Epeak  Epeak_90err_low  Epeak_90err_hi  Norm       Nomr_90err_low    Norm_90err_hi    chi2    dof
PL      -1.691    -0.066      0.066       -           -               -         1.03e-02     -3.82e-04          3.81e-04      81.380   57
CPL     -1.065    -0.281      0.302       71.360      -9.797        20.763      2.16e-02     -6.02e-03          9.17e-03      65.680   56


=== 1-s peak spectral analysis ===
(Best model with acceptable fit: CPL)

Model Ph_index Ph_90err_low Ph_90err_hi  Epeak  Epeak_90err_low  Epeak_90err_hi  Norm       Nomr_90err_low    Norm_90err_hi    chi2    dof
PL      -1.363     -0.096     0.096       -           -               -         2.24e-02     -1.31e-03          1.31e-03      69.240   57
CPL     -0.343     -0.431     0.480       82.763     -12.410        24.818      7.17e-02     -2.73e-02          5.04e-02      50.610   56


=== Fluence/Peak Flux Summary ===

              Model    Band1     Band2     Band3     Band4     Band5     Total
                       15-25     25-50    50-100    100-350    15-150    15-350    keV
Fluence         PL   1.67e-07  2.74e-07  3.39e-07  8.31e-07  1.01e-06  1.61e-06   erg/cm2
      90%_error_low -1.01e-08 -9.97e-09 -1.69e-08 -8.59e-08 -3.95e-08 -9.96e-08   erg/cm2
      90%_error_hi   1.03e-08  9.95e-09  1.69e-08  9.24e-08  3.97e-08  1.05e-07   erg/cm2
Peak flux       PL   8.10e-01  8.84e-01  6.87e-01  8.78e-01  2.71e+00  3.26e+00   ph/cm2/s
      90%_error_low -7.84e-02 -5.46e-02 -4.95e-02 -1.22e-01 -1.57e-01 -1.96e-01   ph/cm2/s
      90%_error_hi   8.08e-02  5.44e-02  4.93e-02  1.33e-01  1.57e-01  1.97e-01   ph/cm2/s

Fluence        CPL   1.51e-07  2.89e-07  3.43e-07  3.39e-07  9.55e-07  1.12e-06   erg/cm2
      90%_error_low -1.22e-08 -1.22e-08 -1.84e-08 -1.01e-07 -4.69e-08 -1.12e-07   erg/cm2
      90%_error_hi   1.23e-08  1.23e-08  1.84e-08  1.52e-07  4.71e-08  1.58e-07   erg/cm2
Peak flux      CPL   6.64e-01  9.61e-01  7.45e-01  3.37e-01  2.60e+00  2.71e+00   ph/cm2/s
      90%_error_low -9.56e-02 -6.55e-02 -5.83e-02 -1.06e-01 -1.64e-01 -1.98e-01   ph/cm2/s
      90%_error_hi   9.80e-02  6.67e-02  5.91e-02  1.52e-01  1.64e-01  2.17e-01   ph/cm2/s

======================================================================
Image
Pre-slew 15.0-350.0 keV image (Event data)
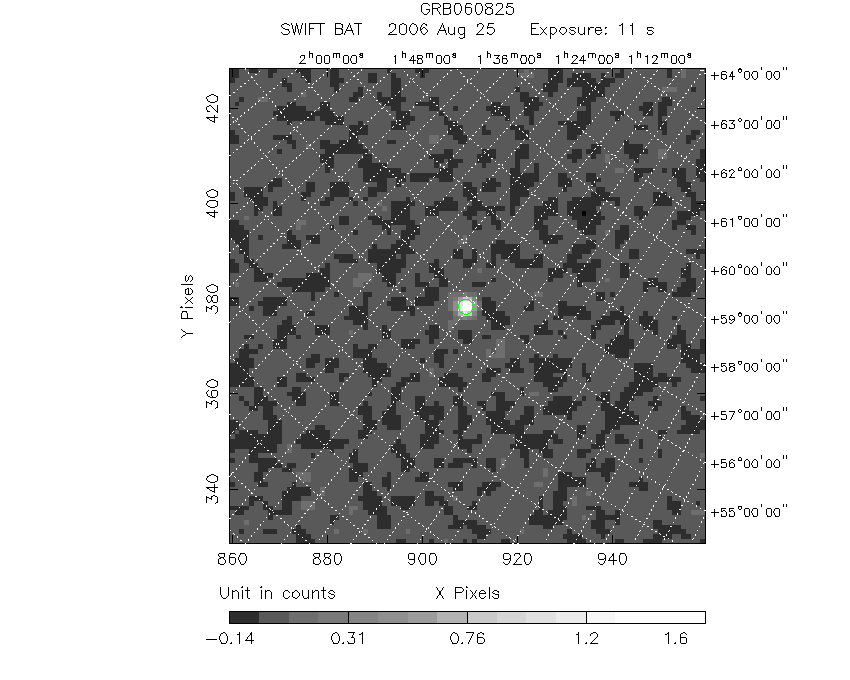
#   RAcent    DECcent   POSerr    Theta     Phi              Peak Cts       SNR   Name
   18.1355    55.7922   0.0042    12.1656   106.6889         1.7526899     45.819 TRIG_00226382

Foreground time interval of the image:
 -3.624   7.000 (delta_t =  10.624 [sec])
Background time interval of the image:
-239.104  -3.624 (delta_t = 235.480 [sec])
Light Curves
Note: The mask-weighted lightcurves have units of either count/det or counts/sec/det, where a det is 0.4 x 0.4 = 0.16 sq cm.
Full-time range; 1 s binning
Other quick-look light curves:
- 64 ms binning (zoomed)
- 16 ms binning (zoomed)
- 8 ms binning (zoomed)
- 2 ms binning (zoomed)
- SN=5 or 10 s binning (full-time range)
- Raw light curve
Spectra
- 64 ms binning (zoomed)
- 16 ms binning (zoomed)
- 8 ms binning (zoomed)
- 2 ms binning (zoomed)
- SN=5 or 10 s binning (full-time range)
- Raw light curve
Spectra
Notes:
- 1) The fitting includes the systematic errors.
- 2) When the burst includes telescope slew time periods, the fitting uses an average response file made from multiple 5-s response files through out the slew time plus single time preiod for the non-slew times, and weighted by the total counts in the corresponding time period using addrmf. An average response file is needed becuase a spectral fit using the pre-slew DRM will introduce some errors in both a spectral shape and a normalization if the PHA file contains a lot of the slew/post-slew time interval.
- 3) For fits to more complicated models (e.g. a power-law over a cutoff power-law), the BAT team has decided to require a chi-square improvement of more than 6 for each extra dof.
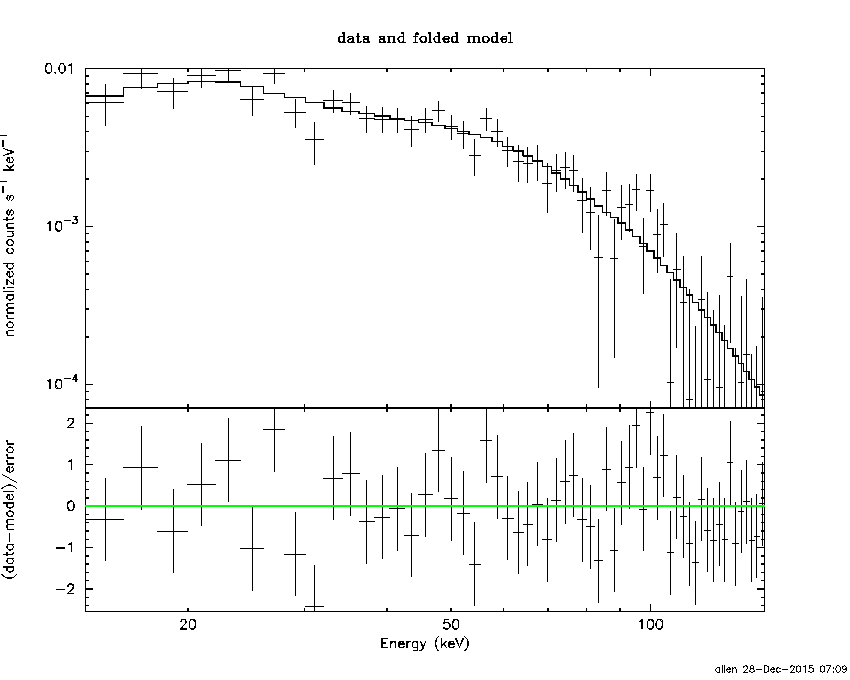
Time averaged spectrum fit using the average DRM
Power-law model
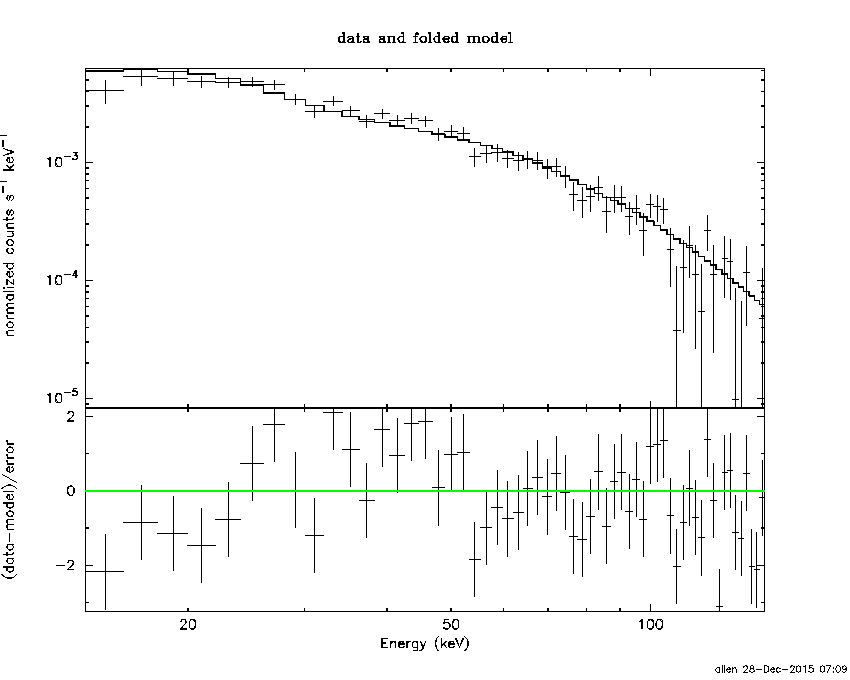
Time interval is from   -3.624 sec. to    7.000 sec.

Spectral model in power-law:
------------------------------------------------------------
Parameters  : value       lower 90%   higher 90%
Photon index: -1.69065     ( -0.0659846   0.0655201 )
Norm@50keV  : 1.03078E-02    ( -0.00038195   0.000380709 )
------------------------------------------------------------
#Fit statistic : Chi-Squared =          81.38 using 59 PHA bins.
# Reduced chi-squared =          1.428 for     57 degrees of freedom
# Null hypothesis probability =   1.871530e-02

Photon flux (15-150 keV)    in 10.62 sec: 1.36461 ( -0.04994  0.05003 ) ph/cm2/s
Energy fluence (15-150 keV)             : 1.01446e-06 ( -3.95496e-08  3.97441e-08 ) ergs/cm2
Cutoff power-law model
Time interval is from   -3.624 sec. to    7.000 sec.
Spectral model in the cutoff power-law:
------------------------------------------------------------
Parameters  : value       lower 90%   higher 90%
Photon index: -1.06516     ( -0.281002   0.301808 )
Epeak [keV] : 71.3599      ( -9.79753 20.7626 )
Norm@50keV  : 2.16475E-02    ( -0.00602185   0.00917113 )
------------------------------------------------------------
#Fit statistic : Chi-Squared =          65.68 using 59 PHA bins.
# Reduced chi-squared =          1.173 for     56 degrees of freedom
# Null hypothesis probability =   1.764728e-01

Photon flux (15-150 keV)    in 10.62 sec: 1.31142 ( -0.05465  0.05473 ) ph/cm2/s
Energy fluence (15-150 keV)             : 9.54826e-07 ( -4.68498e-08  4.70973e-08 ) ergs/cm2
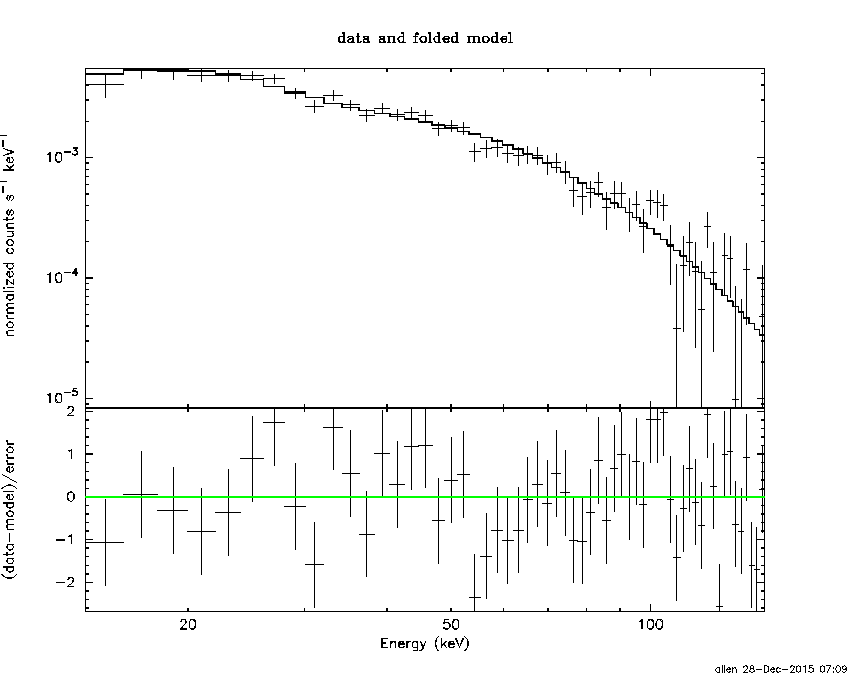
1-s peak spectrum fit
Power-law model
Time interval is from    0.072 sec. to    1.072 sec.

Spectral model in power-law:
------------------------------------------------------------
Parameters  : value       lower 90%   higher 90%
Photon index: -1.36312     ( -0.0963172   0.095728 )
Norm@50keV  : 2.24282E-02    ( -0.00131145   0.00130894 )
------------------------------------------------------------
#Fit statistic : Chi-Squared =          69.24 using 59 PHA bins.
# Reduced chi-squared =          1.215 for     57 degrees of freedom
# Null hypothesis probability =   1.282873e-01

Photon flux (15-150 keV)    in 1 sec: 2.70939 ( -0.15673  0.15681 ) ph/cm2/s
Energy fluence (15-150 keV)             : 2.18439e-07 ( -1.43357e-08  1.44452e-08 ) ergs/cm2
Cutoff power-law model
Time interval is from    0.072 sec. to    1.072 sec.
Spectral model in the cutoff power-law:
------------------------------------------------------------
Parameters  : value       lower 90%   higher 90%
Photon index: -0.343012     ( -0.431187   0.480413 )
Epeak [keV] : 82.7631      ( -12.4096 24.8183 )
Norm@50keV  : 7.16592E-02    ( -0.0272669   0.0503768 )
------------------------------------------------------------
#Fit statistic : Chi-Squared =          50.61 using 59 PHA bins.
# Reduced chi-squared =         0.9037 for     56 degrees of freedom
# Null hypothesis probability =   6.784175e-01

Photon flux (15-150 keV)    in 1 sec: 2.59568 ( -0.1636  0.16353 ) ph/cm2/s
Energy fluence (15-150 keV)             : 2.03451e-07 ( -1.56145e-08  1.57639e-08 ) ergs/cm2
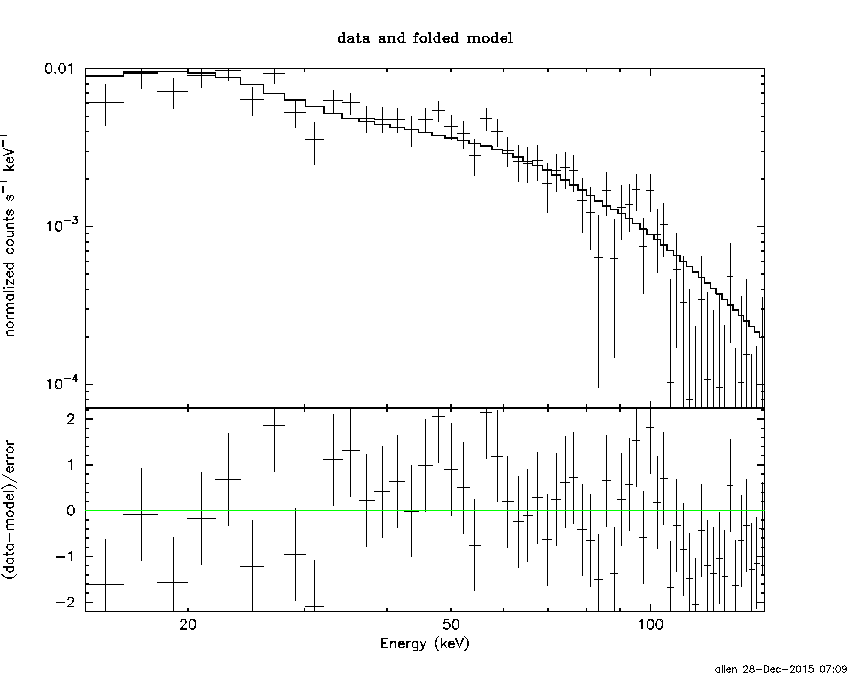
Time-resolved spectra
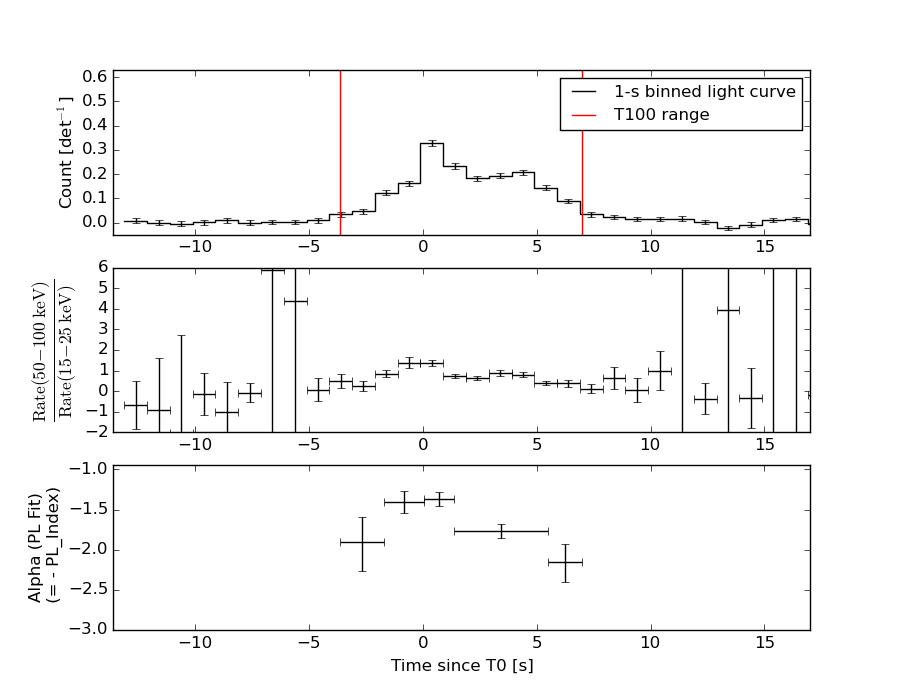
Distribution
T90 vs. Hardness ratio plot
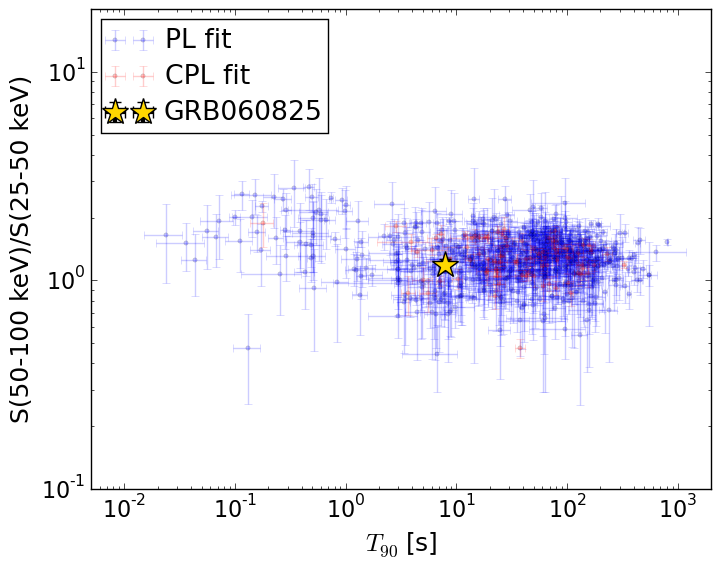
T90                                   = 7.976 sec.
Hardness ratio (energy fluence ratio) = 1.18686143711
S(15-50 keV) vs. S(50-150 keV) plot
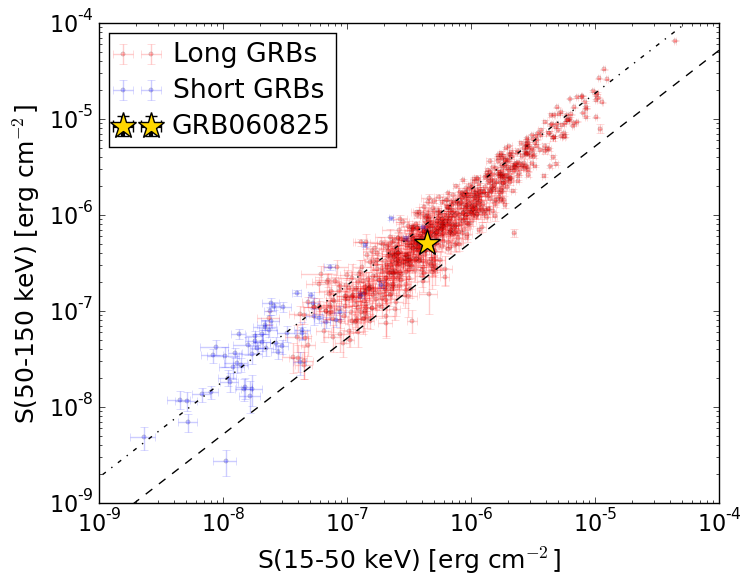
S(15-50 keV)  = 4.397486e-07
S(50-150 keV) = 5.150778e-07
The dash-dotted line and the dashed line traces the fluences calculated from the Band function with Epeak = 15 and 150 keV, respectively. Both lines assume a canonical values of alpha = -1 and beta = -2.5.
Mask shadow pattern
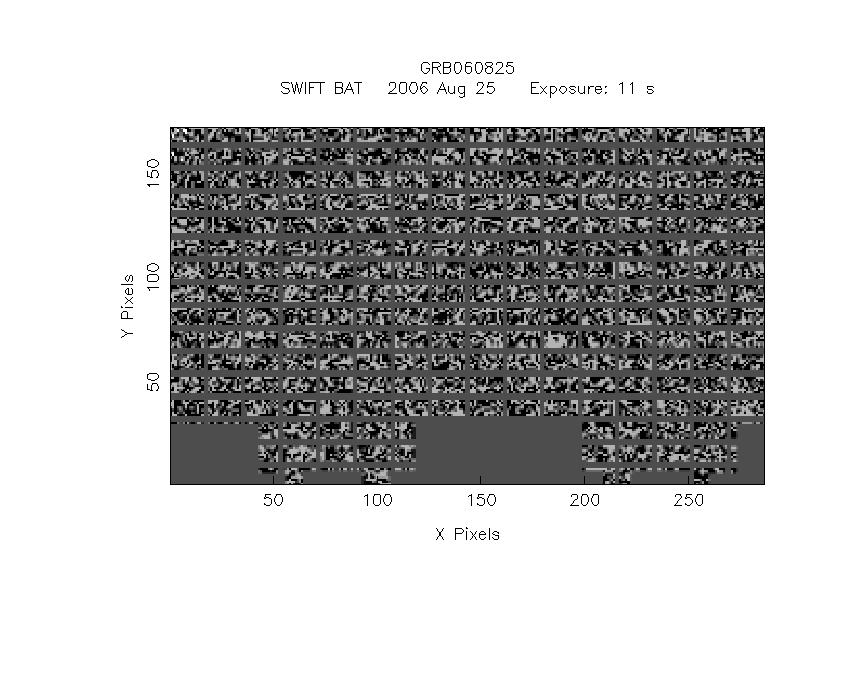
IMX = -6.190908599602463E-02, IMY = -2.064984497034719E-01
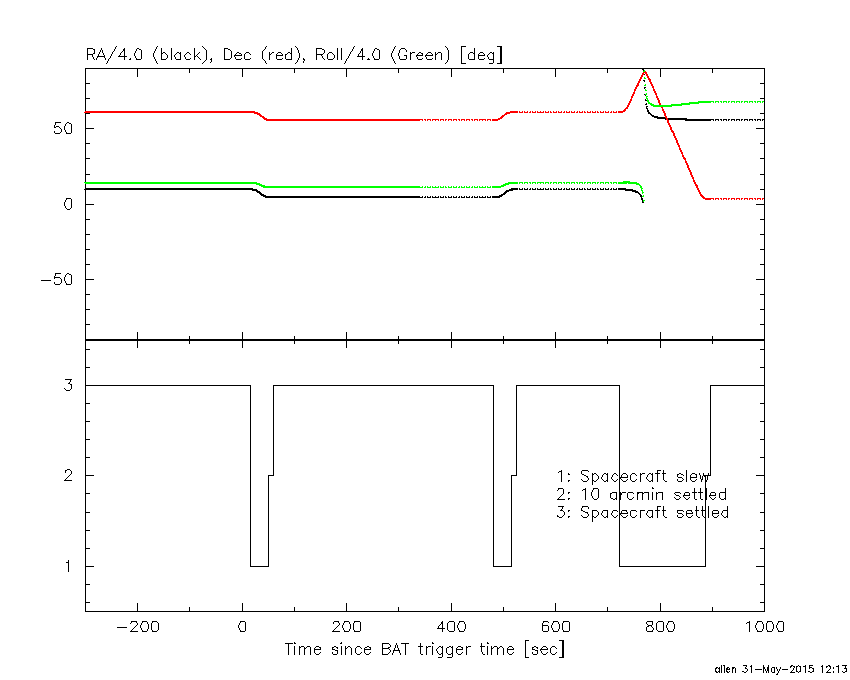
Spacecraft aspect plot
Bright source in the pre-burst/pre-slew/post-slew images
Pre-burst image of 15-350 keV band
Time interval of the image:
-239.104000 -3.624000

# RAcent  DECcent POSerr Theta    Phi  PeakCts   SNR AngSep     Name
#  [deg]    [deg]    ['] [deg]  [deg]                   [']
 83.6150  22.0112    0.6  49.5  -25.7   8.6481  20.4    1.0	Crab
 64.6639   6.9789    3.3  57.3    2.3   3.3761   3.5 ------	UNKNOWN
 53.4431  47.9566    2.6  15.4   -5.5   0.6616   4.4 ------	UNKNOWN
 96.9197  48.9698    2.5  33.9  -63.3   1.2209   4.6 ------	UNKNOWN
Pre-slew background subtracted image of 15-350 keV band
Time interval of the image:
-3.624000 7.000000

# RAcent  DECcent POSerr Theta    Phi  PeakCts   SNR AngSep     Name
#  [deg]    [deg]    ['] [deg]  [deg]                   [']
 83.6598  22.1134    3.2  49.5  -25.8  -0.3301  -3.6    6.1	Crab
 18.1355  55.7922    0.3  12.2  106.7   1.7523  45.8 ------	UNKNOWN
 72.1308  39.3778    2.5  29.6  -25.4   0.2013   4.7 ------	UNKNOWN
138.1706  73.1337    2.4  35.4 -117.6   0.2933   4.8 ------	UNKNOWN
Post-slew image of 15-350 keV band
Time interval of the image:
49.796600 480.996660

# RAcent  DECcent POSerr Theta    Phi  PeakCts   SNR AngSep     Name
#  [deg]    [deg]    ['] [deg]  [deg]                   [']
308.1878  41.0674   23.4  46.5  147.4   0.3993   0.5    7.7	Cyg X-3
326.2452  38.4500    7.0  38.2  130.4   0.9238   1.7    8.4	Cyg X-2
 12.4766  54.2921    2.6   3.6  112.4   0.9792   4.5 ------	UNKNOWN
319.2760  67.7958    2.8  28.9 -177.0   1.0224   4.1 ------	UNKNOWN
 58.0326  11.7669    2.1  53.8   -6.0   3.6433   5.4 ------	UNKNOWN
 56.2749  20.3063    2.2  45.4   -9.3   2.0072   5.3 ------	UNKNOWN
242.2373  76.0076    3.7  45.2 -148.7   1.5481   3.2 ------	UNKNOWN
 83.1912  31.4839    2.7  50.6  -44.6   5.5626   4.3 ------	UNKNOWN